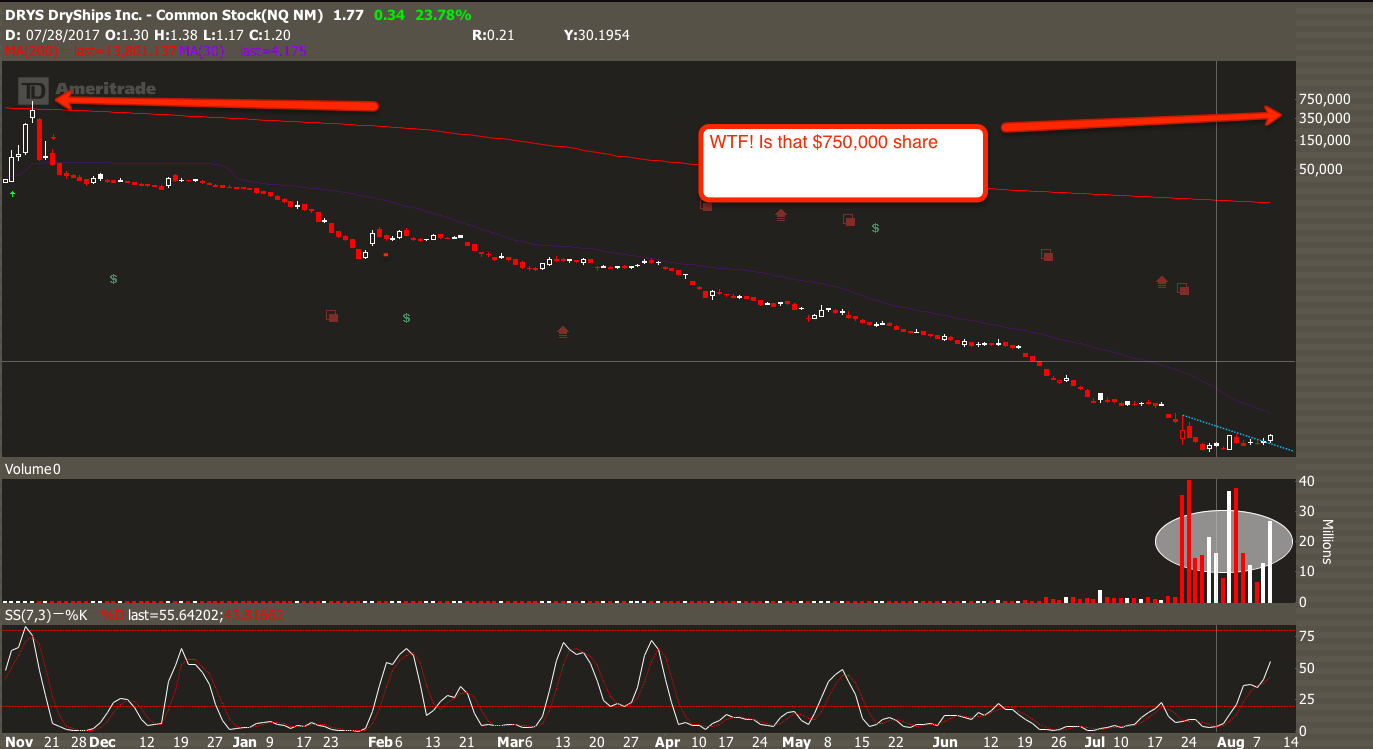
Here’s the chart of the night, compliments of Dryships. How is this sort of thing even allowed? Below, is a 9 month daily chart of $DRYS. When you factor in the countless reverse spits over the course of 2017, the high back in November equates to $677,080. Seriously?
 __
__
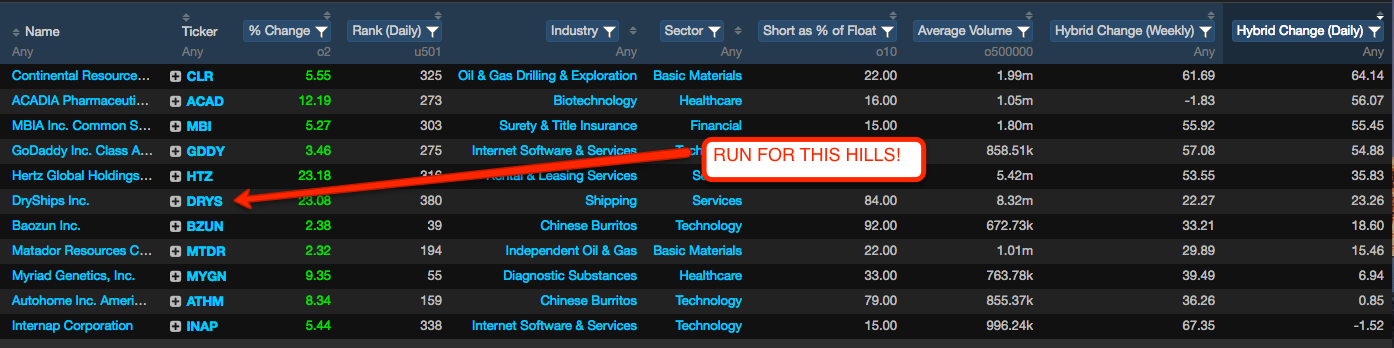
When the kind of stock like $DRYS starts to pop up on your momentum screen, it’s probably time to run for the hills. Trade accordingly.


https://i.redd.it/qfwmo2tkttez.png
LOL.
Haha, nice @Zero
That’s awesome!! HAHA
LOL so he currently owns roughly one share?
last tranche of dilution closing in , could pop hard like it did 2 3 times
just algo-bot speculation on shorts
On Yahoo finance it is $1,396,033,664. Some software programmer can’t do basic math
I love my exodus screens. Market tanks, it tells me to buy $DRYS.