iBankCoin
Home / Tag Archives: $SPY (page 9)

Tag Archives: $SPY

Stay Focused on The Big Board

The market balanced out overnight after an early evening of weakness perhaps spurred on by the weak numbers out of tech giants Google and Microsoft.  Therefore, we should be cognizant of the market’s reaction to these afterhours moves early on today.

We have giants GE, SLB, and HON set to report any minute which could get things moving.

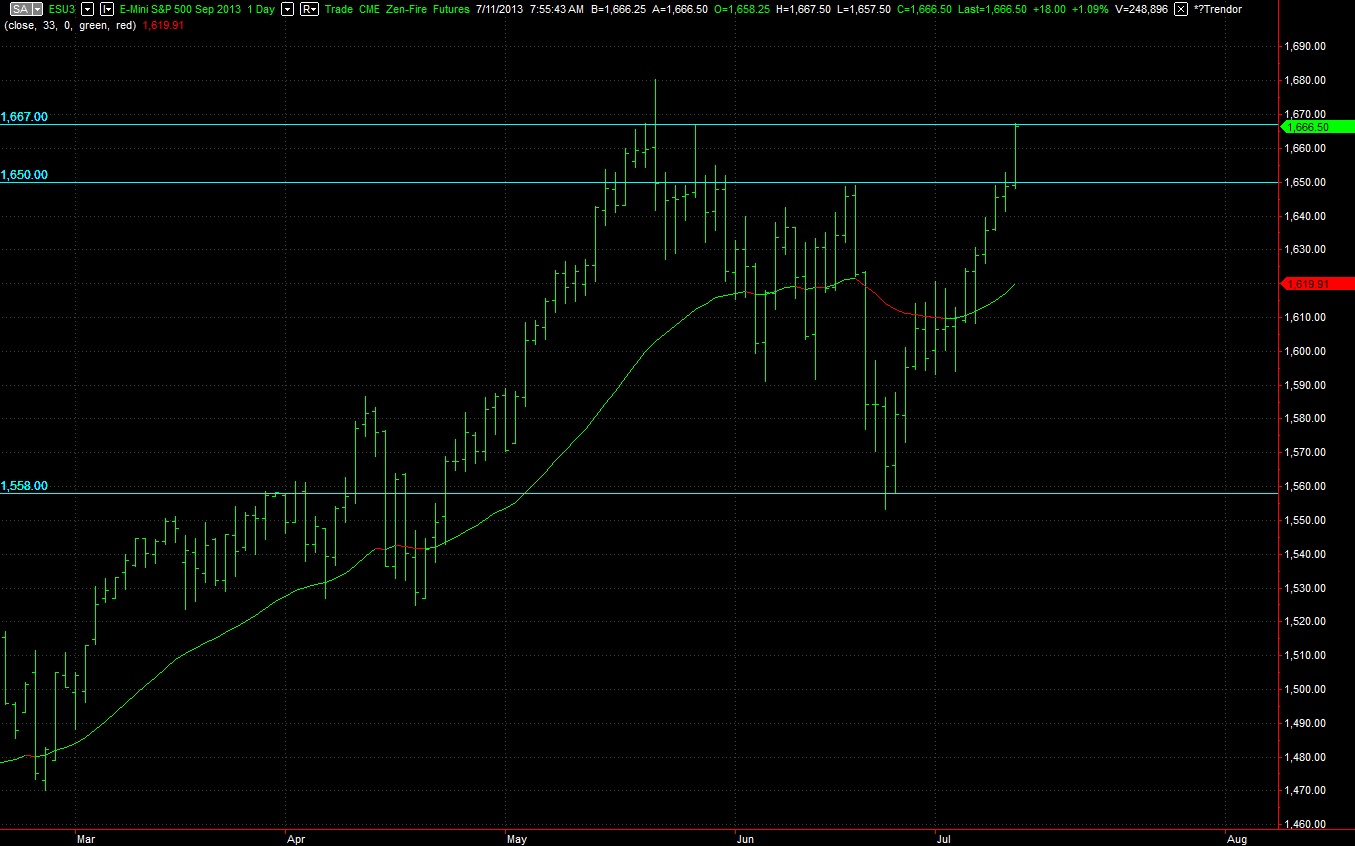
All this is important but shouldn’t take our attention too far from the broad S&P and how it behaves today.

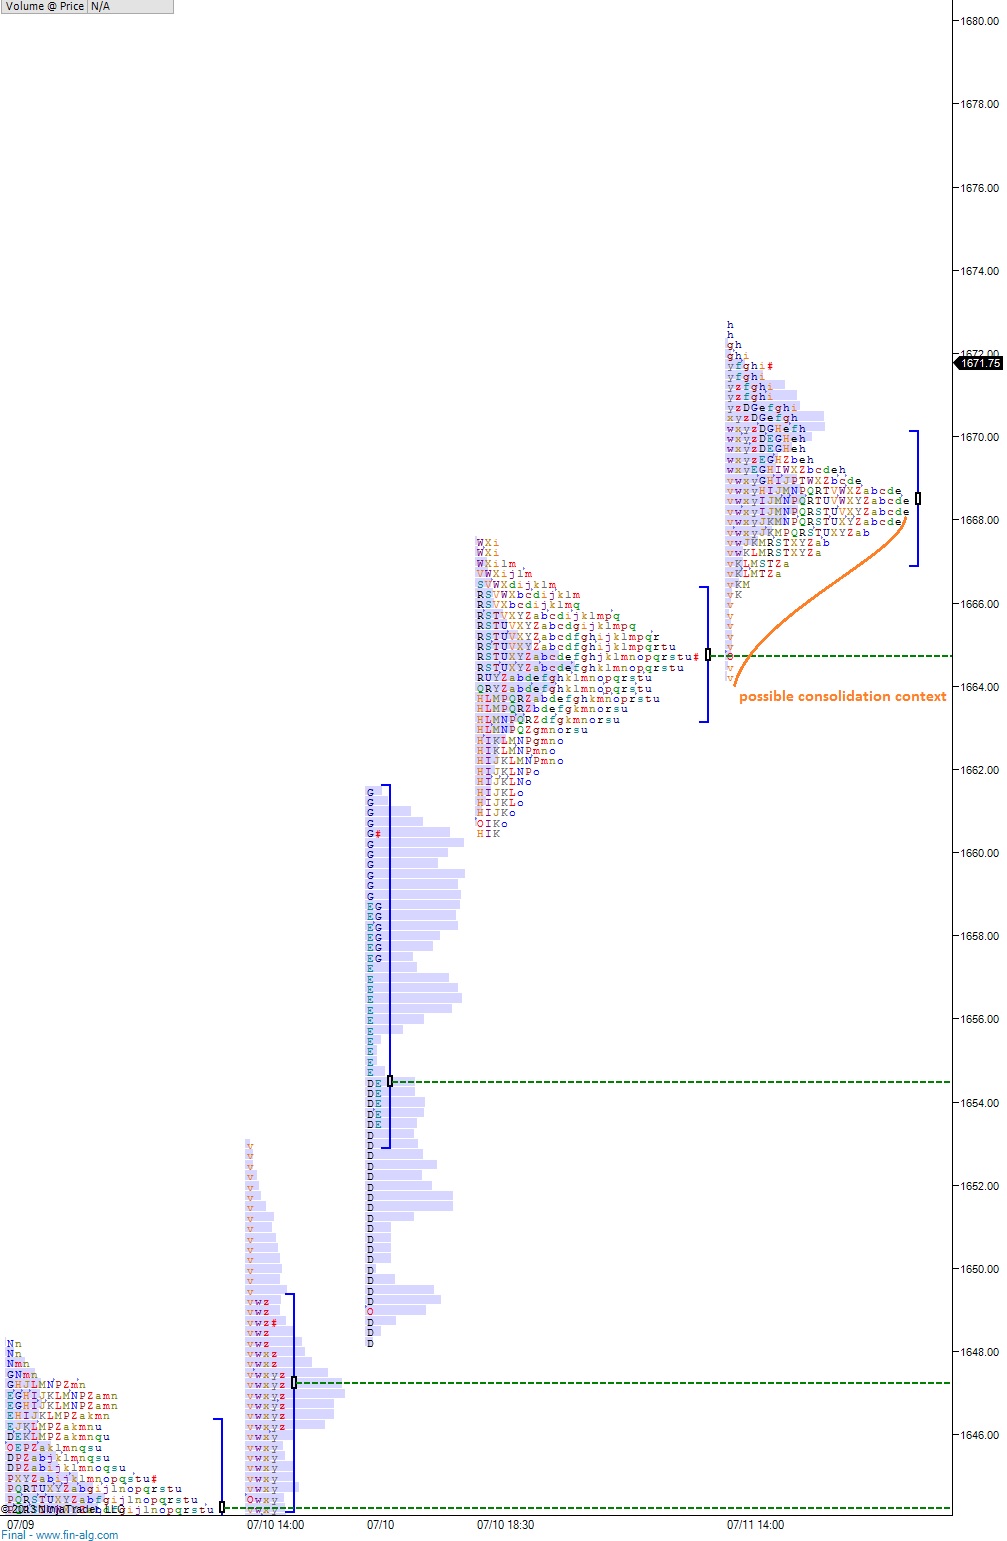
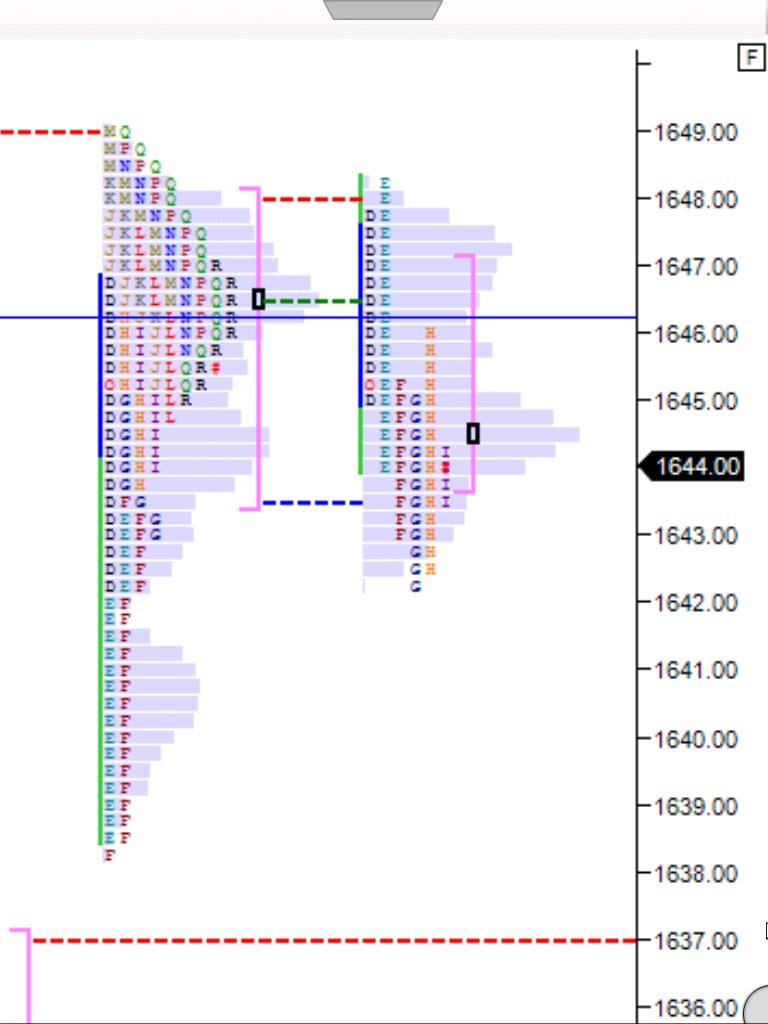
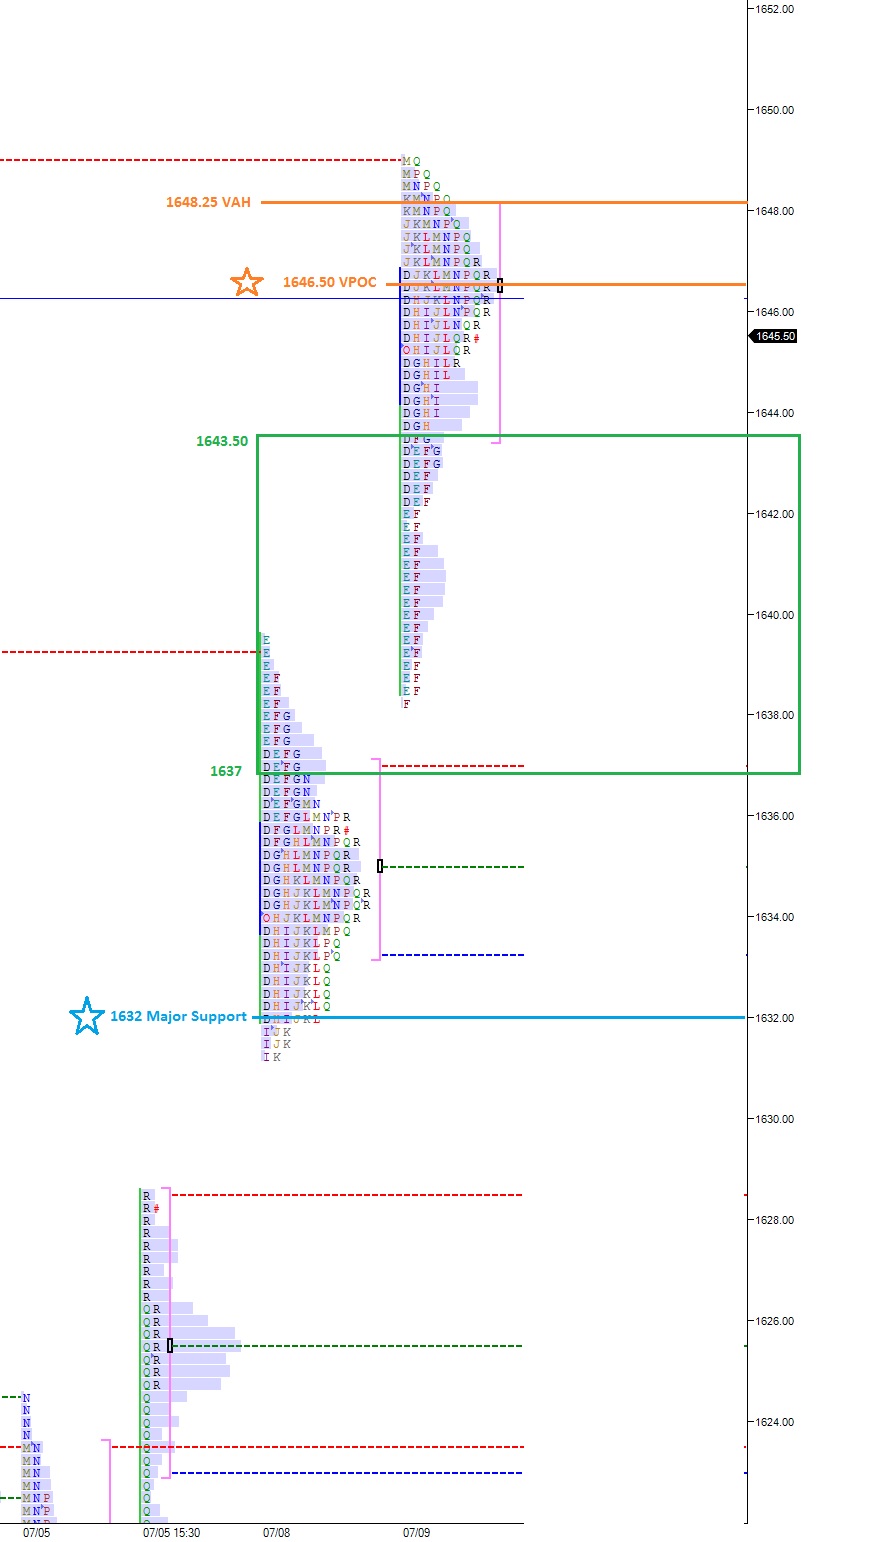
Many of the Chicago traders are pleased with the recent market activity as it’s auctioning very neatly within the confines of the market profiles.  It’s also doing so in a very slow manner.  Therefore, it’s more important than ever to know their relevant levels as their confidence in the tape increases.

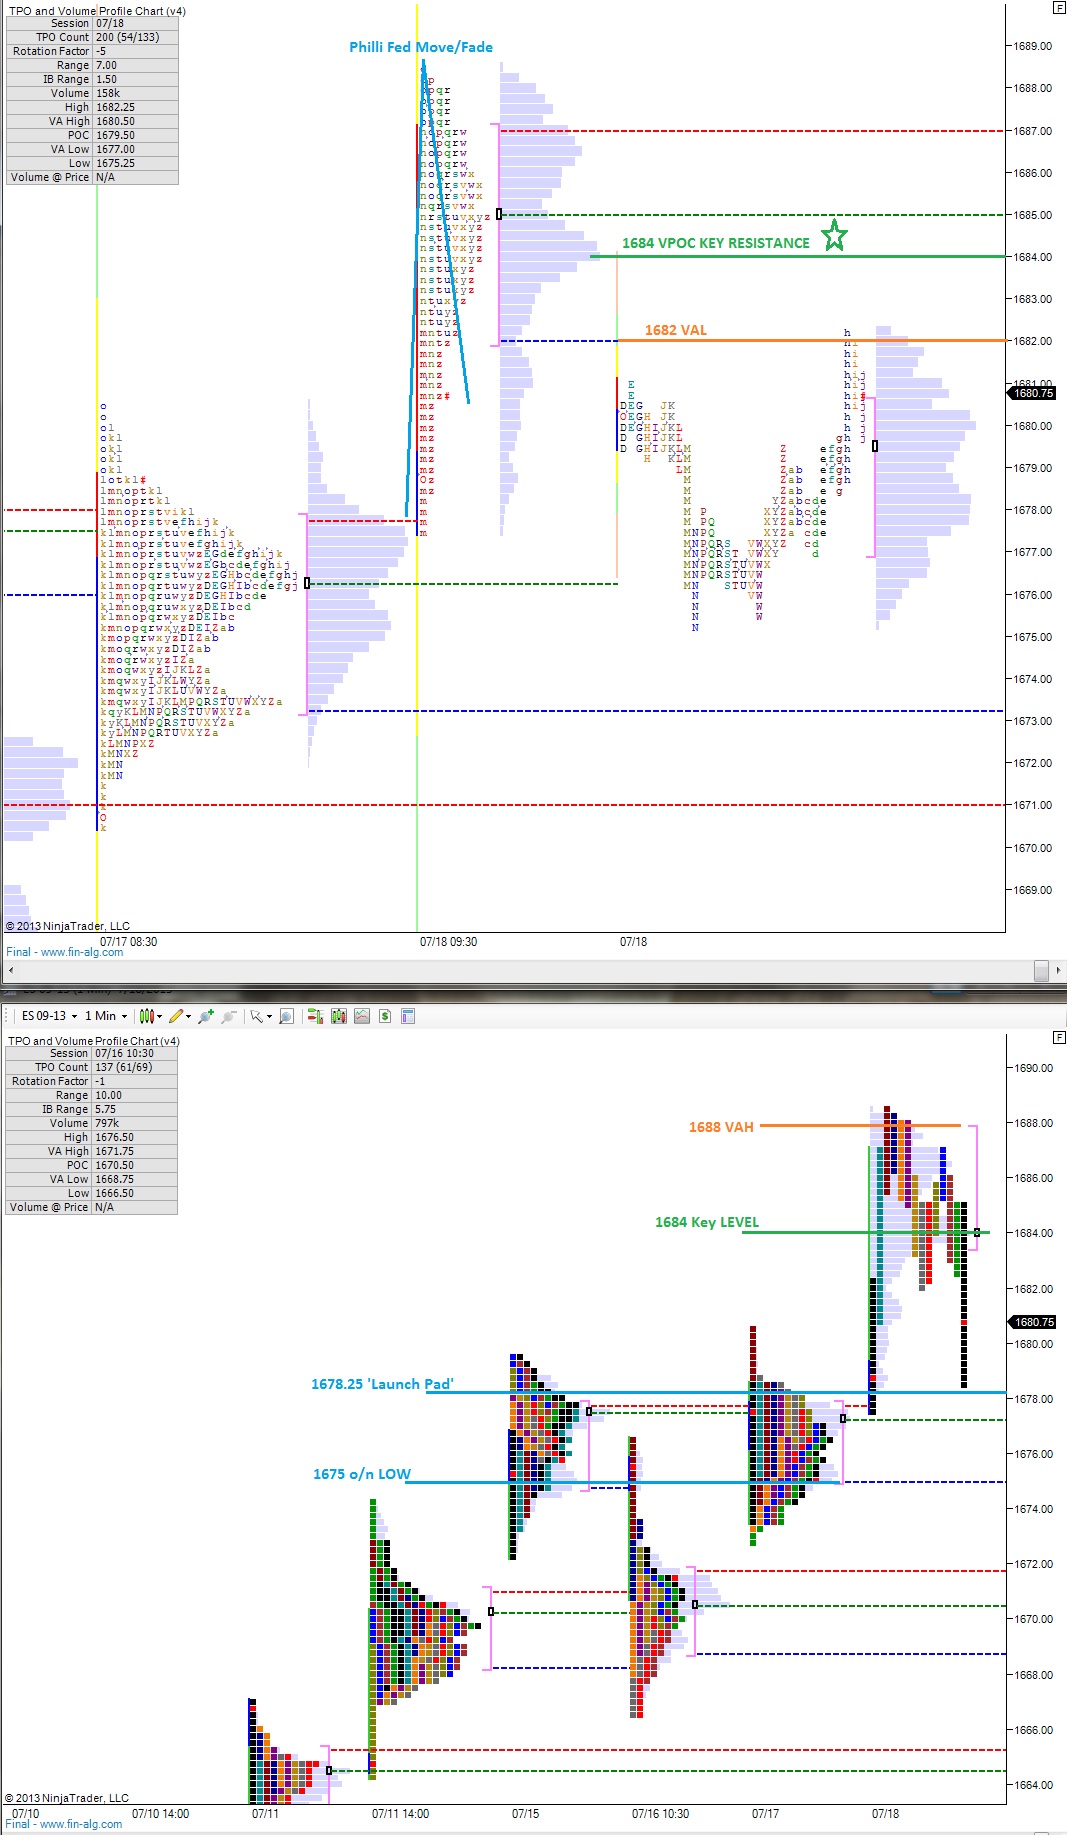
I’ve highlighted this week’s levels of key market activity in the following profile charts.  The ‘Launch Pad’ was discussed yesterday morning, and essentially represents the key accomplishment of the bulls this week.  We want to see them defending 1678.25 early on.

ES_MarketProfile_07192013

Comments »

Building a Launch Pad

Buyers are letting it be known they mean business between the range of 1672.75 – 1671.75 which is the price zone right above Monday’s long liquidation.  There is a perception that the market is a bargain at this price and below until there isn’t.

It’s my cue for today and if the auction remains tight, it’s my cue the remainder of the week.

Up above the bulls must contend with 1678.25, this price represents the peaks of the shoulders on the intraday head and shoulder pattern yesterday, just below the aggressive seller’s reaction at the all-time highs.  Any acceptance of price above this level will preclude a move higher.

The 24-hour profile has been building up since early Tuesday morning as price remains high and tight.  It does give us a clue, a cave in pricing that we may back-and-fill prior to launch.  Trade into the cave should be monitored for either a sharp knife though or a firm buyer rejection.  This range is from 1676 – 1673.50.

I’ve highlighted all of these dynamic characteristics in the following profile charts:

ES_MarketProfile_07182013


Comments »

Buying These Deals Now

INTC revenues came in a bit weak and the stock printed a wild electromagnetic pulse after hours but is mostly unchanged.  IBM is up afterhours and SNDK reported great numbers ripping bears to shreds and storing the gif for future enjoyment.

Clearly technology stocks are a store of value.  Be sure to ignore EBAY, the home of porn stars and packrats, they’re getting crushed after hours after guiding lower.

It’s been a rather mild first inning of earnings, has it not?  Where’s all the fire and brimstone I heard so much about?  There’s a lot of baseball left I suppose…

We’re trading along rather quietly amongst the all-time highs this week in many names.  My favorite 52 week high is Zillow, printing a very sexual 69 high water mark.  Leave it to the real estate folks…

The SPY printed a pronounced head and shoulders pattern intraday, but it never followed thru.  It tried once, but was pinched higher after a lack of follow through was presented in the form of selling.  We did have a very aggressive seller reaction at the highs this morning.  It resulted in me staying long in the futures market all session long, missing lunch, and eventually closing the position for small, stupid gain.

I have so many longs set up well, I had to sell a few shares as sacrifice to the rally gods.  I scaled off some FB and some IMMR.

This also gave me some much needed cash, which I promptly placed into GRPN.  I know I like today’s action and I’m one to put money where my mouth is.  Beyond that I abhor Groupon mainly because I’ve only actually used 2 of the 10 coupons I bought.  My assistant buys most of his lunches via their ‘Now’ service, but he has much more time on his hands.

For the day, I’m up on all accounts, albeit modestly.  I still want my space launch.

Comments »

No Follow Thru By the Sellers

Late yesterday morning we saw longs liquidated on the break of 1674.50 which happens to coincide with the value area low of our uppermost distribution.  The long liquidation that followed built the familiar b-shaped profile although the meat of the ‘b’ is a bit wider than in ideal pictures.  Nevertheless, it’s a general concept not a concrete rule.  It suggests the downward development failed to attract new initiating sellers into the market and a buying force greater than the sell flow stopped the downward action.

We have a few key upside levels today, the aforementioned 1674.50, the lower low on yesterday’s session which thus far held overnight at 1672.50, and the high VPOC at 1677.50.

Below we have a still incomplete profile, and trade down to 1664 should come as little surprise.  Bulls however want to see 1662.50 hold as support should we trade down to those prices.

I’ve highlighted these levels and more in the following profile chart:


ES_MarketProfile_07172013

Comments »

Navigating the Highlands

One of the marquee characteristics of climbing to new heights in the market or atop a mountain is small progression.  Think of a climber reaching uncharted territories: her steps become smaller, her moves more calculated and thought out.  The familiar trek below (profiles) gave a navigational map and experience to build progress on, now we’re taking measured moves.

The squatted range yesterday took time to break the initial balance, finally doing so to the upside.  We left an incomplete auction below and we’re likely to eventually fill out the 07/11 profile down from 1667 – 1664.  When this occurs, the treatment of the prices by the market could be a major sentiment piece.

Overnight we’ve been mostly balanced with a top-heavy profile.  A rotation down to 1674 early on would not surprise me.

There’s potentially market-moving data out ahead of the bell, but so far we’re set to open within yesterday’s value.  I’ll be eying the following levels and potential developments in market profile:

ES_MarketProfile_07162013

Comments »

Pressing the Peaks

I’ve highlighted a few pieces of market profile context to keep in mind this week as we wade into earnings with the market on the verge of all-time highs during peak summer heat.  A reasonable amount of back-and-fill would build round out the Gaussian distribution from Friday, taking us back down to 1664 without doing any real harm to the charts.  Even if we continue higher today without fulfilling this expectation, I suspect it will remain as unfinished business in need of reconciliation.

Overnight however, we’ve see the market working higher, buoyed by in line economic data from Asia which sent their bank stocks soaring higher.  As the US wakes up and begins to digest this news we will see them pressing the futures in either direction.

The last two sessions have built up plenty of energy, and we’ve been on the buy side of momentum for almost two weeks.  It’s just something to keep in mind.

I’ve highlighted a few pieces of support in the following profile chart:

ES_MarketProfile_07152013

Comments »

Bring in the Closers

The /ES printed a balanced overnight session in a quiet manner.  We have WFC and JPM earnings on tap here shortly which may get the market moving.  The 24 hour profile suggests we may see some back-and-fill action, rounding out the bell-curve and taking us back down to around 1664.  The order flow as we approach cash open however, suggests we could be setting up for another ramp higher.

I suppose we’ll have a better sense of the market’s early direction once we hear from these two large banks.

Two key levels of support today are 1667.50 and 1660.75.  The latter level marks the upper bounds of the big after hour’s short squeeze that occurred when Chairman Ben said what needed to be said.  Losing this level could result in a liquidation snap, at least 50 percent of the way, down to 1654.

Above on the S&P, we still have the high water mark, 1680 to shoot for.

After a strong week, how the market goes into the weekend will be interesting.  Will we see profit taking and consolidation?  Or will the market continue to press the accelerator into the floorboards?

I’ve attached the following 24-hour profile chart to give you an idea of the consolidation context I initially wrote about:

ES_MarketProfile_07122013


Comments »

Pushing the Limit

We’re approaching the cash open over 15 handles above yesterday’s close thus today’s gap is of the professional variety.  Therefore, attempts to fade the gap intraday will be much more difficult than your typical gap.  This also gives us a puzzle piece: if the gap were to fill that would be very unusual and could signal a peak in the recent move higher.

I’m not saying that’s what’s going to happen, let’s be clear about that.

The large gap does mean today brings higher opportunity as the market is out of balance and must now work the buyers and sellers to re-establish appropriate levels of auction.

Today I’ve zoomed out to see where the S&P 500 is trading via the rolling e-mini future contract.  As was suggested, we’re testing the very upper bounds of a potential range. With the exuberant reaction to Fed Chairman Benjamin’s commentary yesterday evening we’ve wasted no time with 1650 which was of huge significance during May and June.  Instead we’re pinned up against the next major level 1667, which features many of the May peaks and marks the upper quadrant of the 05/22 peak event.

The highs are now just an earshot away at 1680.25 and the question becomes, did we get a level of padding as we enter a patchy earning season?  Are we destined to be range bound this summer?  Or will new highs be made, and met with a flood of initiating buying?

It’s a challenging environment, but in terms of intraday trades: when the overall trend is higher, you give your longs more room to run and allow support a fair chance to work.

It should be a challenge for mean revision to set in today.  Again, I advise you pay close attention to the earnings out of WFC and JPM Friday morning, and then C, MS, and YHOO on Monday.  They should provide direction at this interesting junction.

ES_DAILY_07112013

Comments »

Marking Time

The S&P has done very little so far today, more or less marking time in a very non directional manner.  The only play has been to fade the extremes.  There has been a slow and steady pressure on the bid all session and we’ve traversed yesterday’s entire value area.

We’ve seen range extension lower which suggests we may have already marked the high of the day.  However, we’ve seen a slew of neutral sessions these last few weeks which feature range extension in both directions.  Keep in mind however, over years of daily data, these formations are very uncommon.

I’m from the school of thought that we’re in a summer range, and I believe we’re near the high end of it.  Buying up here thus becomes a higher risk game.  However, We’re yet to test the upper bounds of the range, upward of 1650 -1660, and it seems appropriate to touch those levels before traversing the range again given the “max pain” aspect of the markets.

We could certainly see activity pickup this afternoon after the 2pm FOMC minutes, and perhaps a tradable trend will develop.

In the meantime, individual names are still offering tradable opportunities, and my top pick in this environment remains TPX.

Here’s the quiet profile thus far:

profile

Comments »

Striping the Field as We Await FOMC

The overnight session printed two small rotations lower, taking us around three handles off the closing print.  Should price sustain these levels into the opening bell, the placement suggests we may see a quiet morning auction.

The buyers may make an early attempt to fill the small gap, taking us back up to 1646.50 and perhaps press into yesterday’s value area high at 1648.25.   I suspect we’ll find sellers here, at least initially, as the market awaits the FOMC Minutes at 2pm and the Ben Bernanke commentary after the bell.

It looks like sellers will have a hard time pressing into Monday’s value, but should the selling accelerate, I would look for the market to test down to 1632, which is effectively the launch point from early Monday.

I’ve highlighted these levels in the following profile chart:


ES_MarketProfile_07102013

Comments »