iBankCoin
Home / Tag Archives: $SPY (page 12)

Tag Archives: $SPY

Morning $ES_F Analysis – Building on Strength

Life has a way of slowing you down, much like a solid piece of market resistance.  We gauge the health of an index, commodity, or stock often not by how it handles resistance the first time around, but rather upon subsequent tests.  The pullback is where a stock can build strength and momentum to blast through an obstacle.  Curious enough, the same goes for support.

Let’s say you missed Friday’s session, like me.  You may feel very out of sorts.  If you build an understanding of the market profile, you’ll find it quickly telling the story of Friday and getting you back up to speed.

First off, the “free exposure” given from the rally held true, but only for an hour of Friday’s session, after which the market gave back over half the move.  On the surface, this is bad news for the bulls.  But if you’re in the mindset that we’re in a corrective phase of the market, this action is expected and normal.

Given these conditions, we need to be nimble, rank our positions, be ready to cut old favorites loose and perhaps initiate new positions in better served areas of the markets.  I’ll be back later this morning with thoughts on this.

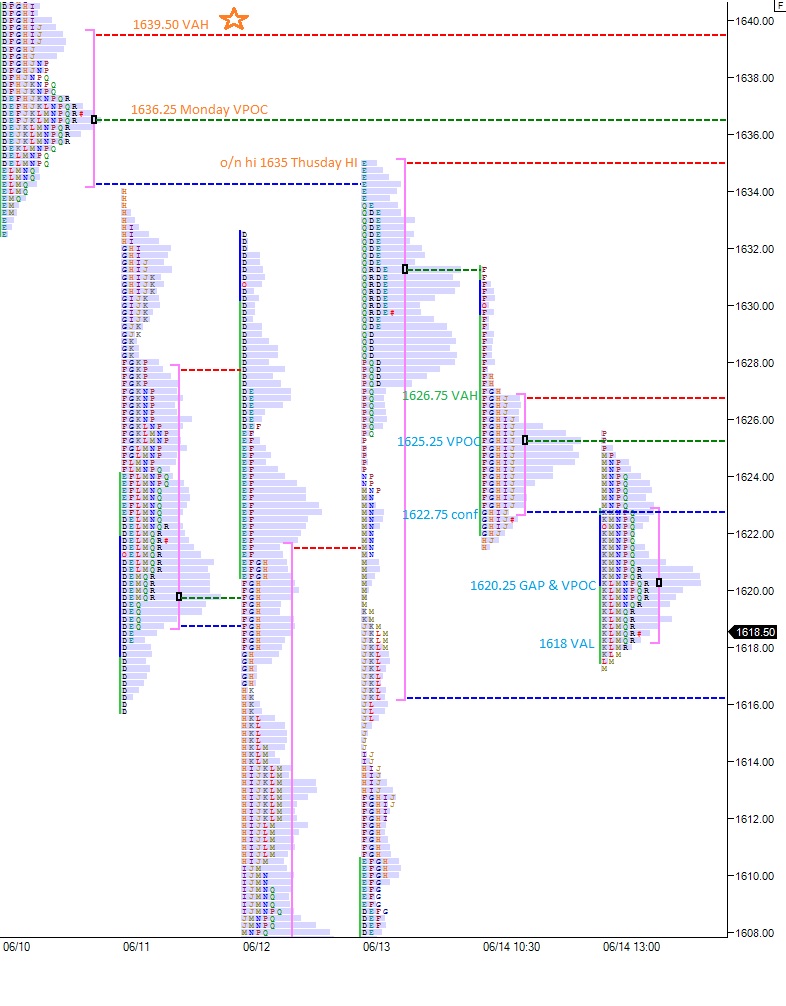
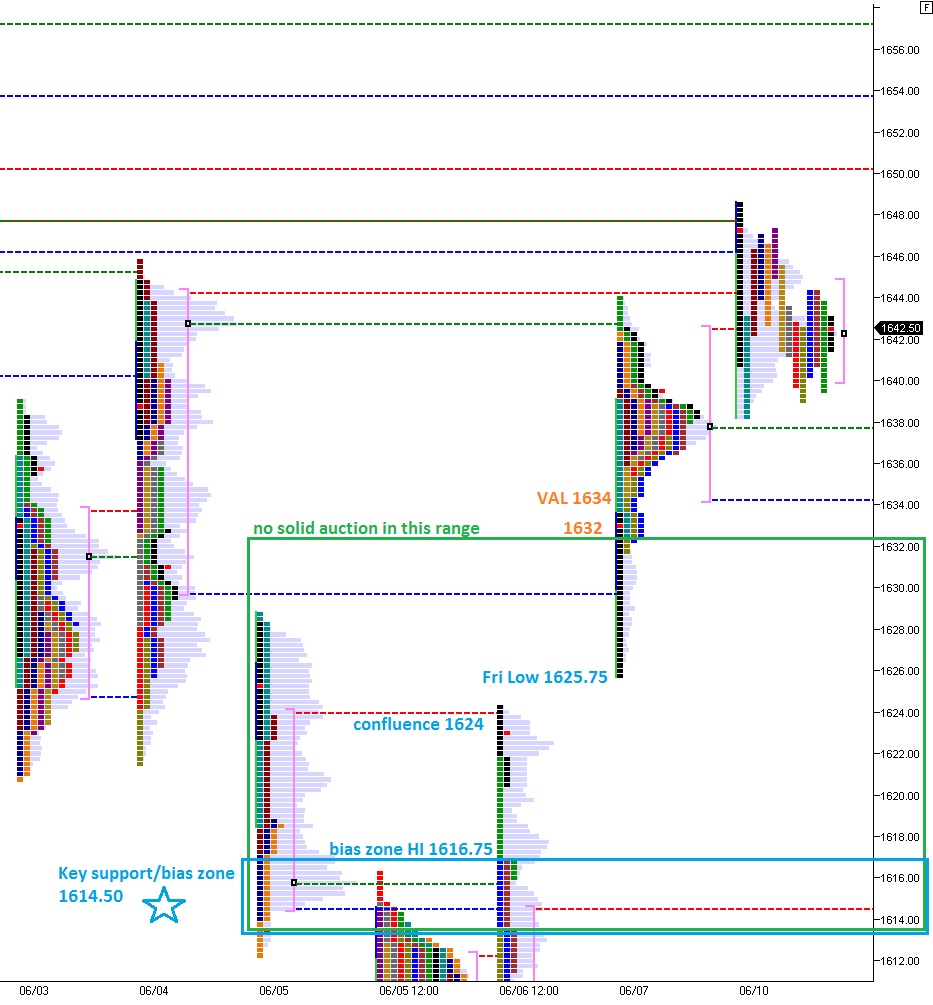
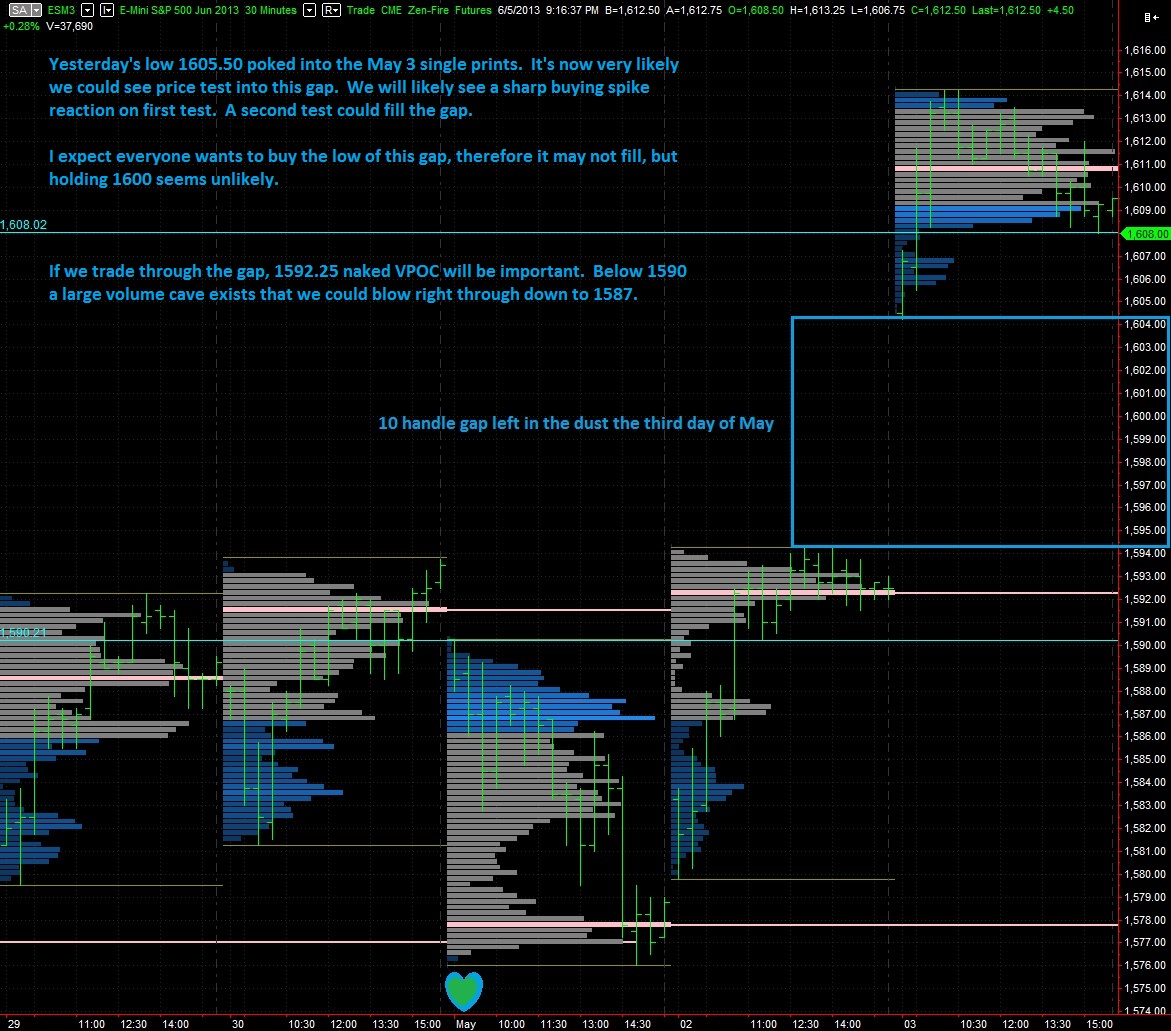
If we lose Friday’s low, things get slippery fast as we traverse Thursday’s dynamic trend.  Up above, we mostly can key off last Monday’s tight auction, and the relevant levels produced from its auction.

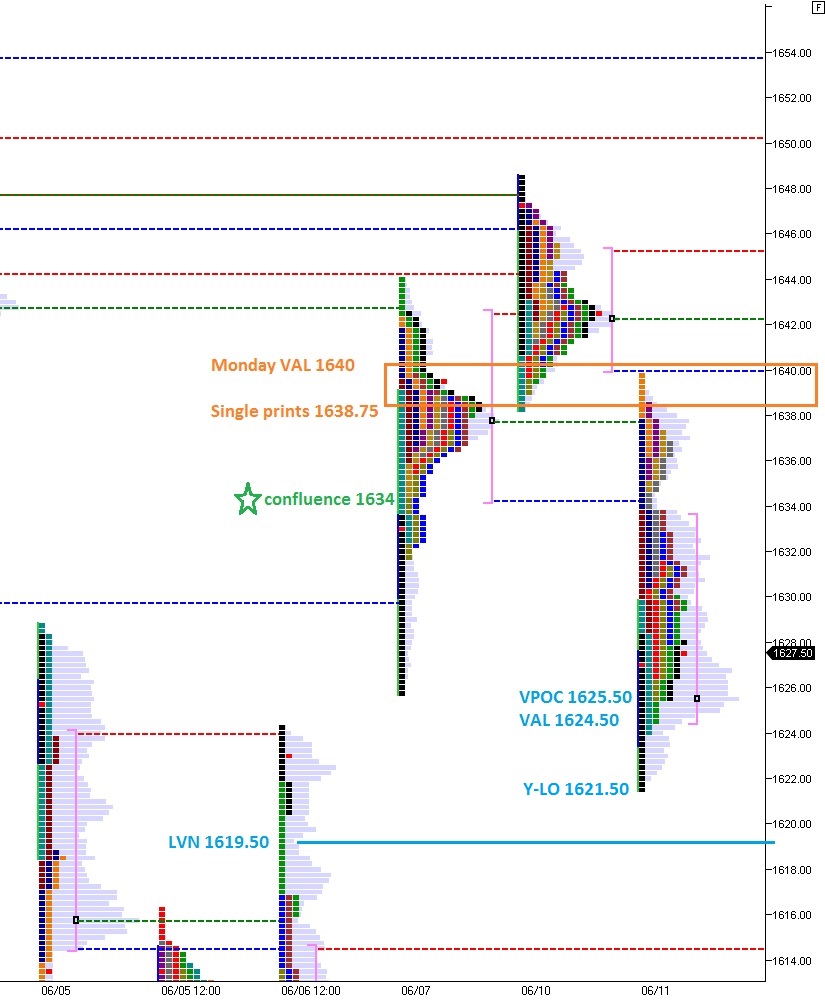
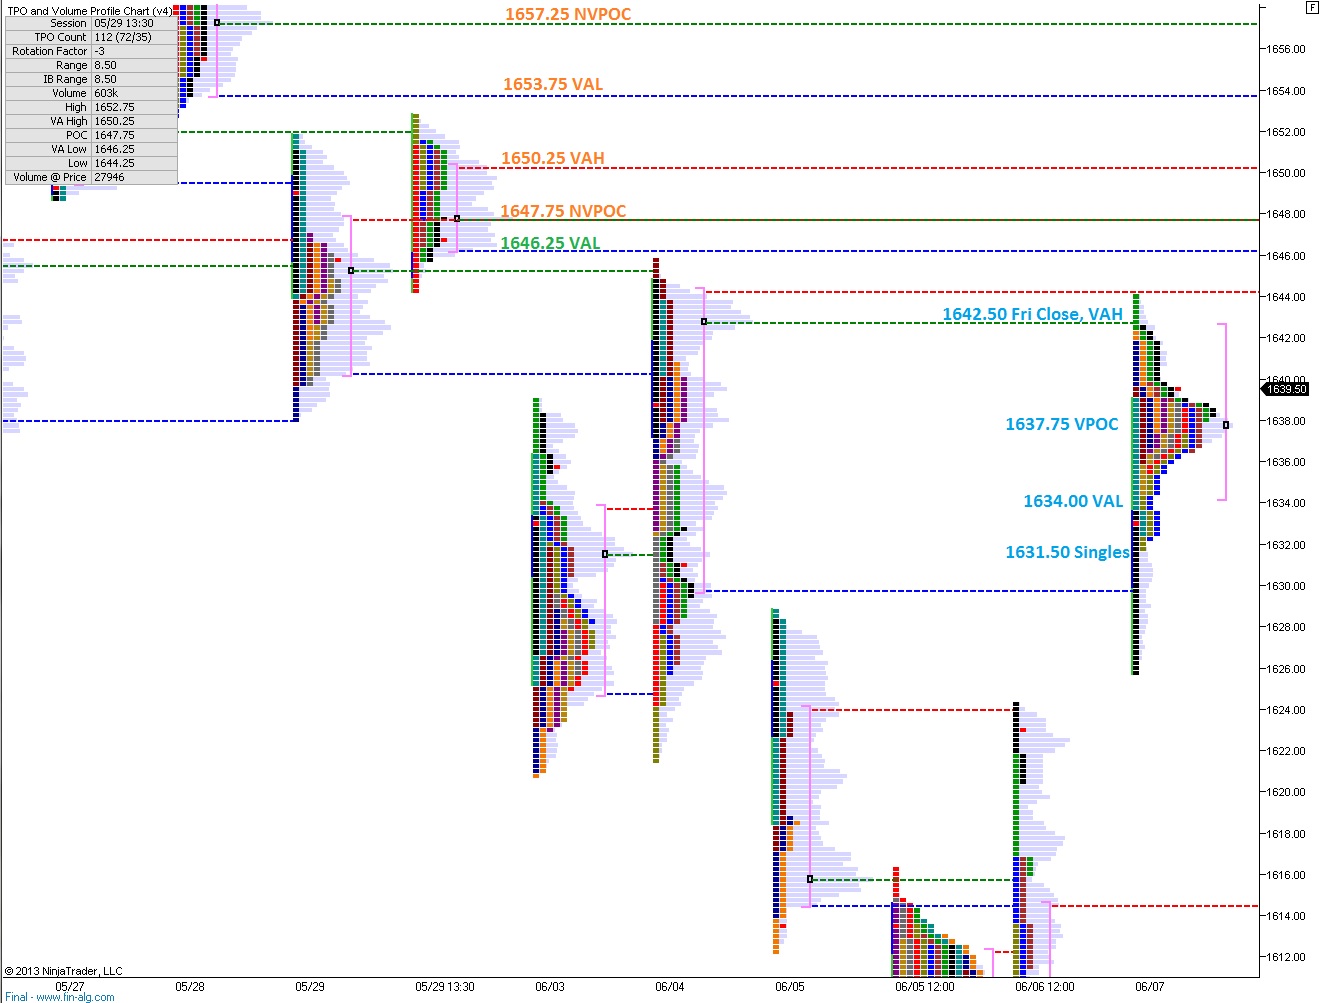
To my eyes, the major hand tip comes from accepting price either over 1639.50 value area high 06/10 or Thursday’s low at 1601.

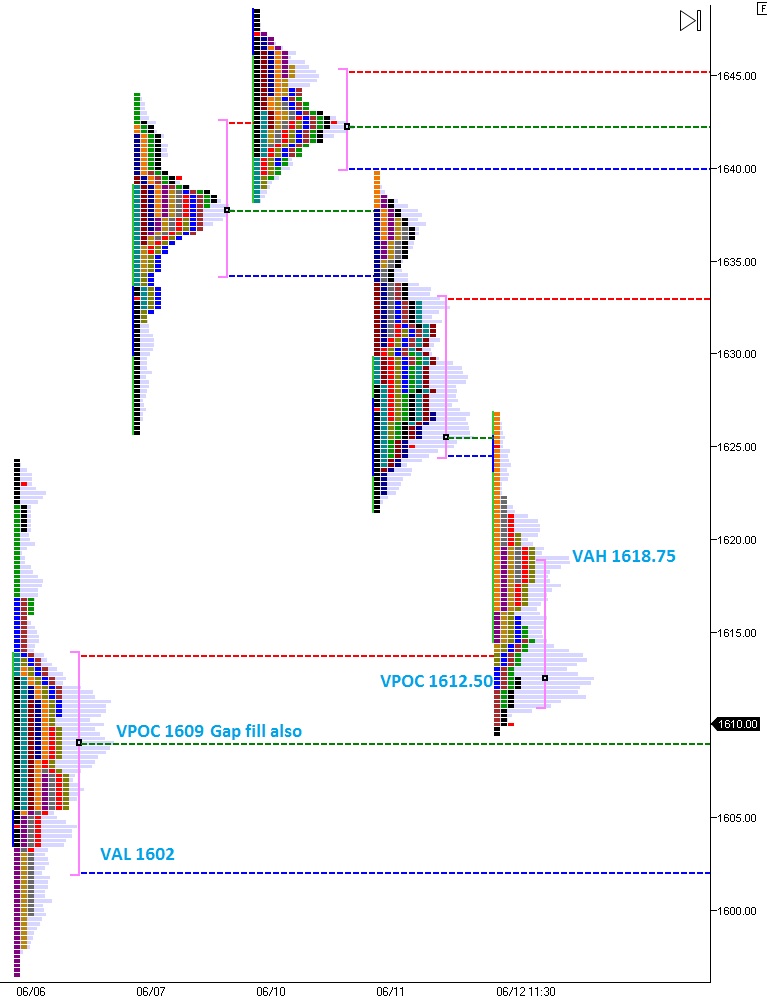
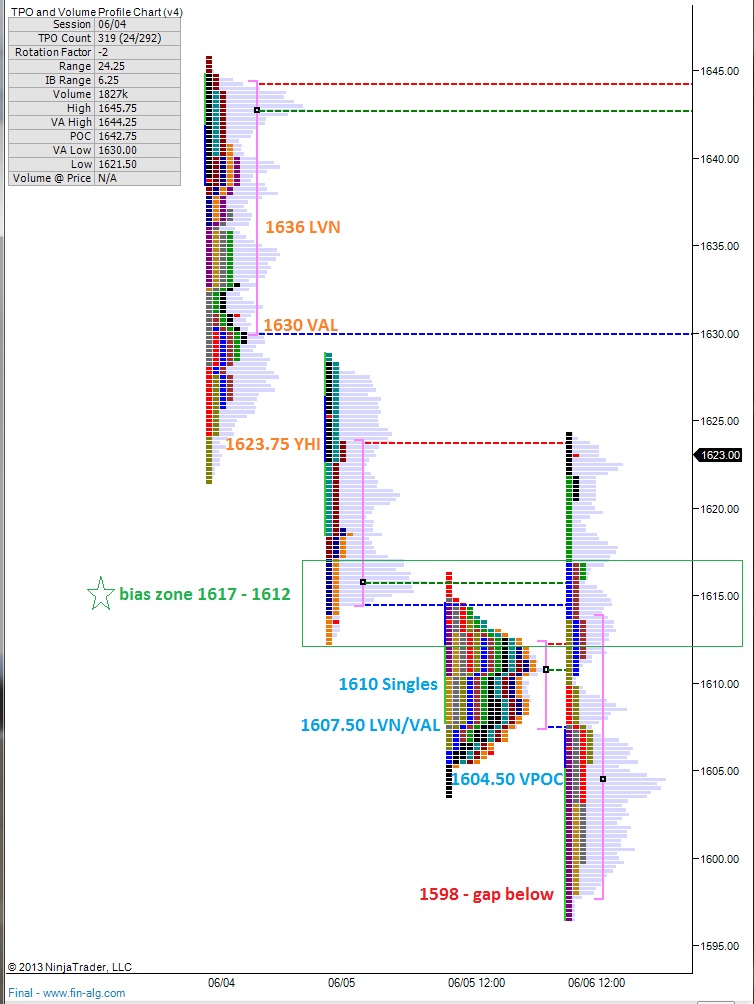
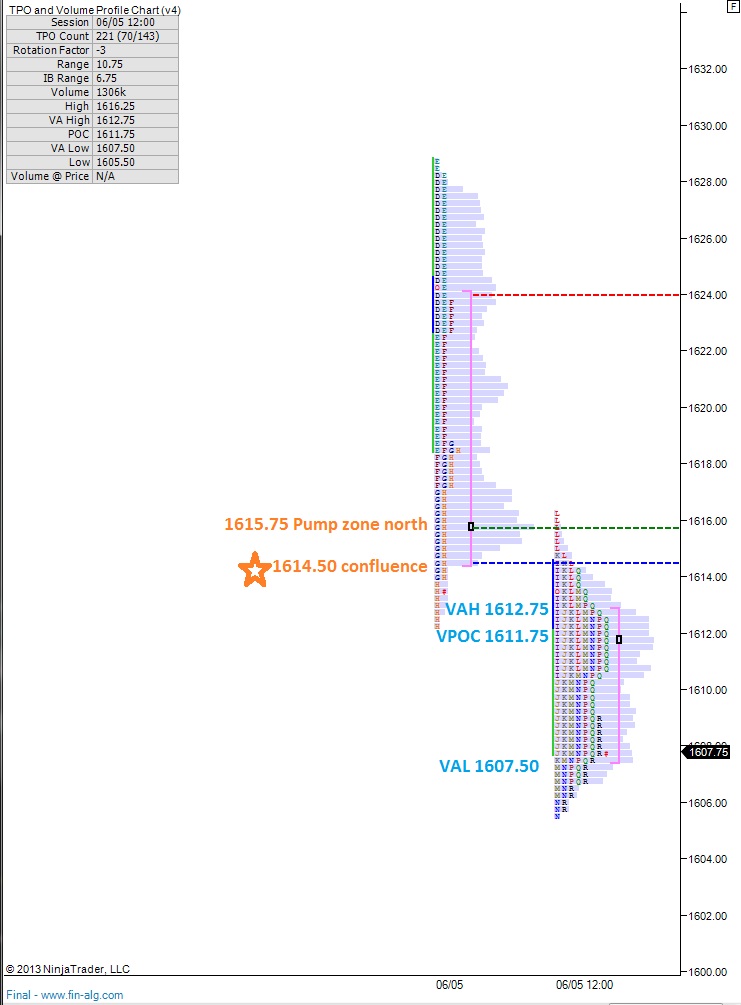
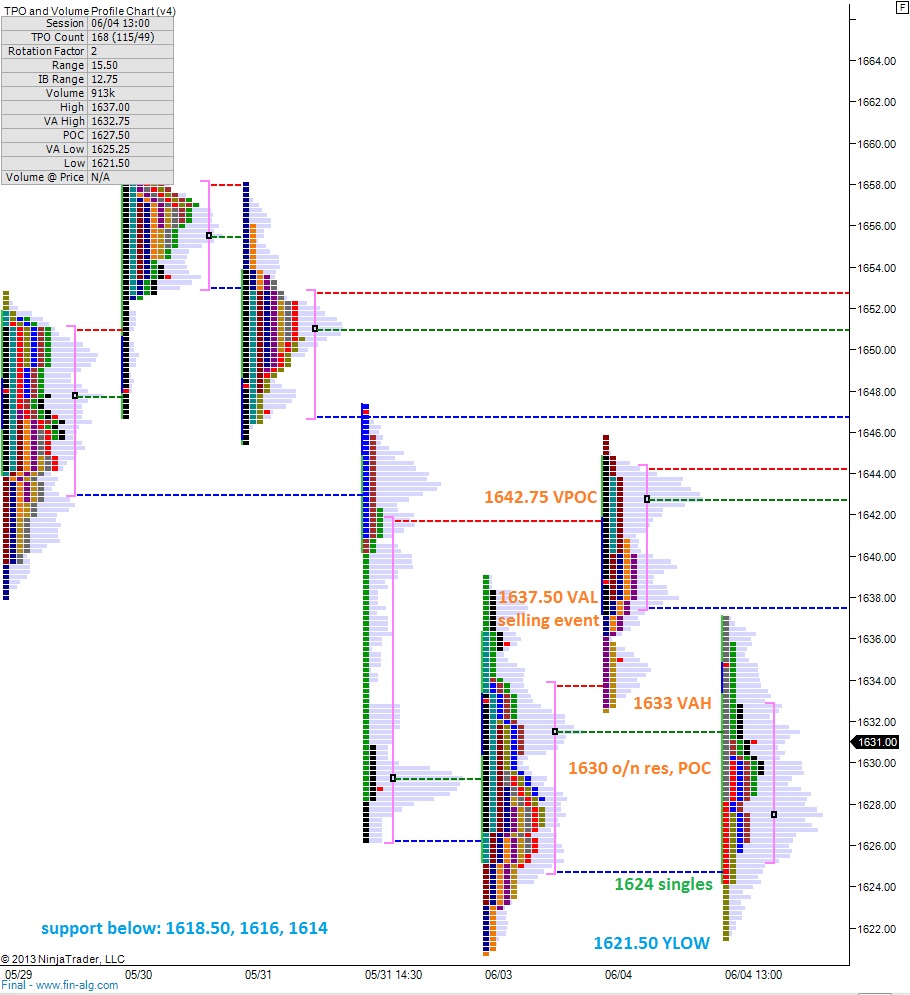
There were two major distributions occurring Friday.  I’ve split them accordingly in the below chart, and they give us clear guideposts as we progress today.  We were very strong overnight.  This can be interpreted as bullish, but more so I see it as an opportunity for bulls to give it up.  We need to be on guard for that, and armed with these levels of support we can measure the progress made by sellers:

ES_MarketProfile_06172013

Comments »

Evening Market Profile and Trade Recap

The longest vertical moves happen most often when the market starts outside of value and trades entirely though it.

When I split Wednesday’s profile, the value area I needed to look at became clear, ranging from 1611 – 1619 give or take a tick.  I was out of my first longs before 1618, but when the market pulled back and set its eyes on challenging 1619 for a second time, I got long again.  It was a lovely trade.  I had 1.5 points of room between my entry and the well defined resistance so I scaled off profit, placed my stop at a level that would take the sellers lots of effort to disqualify the trade, and went about my business of talking smack on twitter and whatnot.

Needless to say, the dynamic move through that resistance didn’t look back and earned five handles before running into my next logical price level.  This is really exciting stuff.

When a trend day occurs, you see very little overlap in the TPOs, and that’s exactly what we saw today.  Getting long anywhere during a trend day is hypothetically risk free exposure heading into the following session since we should at the least digest the upper end of the range.

Using the 6/10 profile you can see the levels where we can expect upside resistance.  Should none of them hold, just set your sights on 1650 and hold’on to your pants.

I’ll be watching the following levels in the morning.  However, I’ll be working remote, so I’m uploading the chart tonight:

ES_MarketProfile_06142013

NOTE: I’ll be rolling into and quoting the September contract after this weekend.  ALSO NOTE: like a beautiful woman, the sell off and subsequent bounce had near-perfect symmetry, lovely:

ES_MarketProfile_06142013_symmetry

Comments »

All The Levels You Need To Navigate Today’s Tape

The market headed south early on last night and made around 10 handles of progress to the downside before enticing buyers back into the S&P.  The dynamic action left behind a volume pocket which will be of interest as we approach the opening bell.  I’ve highlighted it below:

ES_24hour_VolumeProfile_06132013

In terms of the market profile footprints, we’re seeing these large, D-shaped profiles, which signal no real directional conviction.  The bearish bias from yesterday comes from the fact that we closed out near the low of the session.  The follow through overnight adds credence to their cause.  The resistance overhead is pretty clear cut in the following picture:

ES_MarketProfile_06132013

We still have a big gap below to watch also, good luck trading today, people:

ES_MarketProfile_Throwback_05032013

Comments »

Drilling Into Yesterday’s Candle

The overnight session has been strong, pressing the S&P into the upper quadrant of yesterday’s action.  We’re nearly 10 handles above yesterday’s close.  We’re certainly seeing a market climate loaded with chop and large gapping action.

Yesterday’s auction was a battle for control as we auctioned inside the thinly traded zone from 1632 – 1617.  The sellers came to the market early in the afternoon and leaned against Monday’s VAL as resistance.  A clear victory for the bulls today would be building acceptance back above 1640.

Sellers want to press price below the value point of control set at 1625.50 yesterday.  From there, a push down to 1614 becomes a distinct possibility.

I’ve highlighted this level and other key price zones below:

ES_MarketProfile_06122013

Comments »

Now Comes The Real Test

We’re very weak overnight as sellers entered the market aggressively around the European open.  The selling action has taken price over 15 handles off the close yesterday.

The compressed profile yesterday was located entirely within Friday’s value and stalled in the afternoon.  This type of acceptance of Friday’s value gave the suggestion that we would at the least retest the low end of Friday’s value.  Price cascaded through Friday’s value area low after it initially held as support overnight.

If the bulls can manage to retest the 1634-1636 range today, that would be an impressive recovery.  However, the more likely scenario is an auction of the otherwise neglected price levels ranging from 1632 – 1614.

If you’re positioned aggressively long (like me) and have some cash remaining, your best bet here is to be patient before adding long exposure.  Wait to see if the market will test back down to 1615 area.

I’ve noted this range and other important areas of support/resistance below:

ES_MarketProfile_06112013

Comments »

Monday Morning Market Context

We’ve been strong the /ES futures ever since gapping lower Sunday evening, the main feature of the session being a steady rotation higher off Friday’s value area low at 1634.  Should we trade back through Friday’s value, trade could quickly press through this level and then set its sights on taking out the single prints left behind of Friday’s early drive higher.

This would suggest a major change in character, as it would drastically reduce the confidence of anyone who initiated new longs into Friday’s strength.

Up above, we’ve left behind many reference points including naked volume points of control which make excellent targets.  Nearby we have the 5/29 NVPOC at 1647.75, only one handle above the current overnight high, should we breach the overnight high, a test of this NVPOC is likely.  This same session marks value area high at the 1650 mid-century mark.  So any trade within this value area should be closely observed to see which force (buying/selling) is succeeding in driving vertical development.

ES_MarketProfile_06102013

Comments »

Levels That Will Do The Talking When The Employment Number Hits The Tape

The overnight session is balanced thus far and starting to pick up activity as we await the high impact jobs data at 8:30am.

I’ll reserve calling any forecasting, like declaring price won’t stop at 1600 (it essentially did on its first test).  Instead I’ll highlight the key levels I’ll be taking my cues from and let the market do the talking:

ES_MarketProfile_06072013

Comments »

Morning Profile Analysis

Futures are modestly higher and the overnight profile shows signs of a possible roll higher, but certainly lacks the symmetry of a balanced session.

Typically, we see the market digest a big directional day by setting up value near the prior day’s close in an orderly fashion.  Considering the precarious position yesterday’s action put us in, I’m prepared for a quiet day or perhaps a day a violent indecision.  I would consider the former to be more challenging to trade.

Note: I’ve split yesterday’s action into its two key components, the selloff and the violent D-shaped distribution.

I’ve also notated the volume profile chart below with clues to the gap existing below and how it may play out as support.

ES_MarketProfile_06062013


ES_MarketProfile_Throwback2_05032013

Comments »

Early Weakness, Here Are The Key Levels

We’re not looking to strong in the S&P globex session, starting with the rock solid resistance overnight at 1630. It held on a series of three lower highs overnight and resulted in a snap of the 1625 level, if only temporarily.  Both of these levels are important today.

I zoomed back on the balance zone from about 1631 – 1622 to get some lower levels to watch in case we see a liquidation occur.

The next levels of potential support are 1618.50 a significant low and then 1616. Finally I see 1614 on my radar as possible.

I will use the following market profile chart to define upside resistance.  Note: I’ve split yesterday’s session essentially in half, where the conditions changed:

ES_MarketProfile_06052013


Comments »