iBankCoin
Home / Tag Archives: $QQQ (page 24)

Tag Archives: $QQQ

Beautiful Context Heading into Tuesday Trade

Futures are sliding lower into the opening bell here in the USA.  The selling waves began shortly after the Euro-Zone announced their CPI data and unemployment rate.  CPI was worse than expected and they had a slight downtick in unemployment and the markets sold off.  We have factory orders at 10 am but an otherwise quiet docket for our session.

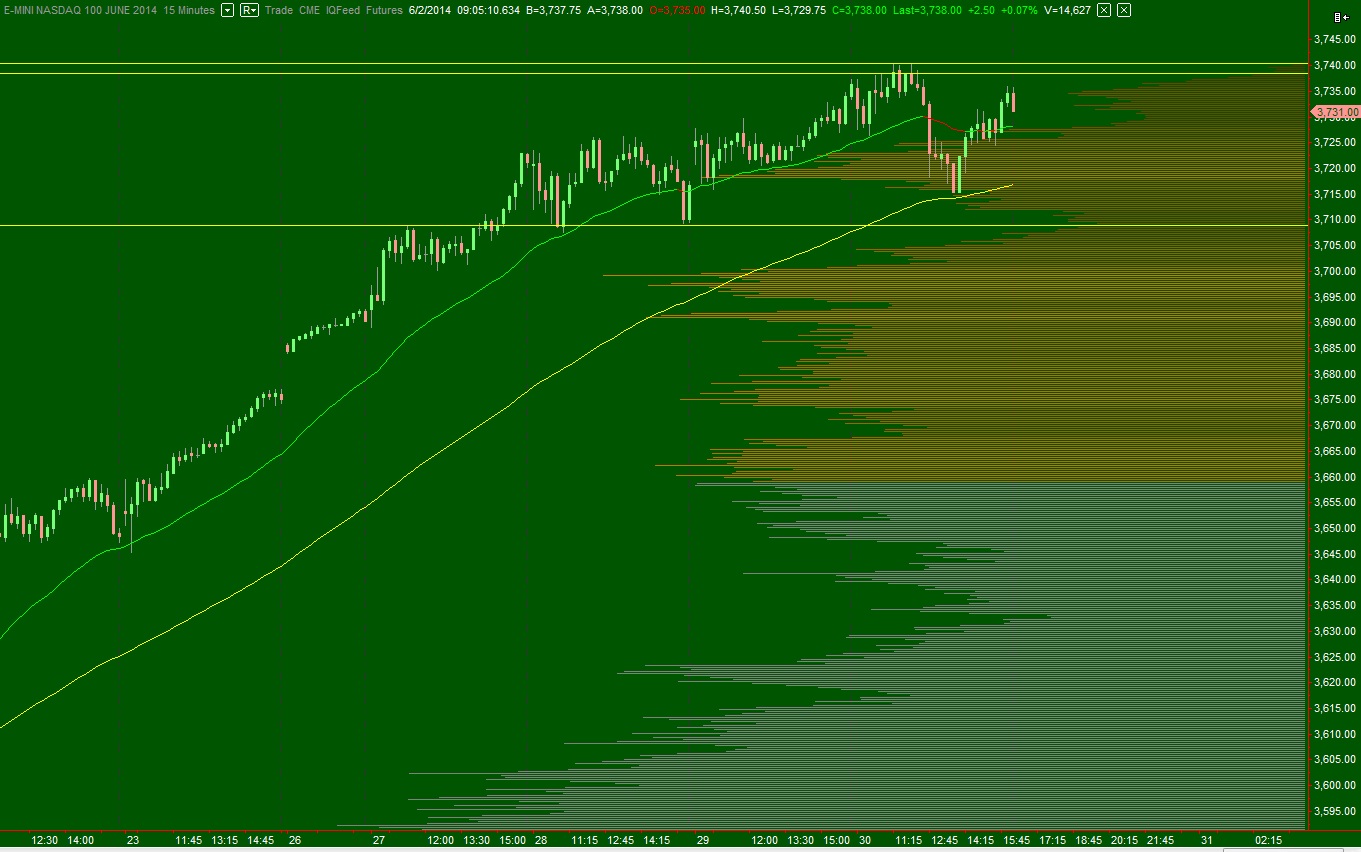
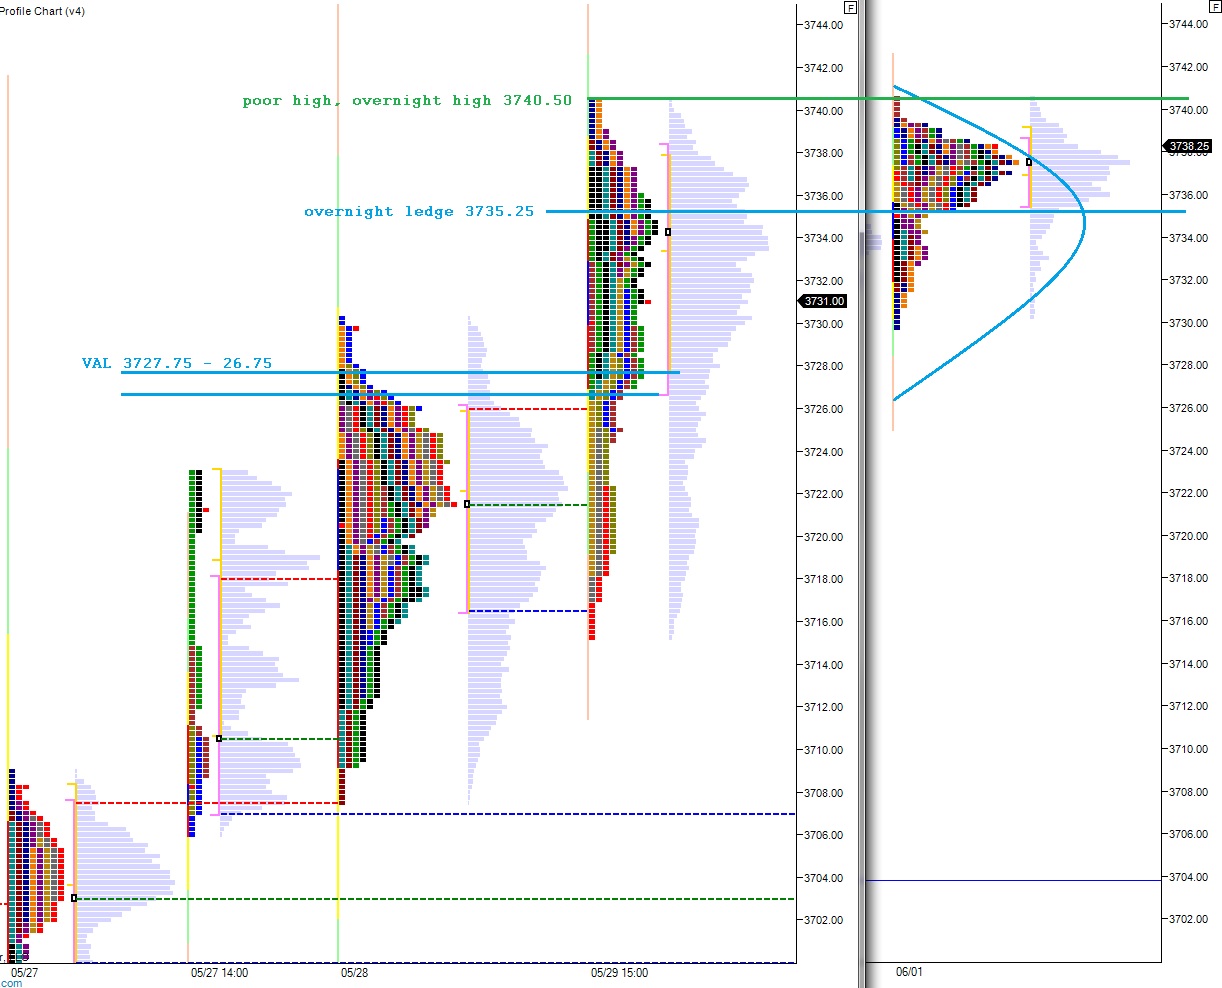
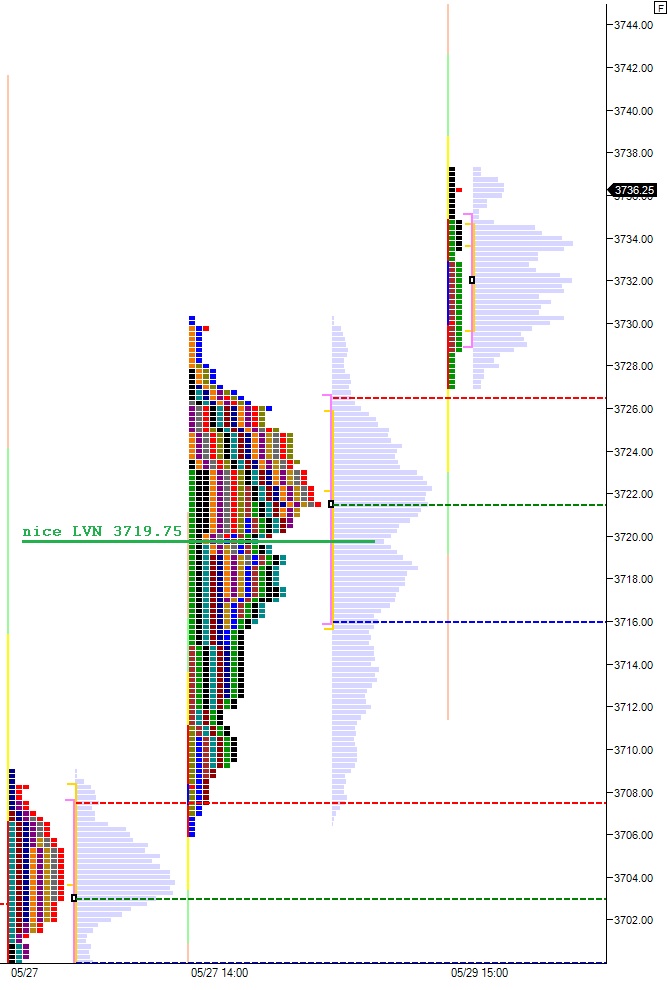
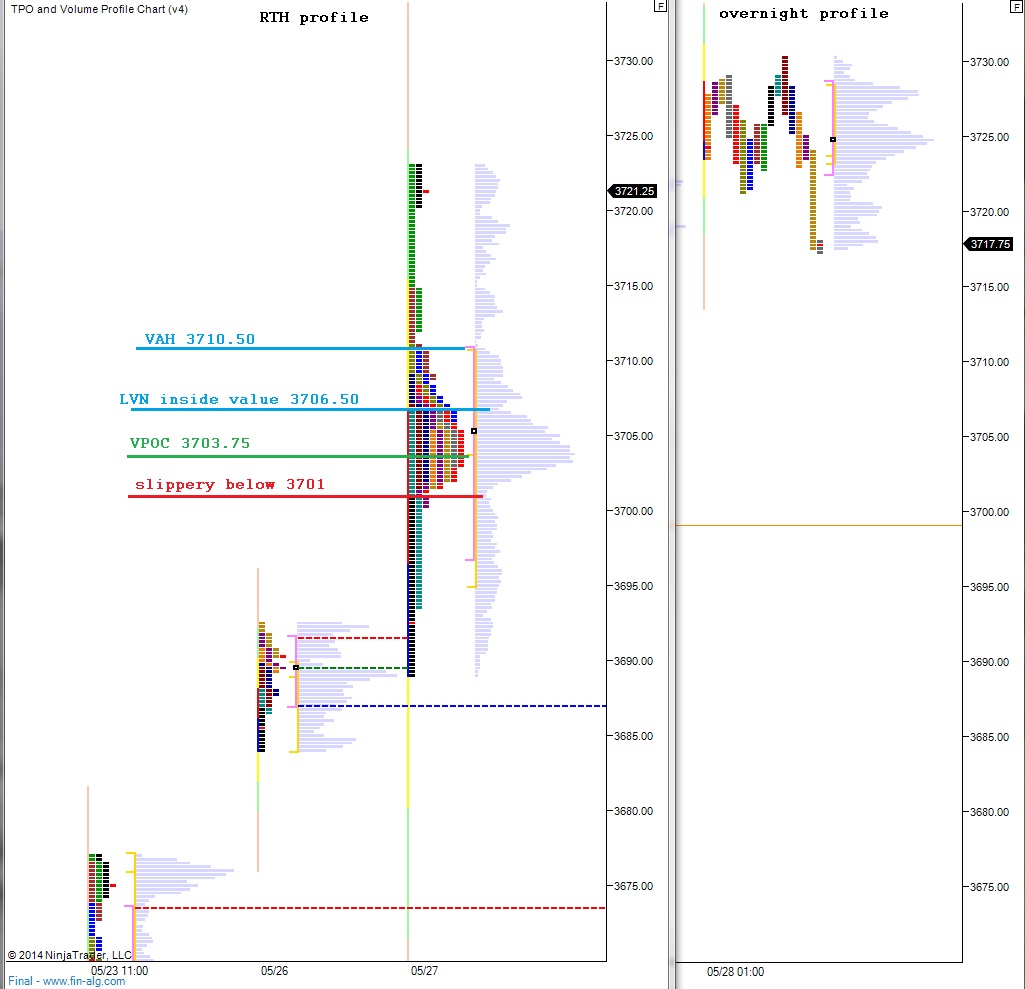
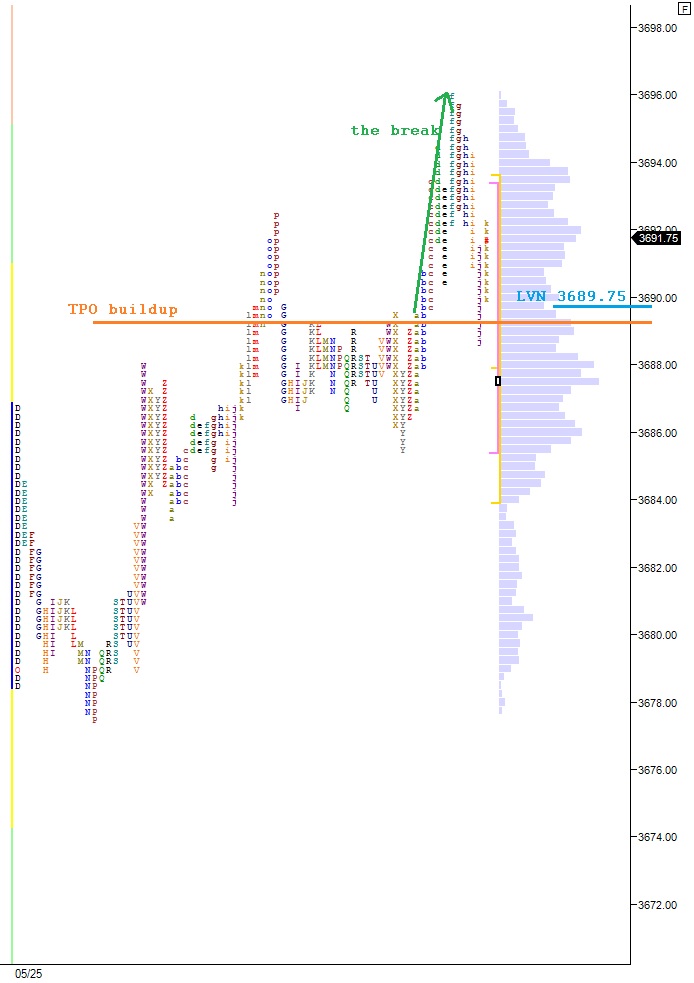
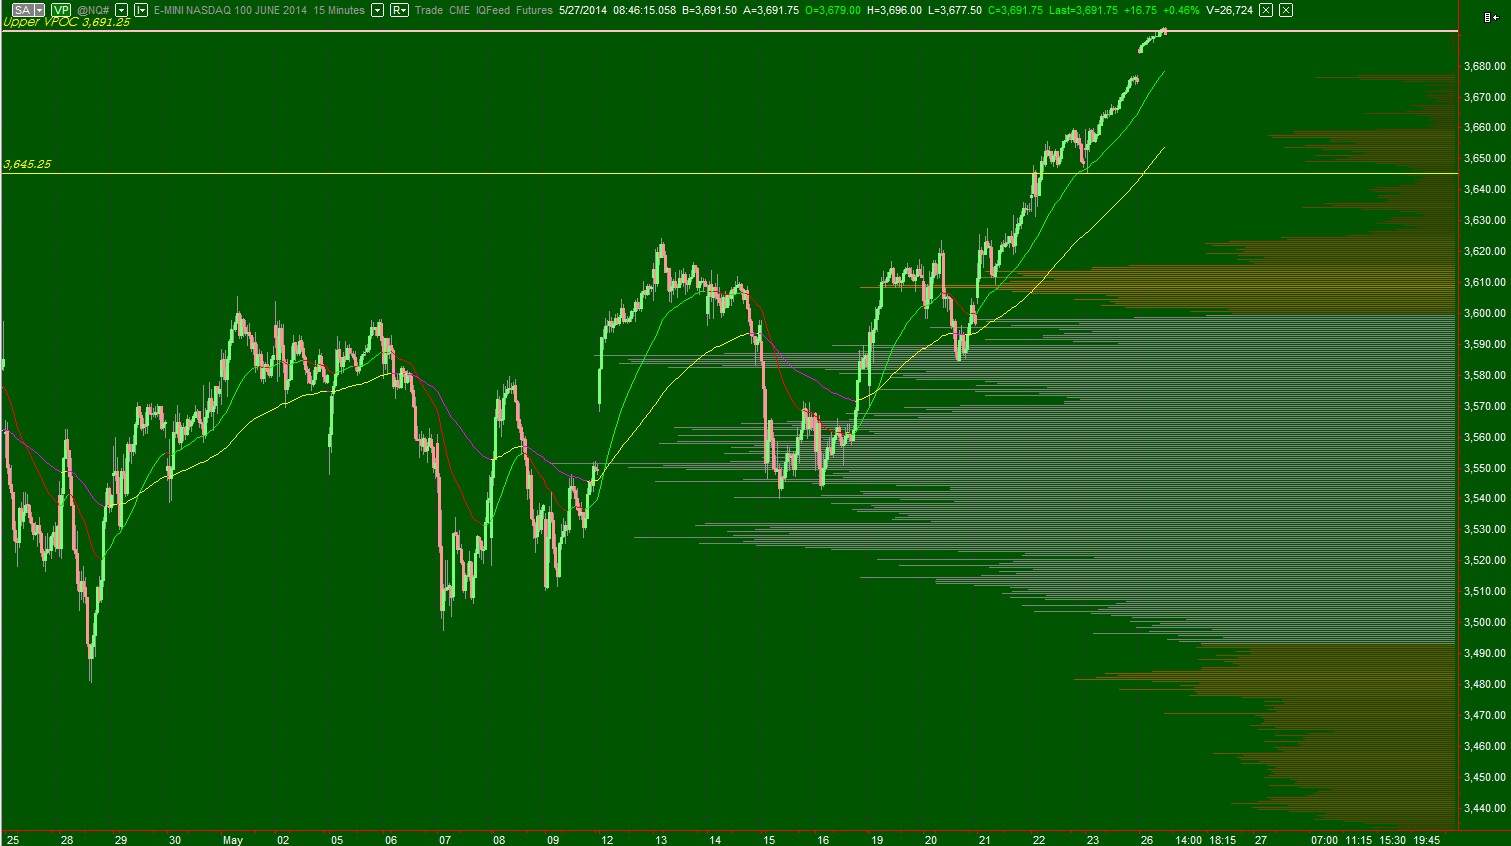
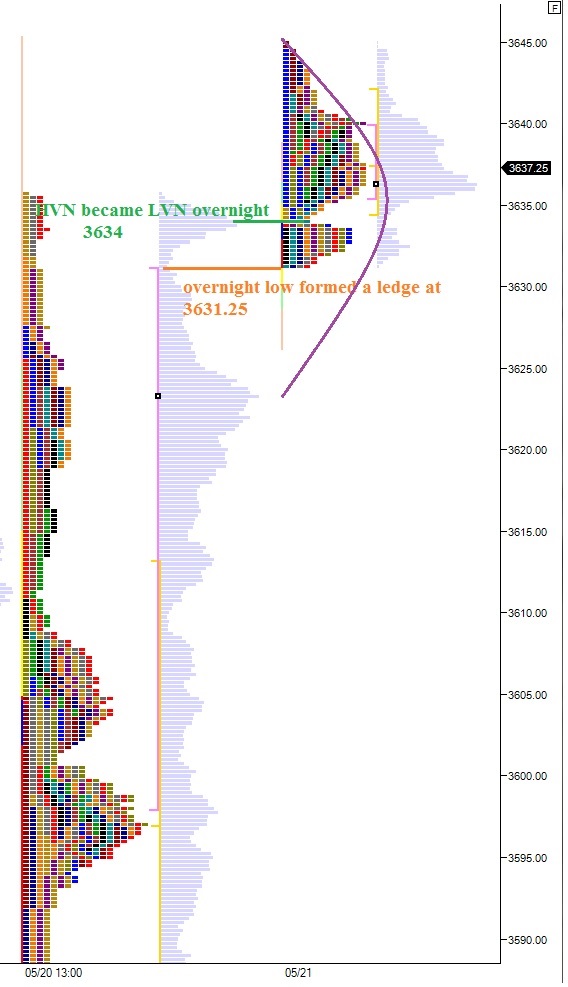
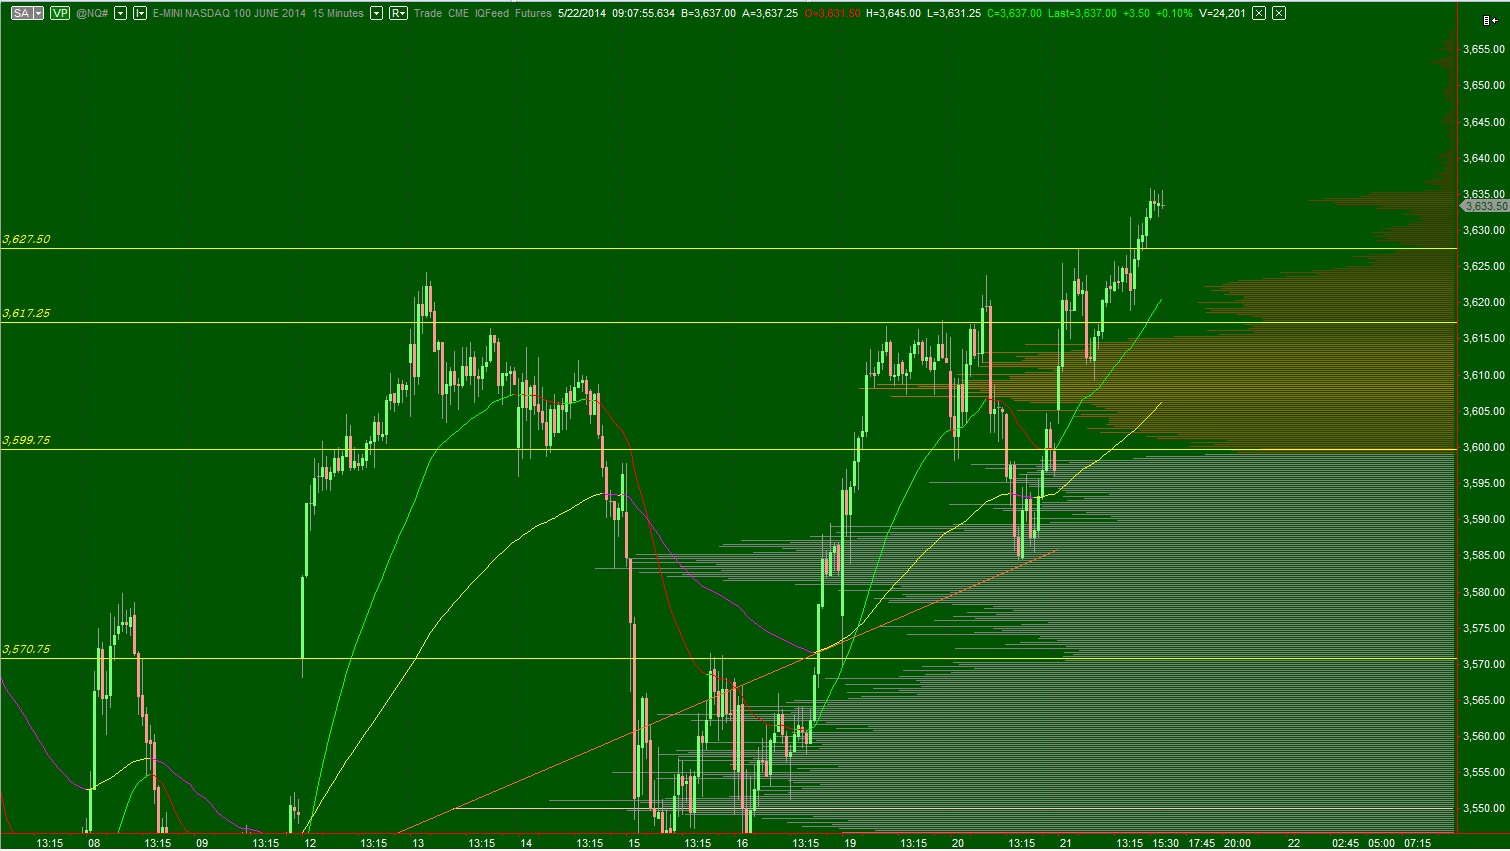
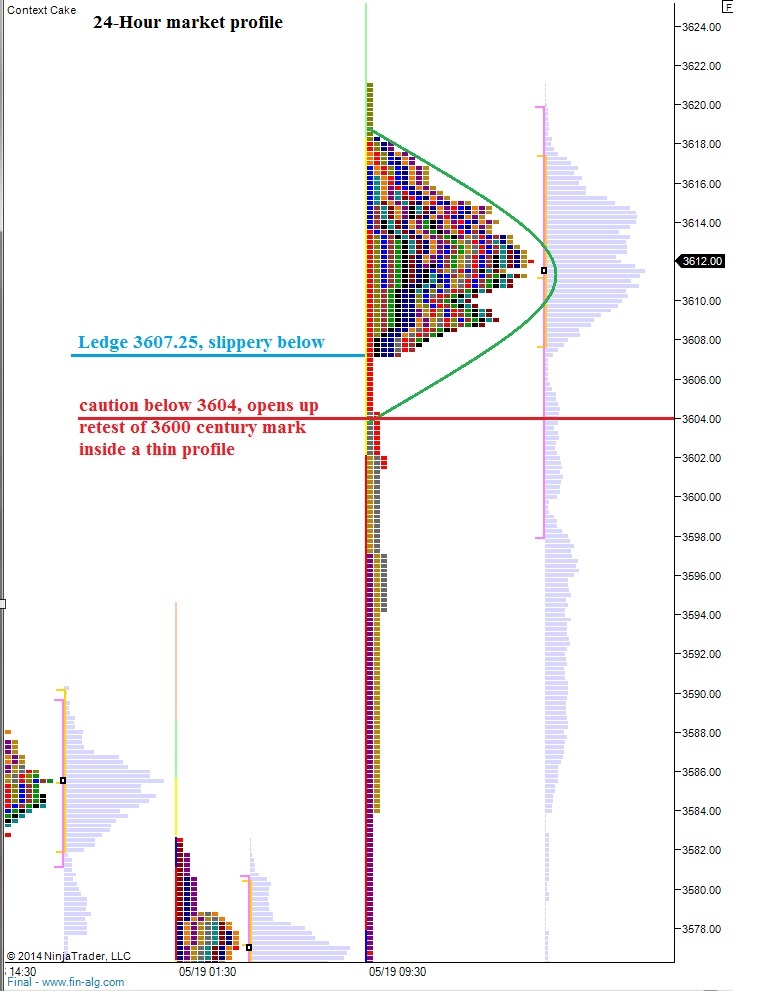
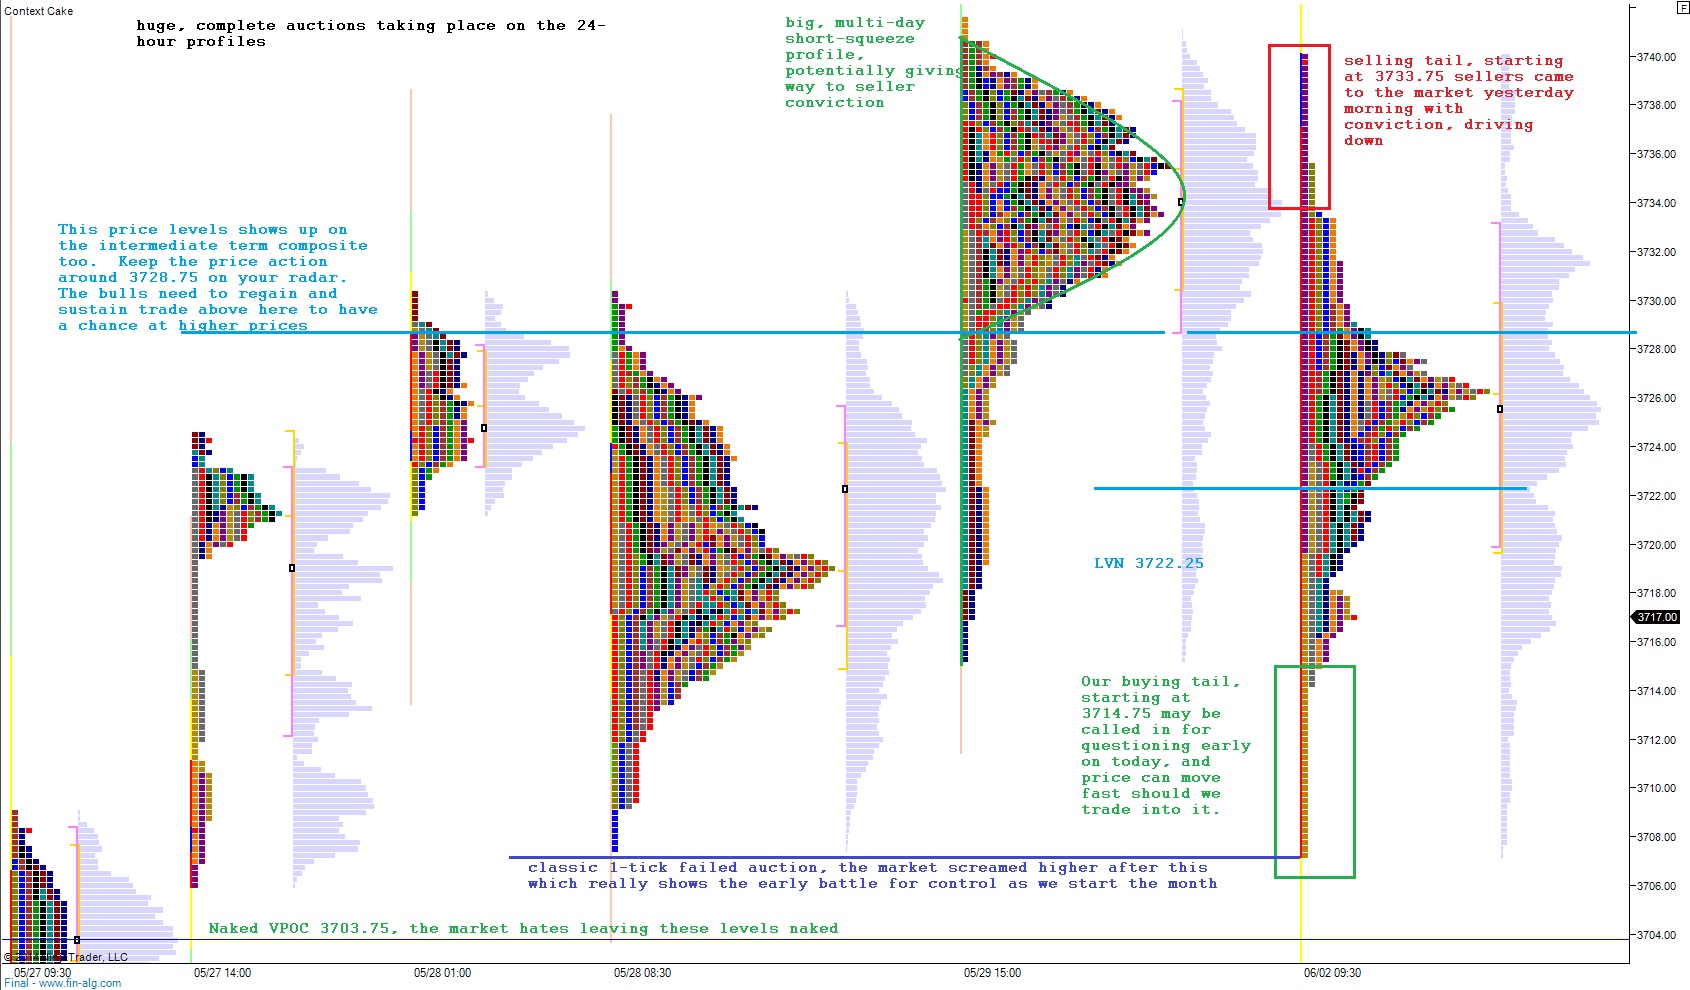
The overnight profile is toothy and printing value down near the low of the globex session.  However, what I find most interesting is the large profiles we have built over the last 5-6 days.  When observing the 24-hour profiles, which encompass all tradable hours of the contract, we can redistribute the market action not based on time, but instead on relevance to each distribution.  By chopping up the price action into the relevant distributions we obtain a transparent view of the current auction.  See below:

NQ_marketprofile_06032014_24-hour

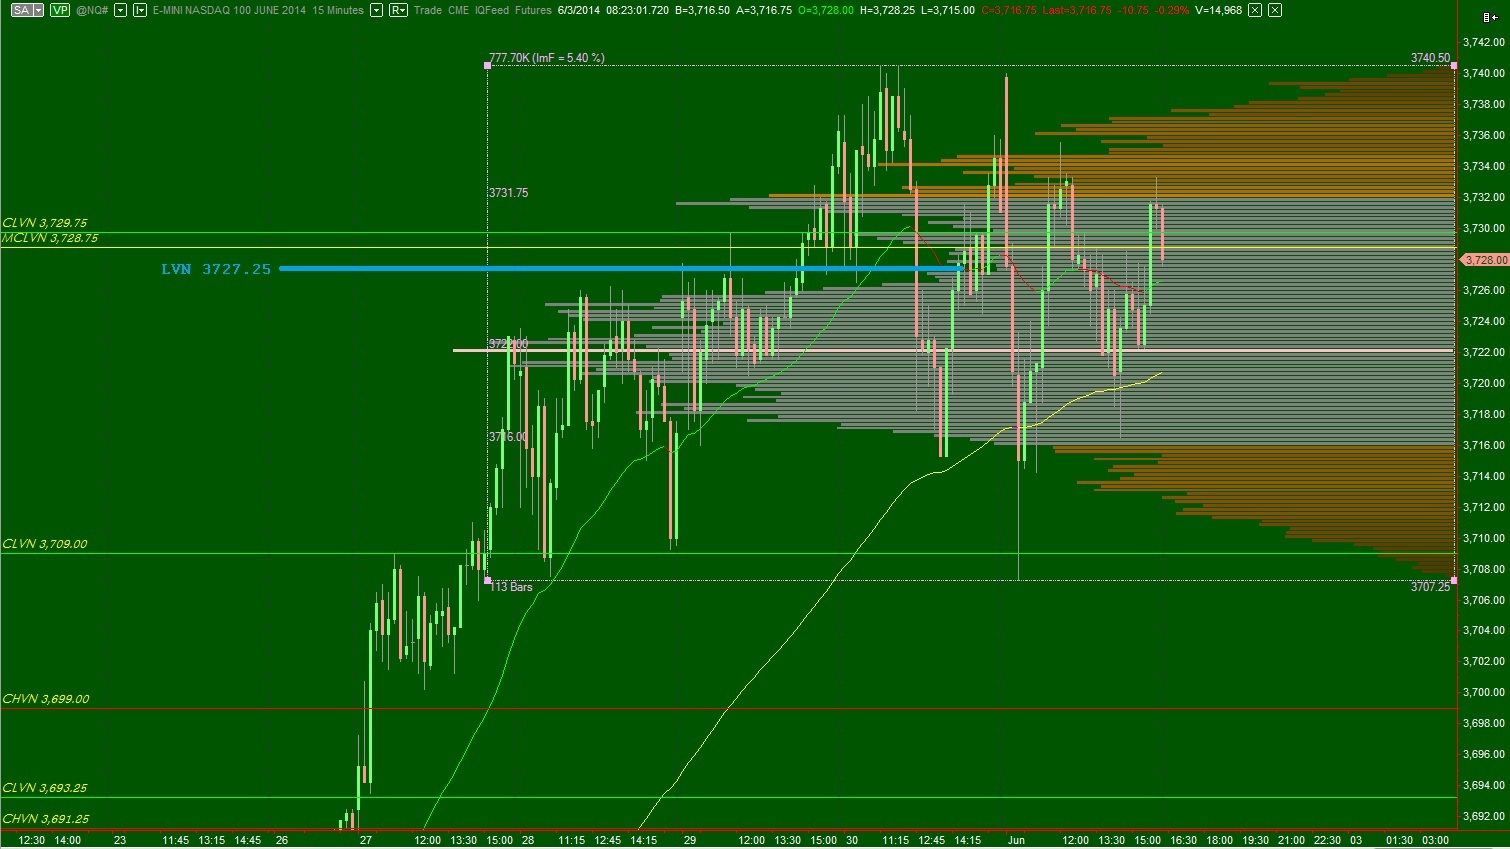
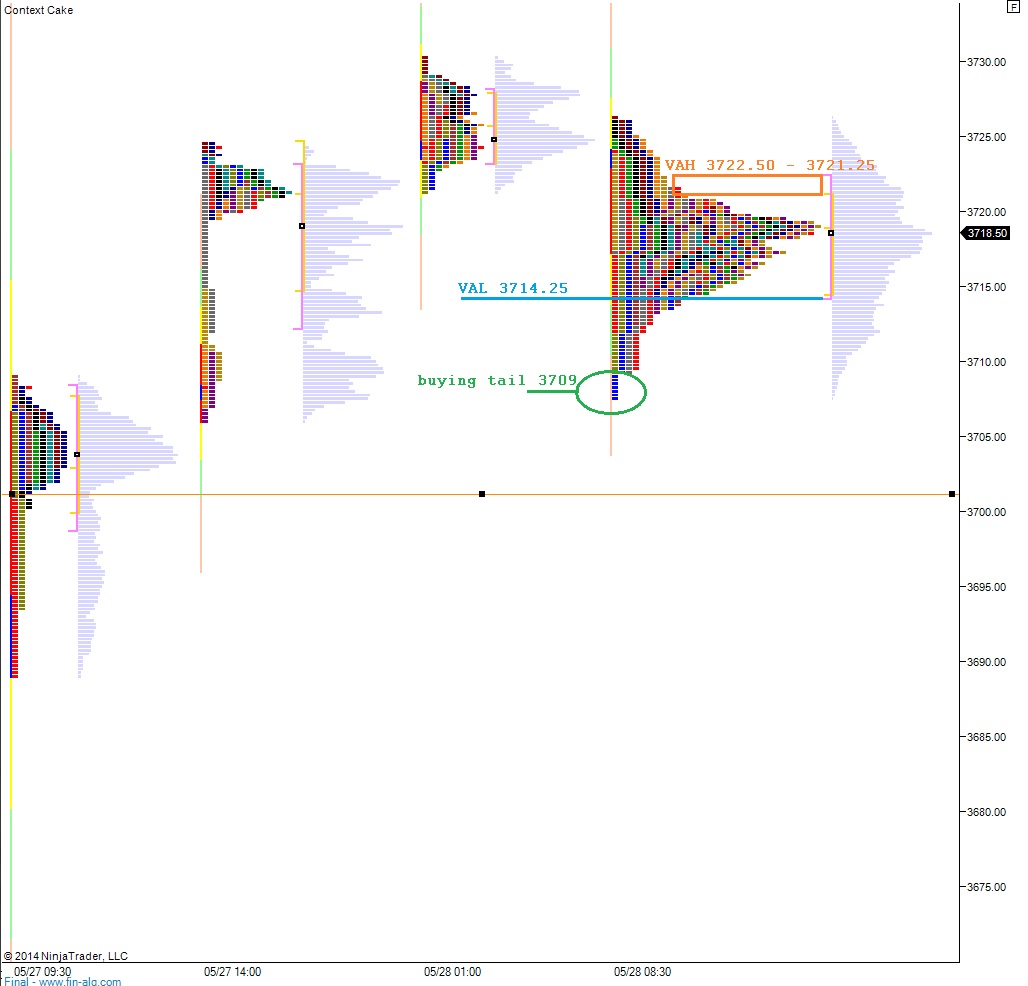
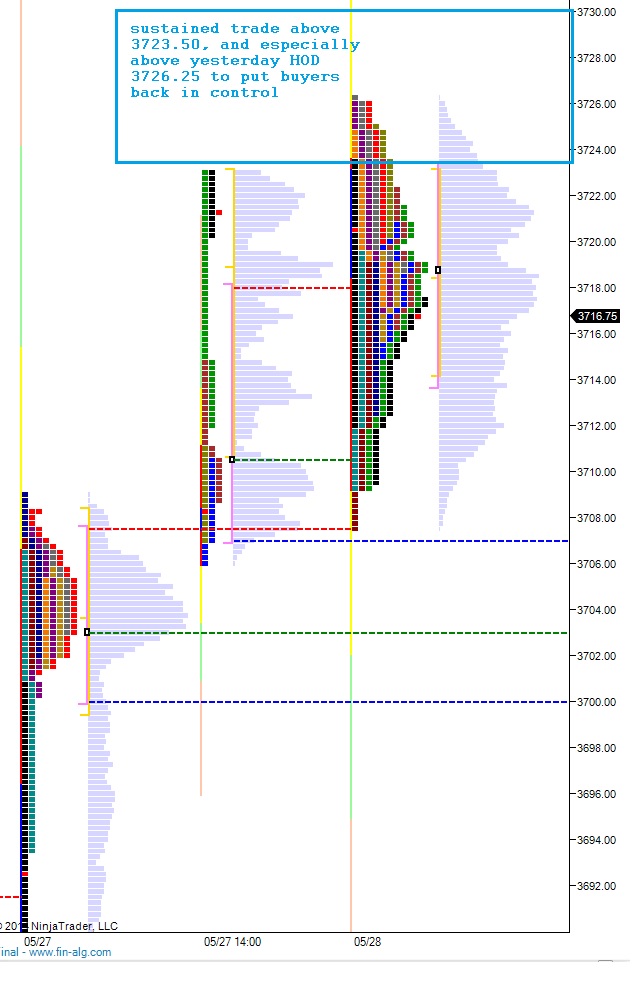
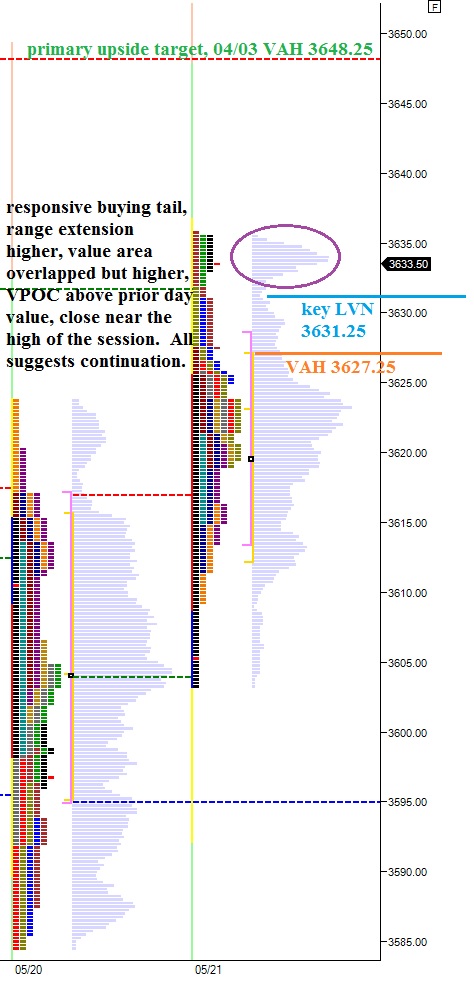
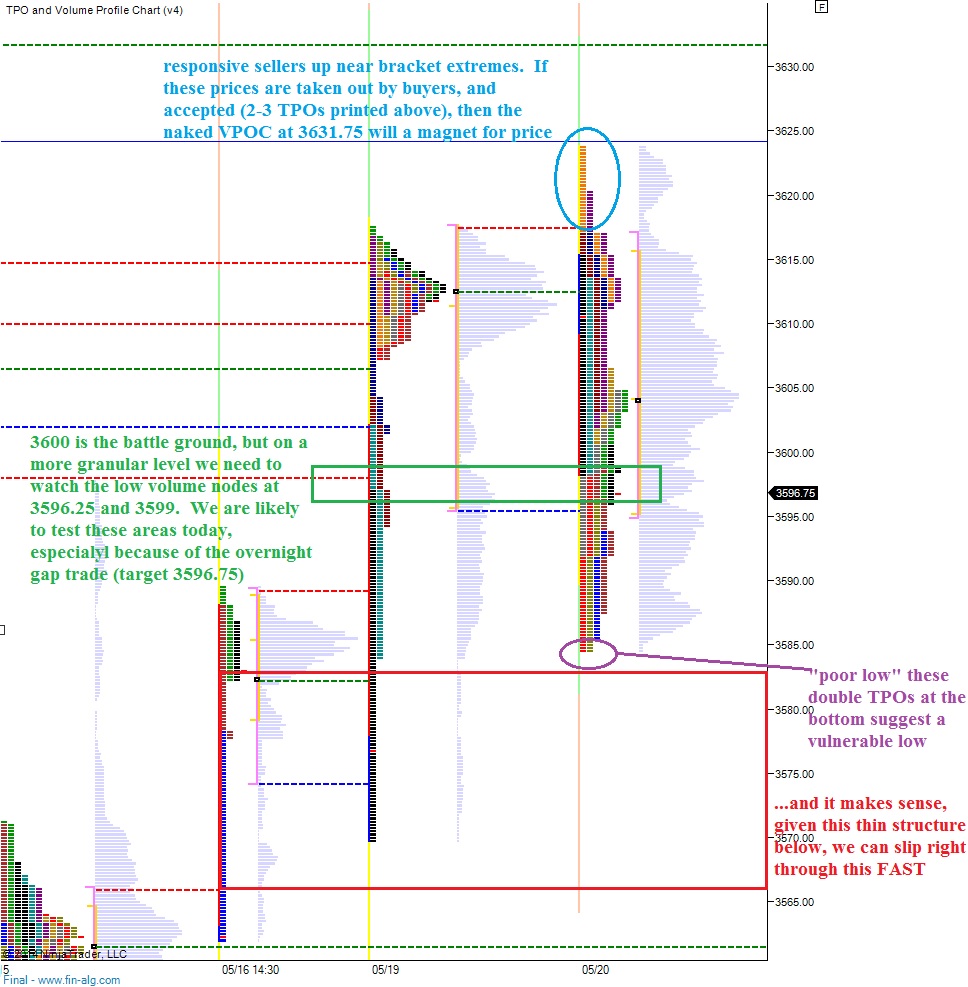
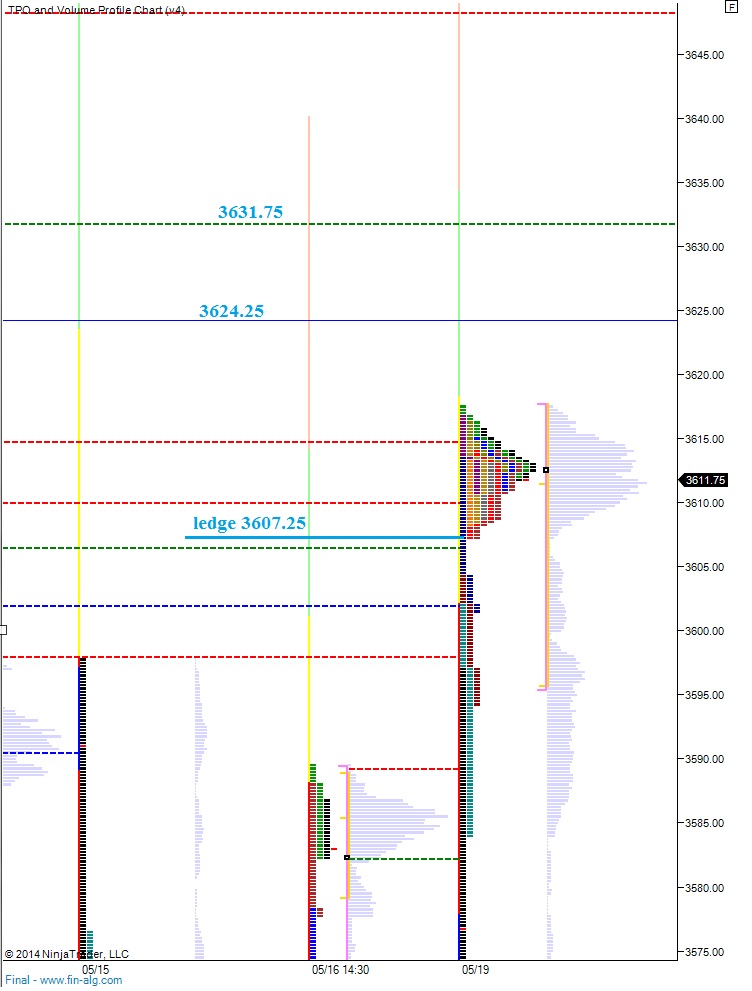
Some similar observations, as well as the relevant value zones can be seen on the regular trading hours market profiles.  Interesting context to note, the poor high still exists on the regular trading hours chart.  It was eliminated on the globex profiles.  A poor high is where two or more TPOs print at the swing high.  This is uncommon and often settled before abandoning a swing high.  As is always the case with market profile context, it is not a timing tool, but only a contextual caveat as you go about your trading.  See below:

NQ_marketprofile_06032014

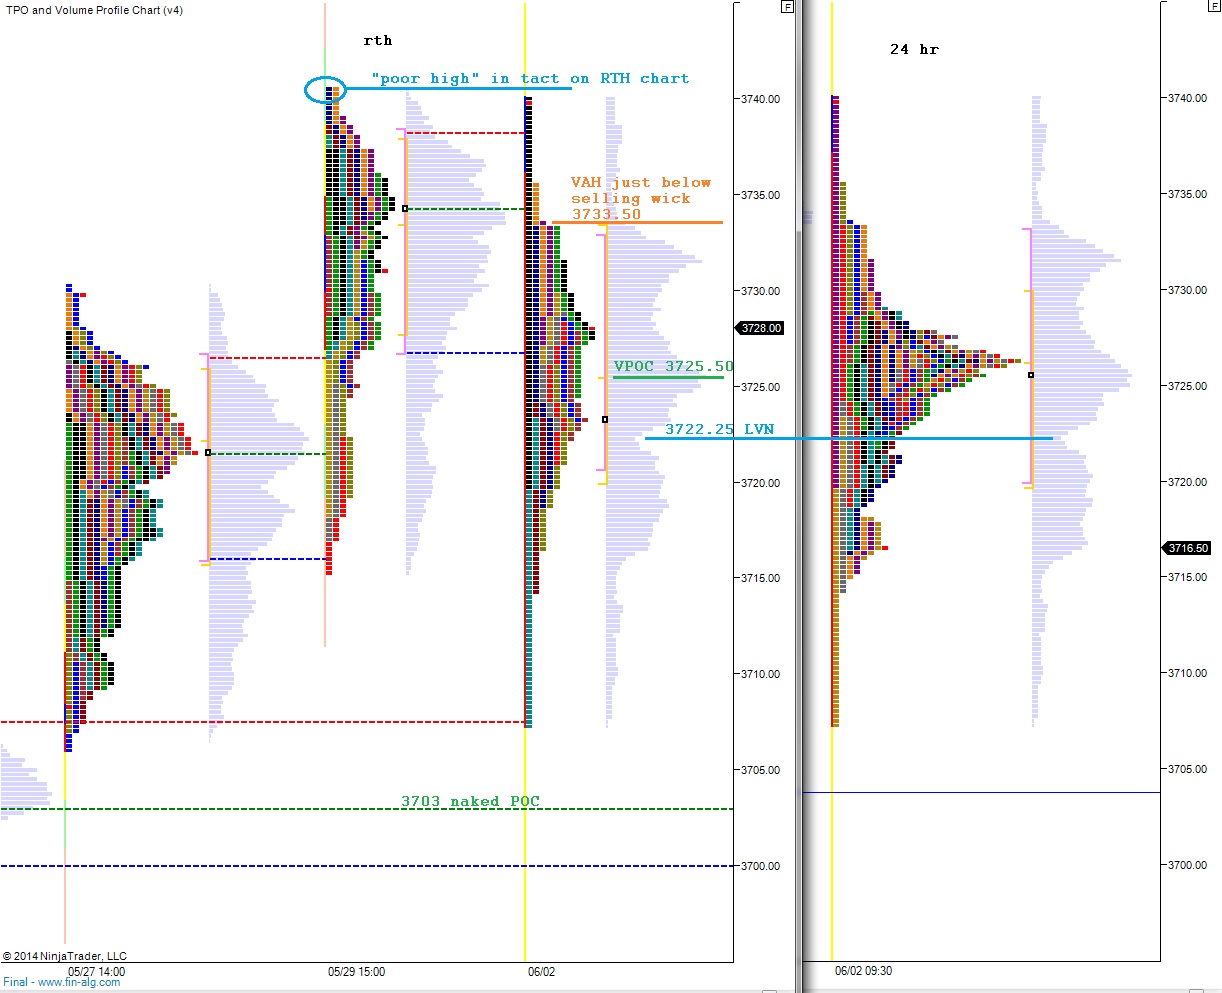
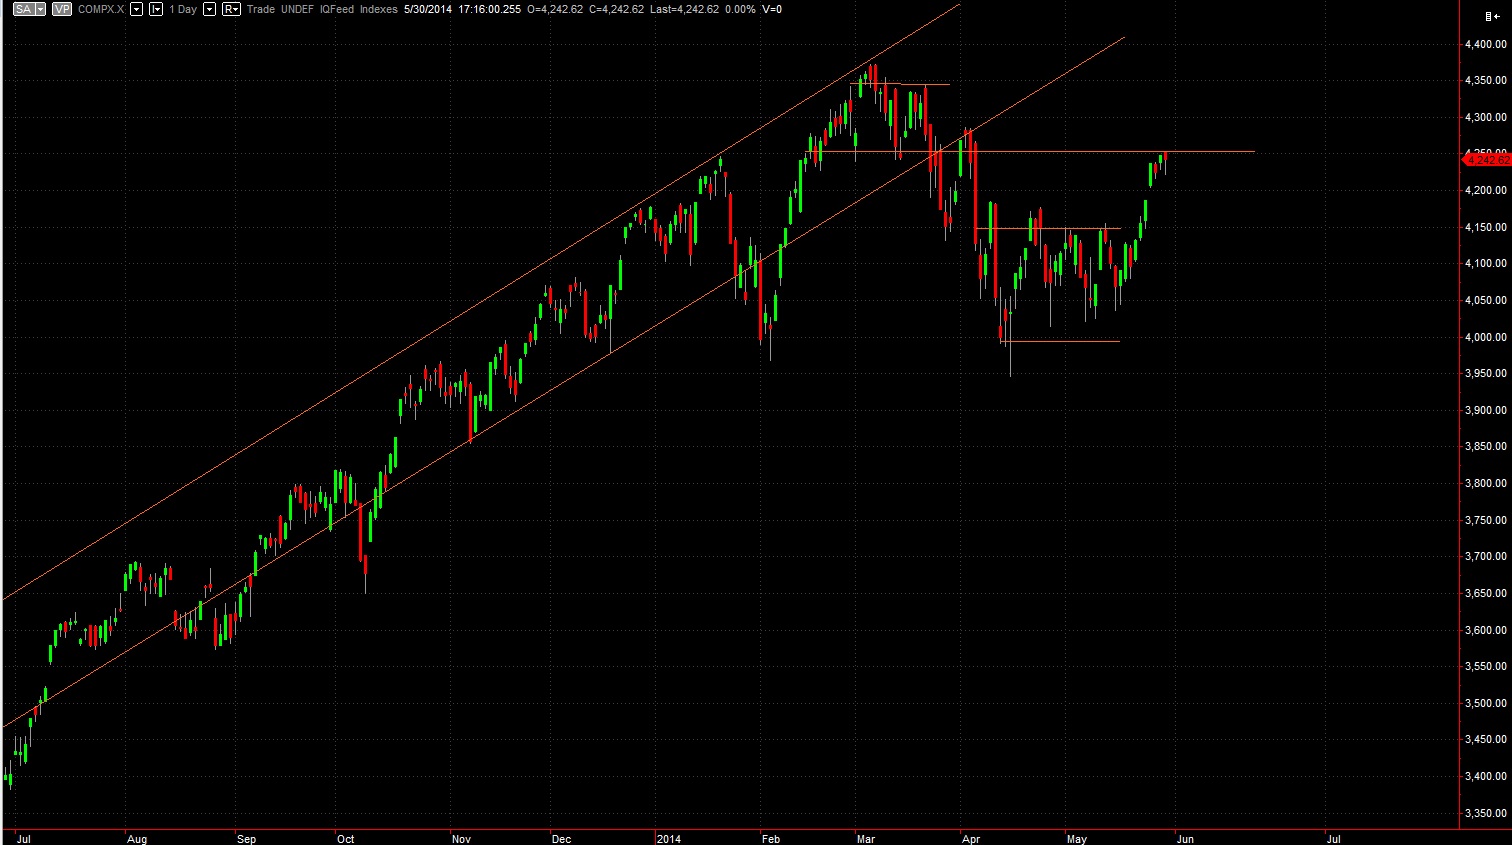
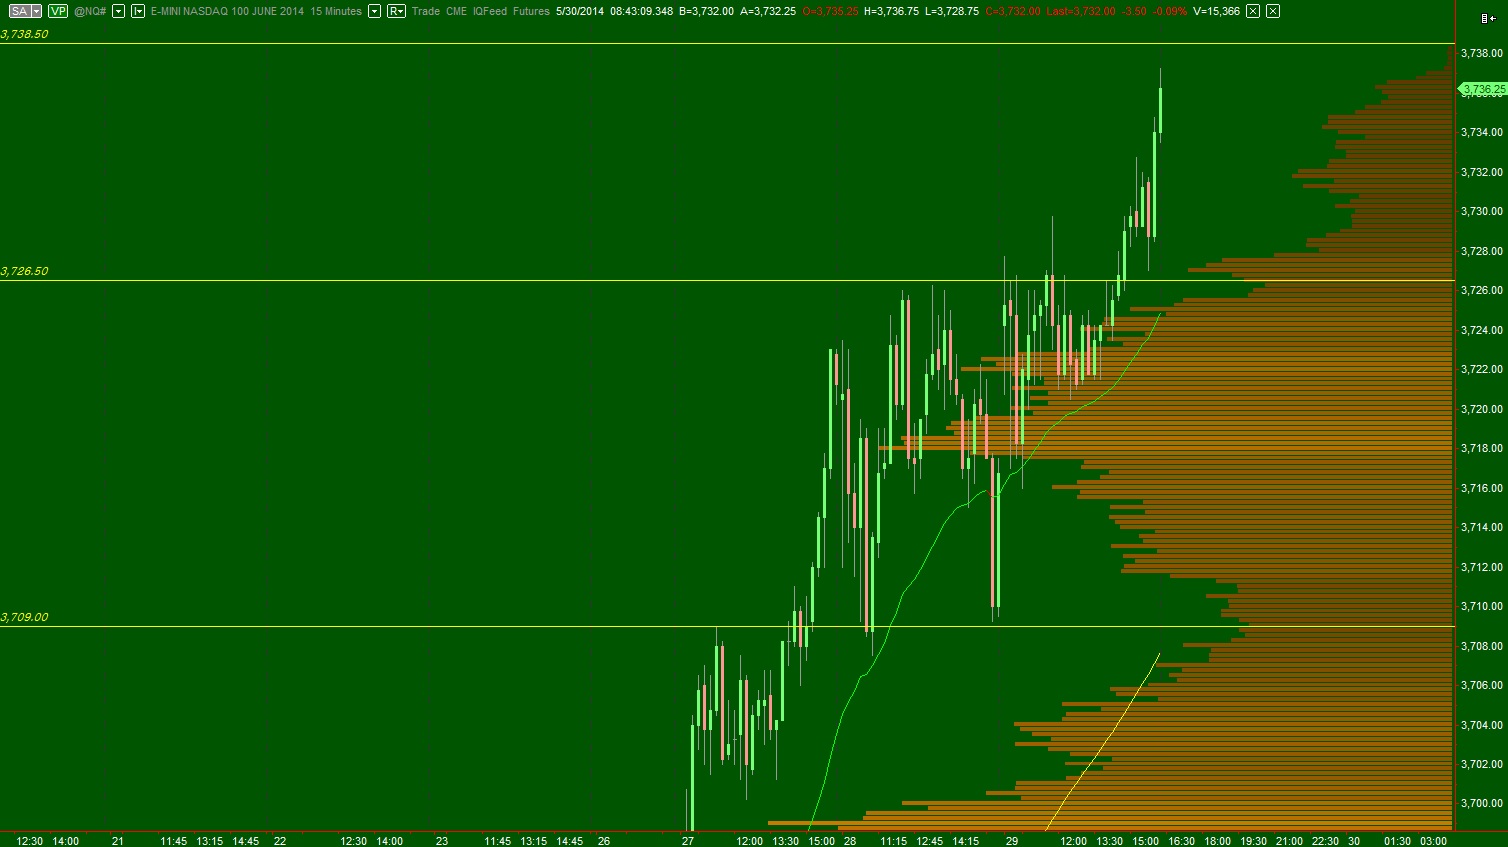
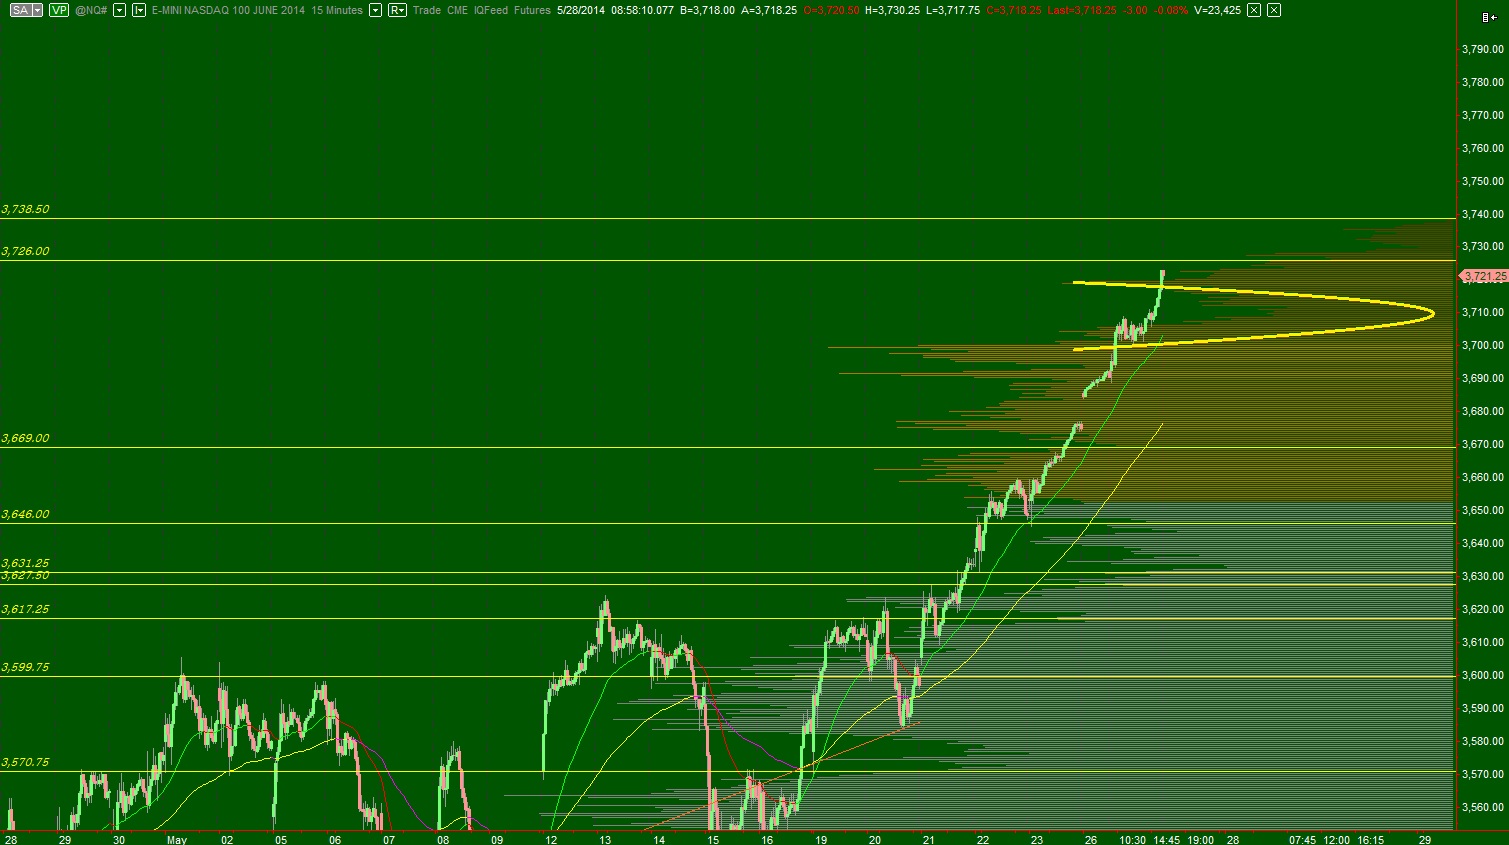
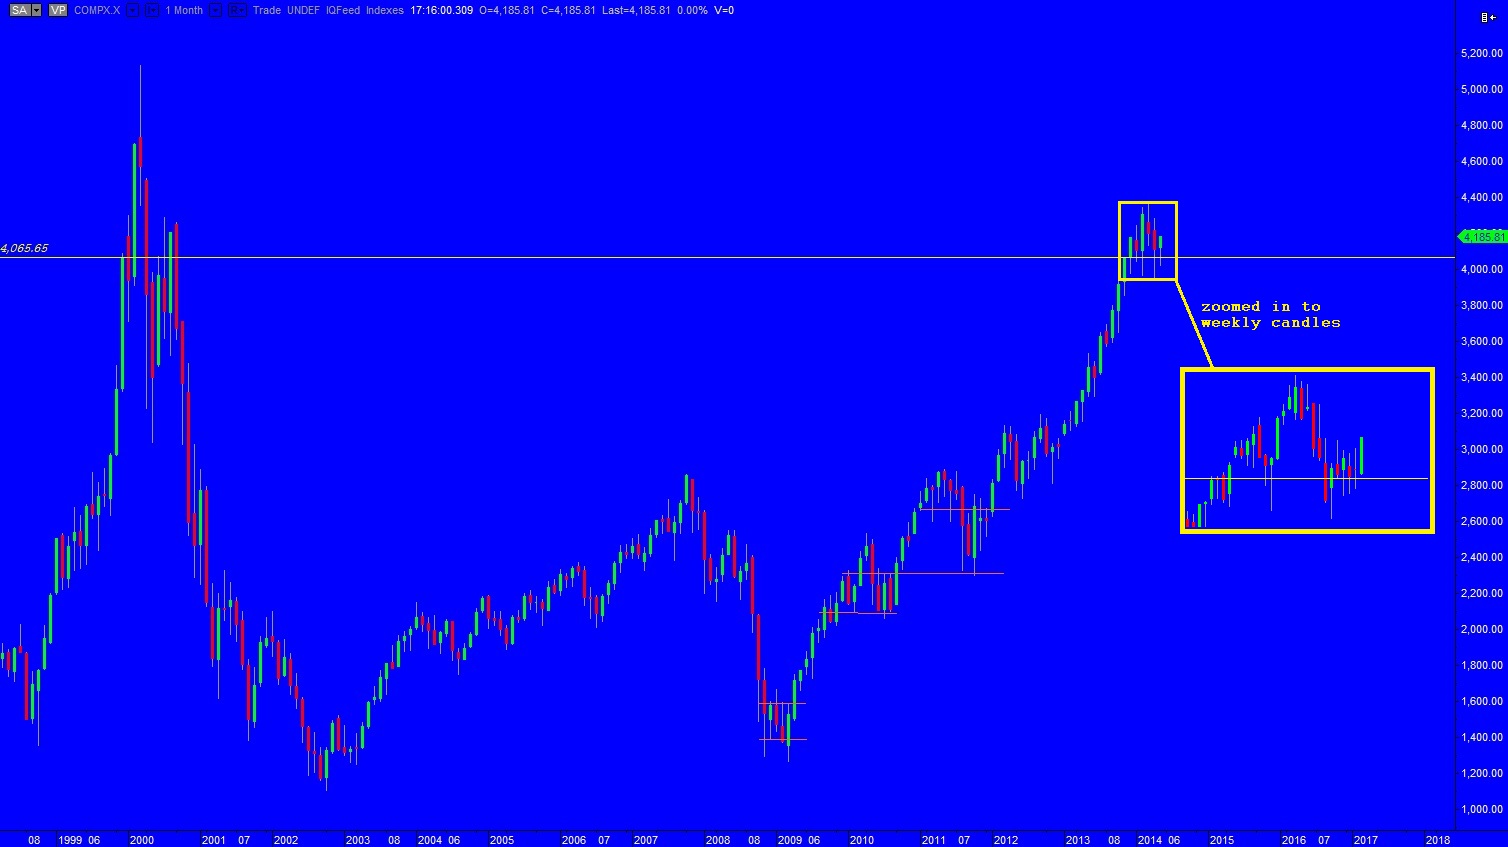
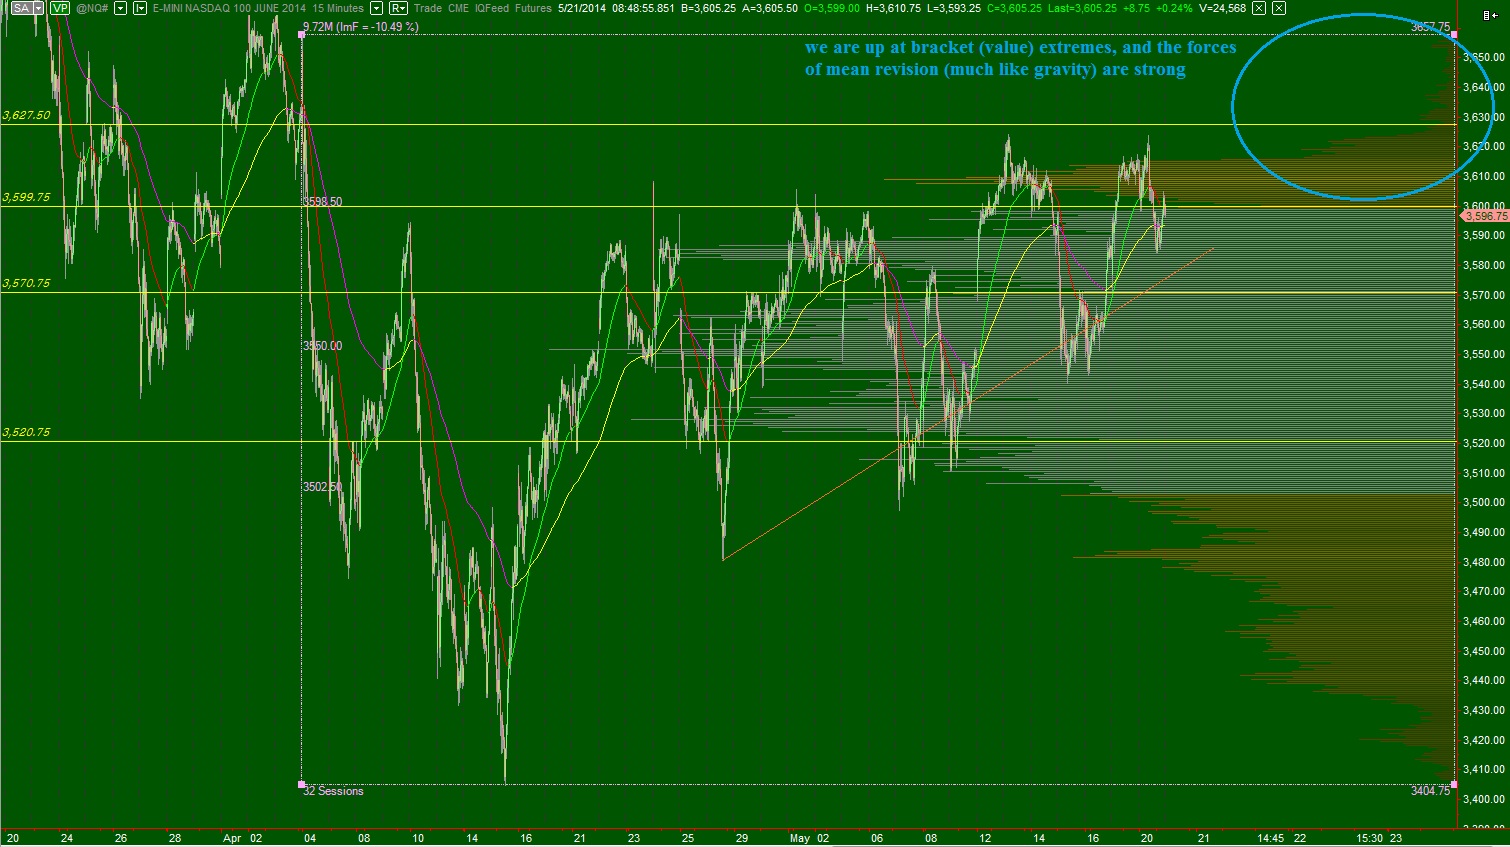
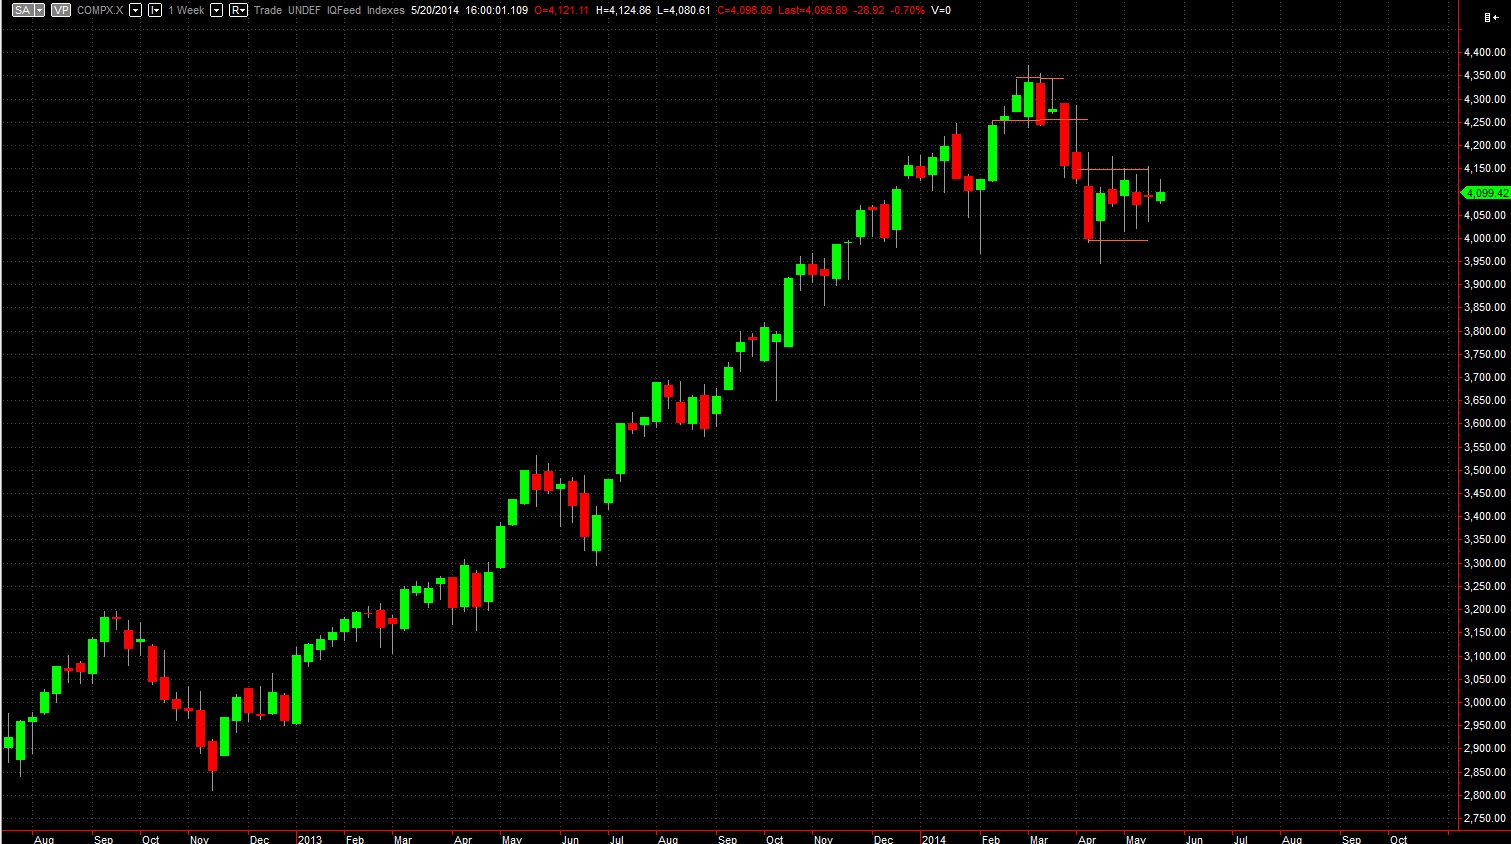
Taking our attention to a higher level, we can see the market coming into balance on the intermediate timeframe after yesterday’s price action.  The balance spans nearly 5 days and the action has a near-perfect symmetry.  The VPOC is about 1.75 points below the midpoint at 3723.875.  There is a well defined LVN at 3727.25, just below yesterday’s close.  The two price levels just above yesterday’s close are of huge importance.  Essentially, if the Nasdaq goes red-to-green today, pay very close attention to the price action at these levels as the volume/market profile context is big:

NQ_IntermediateTerm_06032014

Comments »

Starting The Month With Buyers in Control

We are coming into the month with a slight gap higher.  We are currently priced to open inside of range and balance from our previous trading day (Friday) which suggests we are in a lower risk/reward environment.  We have some manufacturing data coming out at 10am and a few treasury bill auctions at 11am.

The long term timeframe left the balance bracket behind as buyers took the reins of control last week.  The question now is the impact we will see from the above supply we are pricing into.  See below:
NQ_Weekly_06022014

Turning our attention to the June contract, our front month contract for the next few weeks of futures trading, we are trading just a touch below all time contract high.  Buyers sustained control of the intermediate timeframe into the close of last week.  It will be interesting to see if they continue controlling the tape or whether we come into balance.  See below:

NQ_IntermediateTerm_06022014

The short term auction has some interesting market profile context.  You can see a ledge formed overnight and the potential for us to trade lower and rotate through Friday’s balance.  Whether this ledge gives way or not early on will be a key component of early trade.  We also have a “poor high” from last week, where two TPOs printed at the high, this lines up with the overnight high of 3740.50 and overall looks vulnerable.  See below:
NQ_marketprofile_06012014

Comments »

Opening Swing: Thin Volumes and Dicey Action

With summer warming up in the northeast the trading week had a feeling of emptiness.  The fine weather may beckon otherwise retail participants to instead explore outside activities, leaving only the most hardened and skilled participants around to do battle in the electronic futures performance arena.

Drone strikes can be particularly effective in this environment, and we saw a few midweek.  Overall, my algos were quiet, only triggering once into the bell and late into Friday’s trade.  With the market thin, it paid to be patient and really allow the market to come into the thick midpoint of trade before attempting entry.  You will see all of this, and more, on the following opening swing charts.

Note: Monday trade is not included as it was an USA holiday.

TUESDAY:
05027014_os

WEDNESDAY:

05028014_os

THURSDAY:

05029014_os

FRIDAY:

05030014_os


Comments »

Contract High in Sight

Nasdaq futures are down a touch after a balanced overnight session.  The 8:30am Canadian GPD numbers as well as the Consumer data out of the USA was initially met with a selling response.  We jave more economic data out at 9:45 and perhaps some Fed speak.

Yesterday the price action was tight after we opened inside Wednesday’s neutral print.  The opening type was an open auction inside range which eventually broke higher.  The Nasdaq rallied late in the session and into the 15 minute settlement period after cash close.  As a result, I had to split off the late auction from the rest of the well-defined profile.  This yields a clear picture of the balance and levels of opportunity below current prices.  See the following market profile chart:

NQ_marketprofile_05302014
The intermediate term swing is buyer controlled.  For a moment yesterday morning it looks as if we may be coming into balance.  However we never made a lower low after printing a lower high.  Instead the swing continued pressing higher and by the close of trade we were only 2.25 points away from contract highs.  I do not draw too many lines on my intermediate term chart when possible because I want to see the volume profile structure.  I have noted three key intermediate term levels however: the contract high, a nice low volume node just above yesterday’s congestion, and another nice low volume node inside the volume pocket buyers rejected us out of.  See below:

NQ_IntermediateTerm_05302014

After a strong week and into month end, the context is challenging.  Waiting for a clear picture to emerge will save your emotional capital, even if it turns out to be a losing trade.

Comments »

Assessing The Shore Break

After closing out trade yesterday in the Nasdaq futures with a neutral print, the balance and indecision continued throughout the globex session.  The market balanced ahead of GPD and jobless claims information.  The expected numbers were -0.5% and 318k.  Actual GDP number was -1% and actual claims were 300k.  Thus we had a slightly worse than expected GDP number, which was blamed on weather and a slightly better reduction in jobless claims.  The premarket reaction is timid.

We are currently priced to open in balance and in range suggesting a lower risk environment.  Keep in mind however that we started the week with a gap higher and have yet to even attempt filling it.  This piece of context in the back of most speculators minds as they position throughout the day.  This is either gap and go support, or a more likely fill opportunity.

On the intermediate timeframe, we can see the buyers controlled price action for nearly 6 uninterrupted days.  The late selling yesterday almost gives the intermediate term a balanced look, but with a slight edge to the buyers.  See below:

NQ_IntermediateTerm_05292014

I have merged the overnight market profile into yesterday’s profile so we can see the near perfect balance on the short term.  These levels will be in play early on:

NQ_marketprofile_05292014_24hr

Overall, on the short term, we are coming into balance after squeezing shorts. Whether we continue to squeeze shorts is contingent upon sustaining trade above yesterday’s neutral print.  See below

NQ_marketprofile_05292014_24h

Comments »

Riding Every Last Bit of The Wave

Nasdaq futures traded quietly for most of the night before sellers came in around 8:30am.  Since then, it appears the sellers have taken control on the very short term in an otherwise balanced overnight session.  There are some retail store numbers out premarket including the Redbook, and we have several treasury auctions in the afternoon.  The economic calendar is otherwise quiet for the session.

Buyers pressed the envelope of extreme on the intermediate timframe yesterday after starting the day with a short squeeze.  The market profile print into the early afternoon resembled a P-shape, which signals a dynamic short squeeze which failed to attract fresh initiating buyers.  However, buyers were enticed by the higher prices eventually and an afternoon rally took shape.  You can see we are trading above a composite volume pocket below.  This may be traversed several times today and during the rest of the week:

NQ_IntermediateTerm_05282014

On The short term, buyer are in control but we are set to gap lower a touch in a thin volume zone.  One must be careful in this region as price can move very fast.  I suspect we retest yesterday’s VPOC if sellers continue their early campaign, and we still have a large gap left below on the weekly chart.  I have highlighted a few short term observations on the following market profile chart:

NQ_marketprofile_05282014

Comments »

Starting The Week With A Gap Up

Nasdaq futures drifted higher while stocks were closed for trade Sunday and Monday, and as we approach USA open prices are around 15 point above our Friday closing price of 3675.  Durable Goods Orders came in better than expected at 8:30am but was received by the market with a muted response.  This may suggest buyers have already priced in best case scenarios on the short term.  Or perhaps participants are moving slow after the holiday weekend.

The short term pivot level early on appears to be 3689.75.  Taking a look at our 24-hour profile which includes all of the globex trade during the holiday, we can see a buildup occurring just below this level before finally bursting through.  The resulting profile has a low volume node at this action point.  See below:

NQ_marketprofile_05272014_24hour

Buyers are in control the intermediate term swing.  Price has been trending higher since setting swing low on 5/20.  The action indicates other timeframe (OTF) activity.  These longer term participants became evident last Wednesday and now they are coming into the week in control.  There is a possibility we see some profit taking by the OTF early this week, and an early tell about the profit taking and the overall health of the market will be the depth of the next pullback.  It seems bulls will want to hold 3645.25 which is Friday’s low print and a low volume node on our composite.  Otherwise the door swings wide open for a fast mean revision trade to take hold:
NQ_IntermediateTerm_05272014

It is important to keep the long term market structure in your mind even while you trade the very short term.  Looking a monthly candle chart you can see the sideways churn or bracketed trading action.  Markets spend around 70% of the time in balance.  Hanging out up near the dot come bubble peaks for this long is rather interesting.  What is it telling us about the overall health of the marketplace?  What is it telling us about investor risk tolerance?  See below:

COMPQ_Monthly_05272014


Comments »

Monitoring Continuation

We never know how far the market can go in any one direction.  We can however monitor the action and look for signs of continuation.

Nasdaq futures  are trading a touch higher after giving up some of the overnight gains when the 8:30am jobs report hit the tape.  We are currently trading just above the low of the job claims selling as the USA comes online.  The overnight session formed an odd ledge which is likely to resolve early on, especially given the proximity to the overnight gap.  See below, on the 24-hour profile:

NQ_marketprofile_05222014_24hour

The regular trading hours profile shows buyer control, however not the radical jolt higher radical control we have been managing to trade lately.  Instead we saw buyers respond to early pricing as if it was a discount, and later in the session more buyers came in and initiated fresh risk.  Toward the end of the session we saw another rally which printed a high volume node near the high of the session.  This is interesting and suggest the market was successful in facilitating trade at these higher prices.  Higher advertised prices brought more buyers into the market.  See below:

NQ_marketprofile_05222014

We need to remember however, that we are trading at the high extremes of intermediate term balance.  Gravity may kick in and pull us back to the mean, which is now very far from current prices.  Should this occur, we would first need to lose some important composite low volume nodes.  I have highlighted the levels below which sellers would have to bunker bust to cue the revision trade:

NQ_IntermediateTerm_05222014

Comments »

Keep These Levels on The Forefront

The overnight auction is slightly higher in the Nasdaq index after an interesting neutral session yesterday.  As the week continues on, volumes are light and likely to decrease as we head into the holiday week.  Note: US markets will be closed Monday in observation of Memorial Day.  We have lots of Fed talk on the docket for today which may lend some volatility to the market. However, as the USA comes online we are priced to open inside yesterday’s value and range.

Yesterday was a neutral day, the type of market profile print where price range extends beyond both extremes of the initial balance.  These profiles suggest aggressive indecision on the behalf of the marketplace and tend to occur at or near inflection points.  The volume profile print that resulted from the action shows the heavy indecision with a wide distribution and several high volume nodes throughout the profile.  We settled near the mid, but there are some interesting characteristics and price levels from which we can glean some intraday insight as today progresses.  See below:

NQ_marketprofile_05212014

Since we can see the seller above, and we can also see the thin structure they desire to press price into, we can zoom out to the intermediate term and see why their presence is being felt.  See below:

NQ_IntermediateTerm_05212014

And if we zoom in on the intermediate term action, we can see the microcomposite low volume node that is pivotal on this timeframe, 3599.75, which you just as easily could have conjured by watching the price action around the 3600 century mark.  But at least we know there is a why in the equation.  As adult learners we always want the what and the why.  See below:

NQ_IntermediateTerm_05212014_2

Finally, going to the very long term weekly chart of the Nasdaq composite, we can keep our mind wrapped around the brackets we are trading in.  The market spends more time bracketing then trending, so you need tools to trade these conditions.  See below:

 NQ_LongTerm_05212014

Comments »

Mission Critical Danger Zone

Nasdaq futures are trading a touch higher overnight in a mostly balanced session.  The key feature that stands out from the 24-hour profile (which includes our globex session) is the ledge that formed at 3607.25.  Markets have a tendency to spill over, or “flush through” these ledges.  The context of a ledge is interesting because we can glean insight from it.  If the market is instead unable to press below the ledge, then the profile piece is indicative of a strong bid in place.  I have highlighted this ledge below:

NQ__MarketProfile_05202014_24hour

Taking our eyes to the intermediate term timeframe, we are at the top of our bracket range.  This zone is as challenging an environment as I know to trade within.  The forces of mean revision act like gravity on the tape and their powers are stronger until we exceed balance and begin exploring elsewhere.  This is week 7 inside this bracket range which is fairly old in market years.  The potential does exist to breach and explore higher, however you should be looking closely for signs of weakening propulsion.  There’s no need to get fancy in this regard, keep your eyes on 3600.  There is a very low volume node at 3599.75 which separates us from the main pull of mean revision.  See below:

NQ_IntermediateTerm_05202014

Short term, we are buyer controlled with yesterday’s profile finishing out with a strong distribution atop a thin zipper.  This looks like an exaggerated short squeeze profile which often takes on a P-shape.  It suggests the progress made in the morning was sufficient for the day and did not entice enough new buyers to continue the trend.  That makes sense, given we have an entire week left.  Upside targets are the 05/13 high at 3624.25, then the naked VPOC from 04/03 at 3631.75.  Caution below the profile ledge at 3607.25:


NQ__MarketProfile_05202014

Comments »