iBankCoin
Home / Tag Archives: $NQ_F (page 36)

Tag Archives: $NQ_F

Ho Ho Pro Gap

The index futures are currently trading well outside of yesterday’s range.  The S&P futures are set to open nearly 10 handles higher.  This is pro gap territory where attempting to fade the price action for the gap fill down is more difficult. 

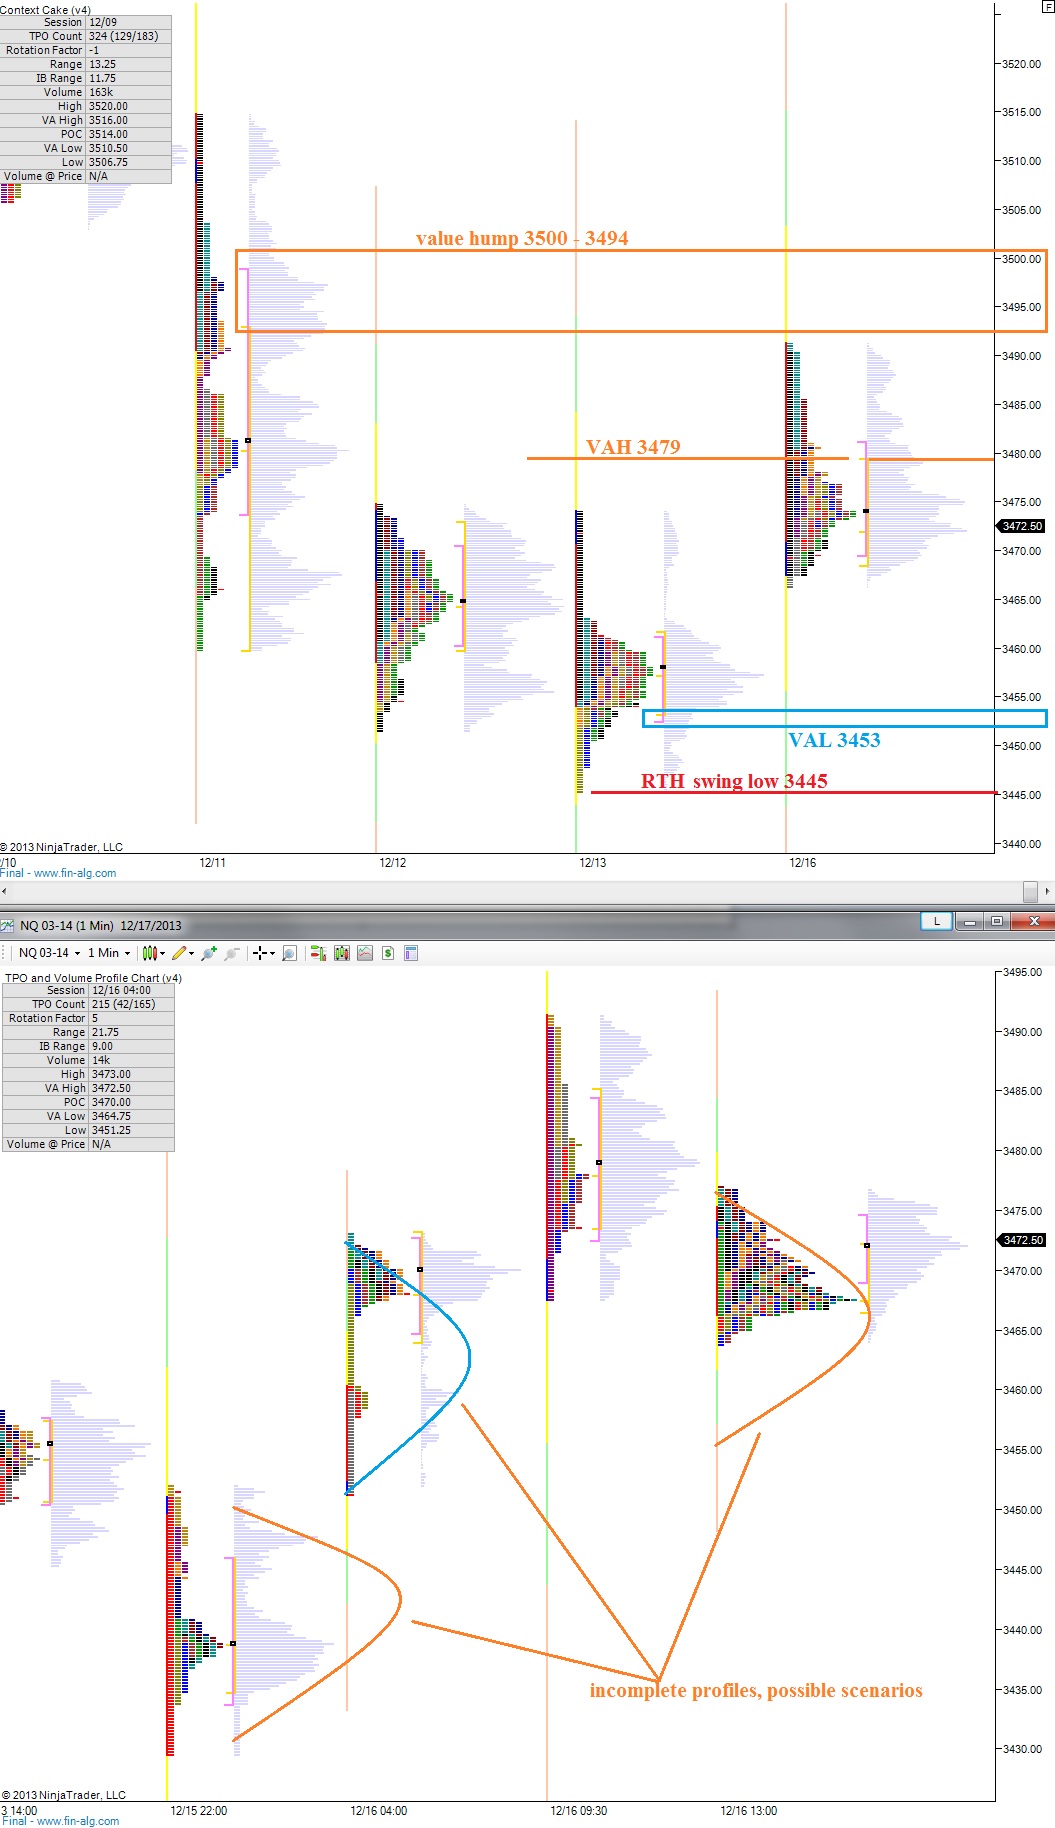
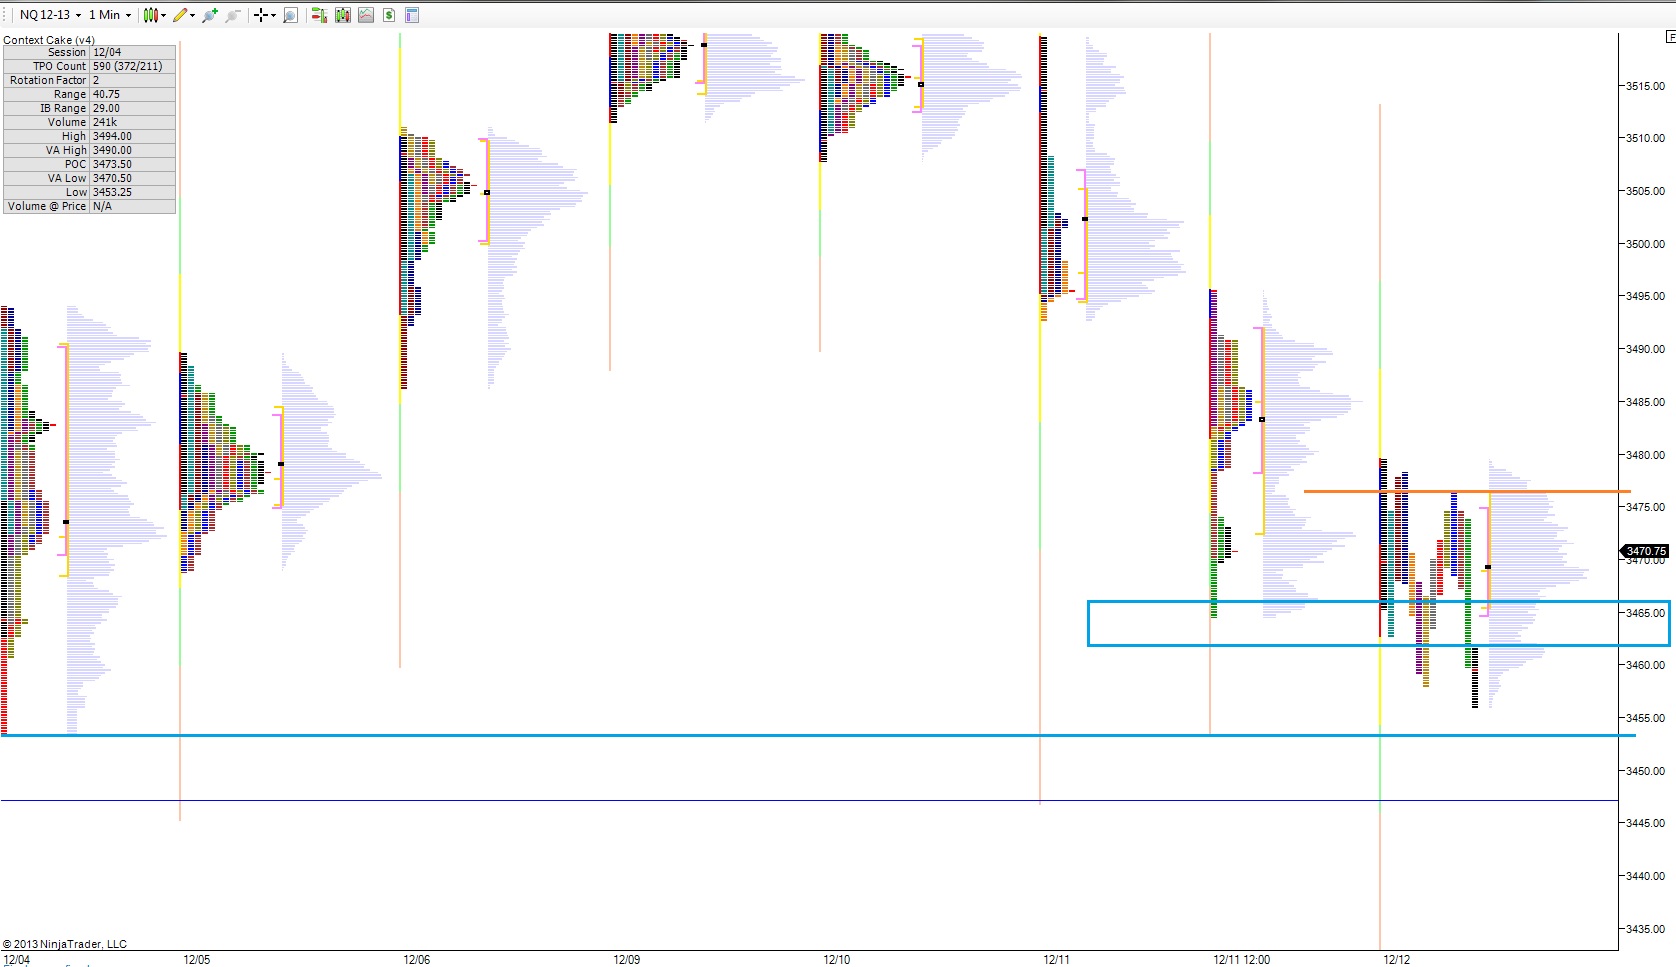
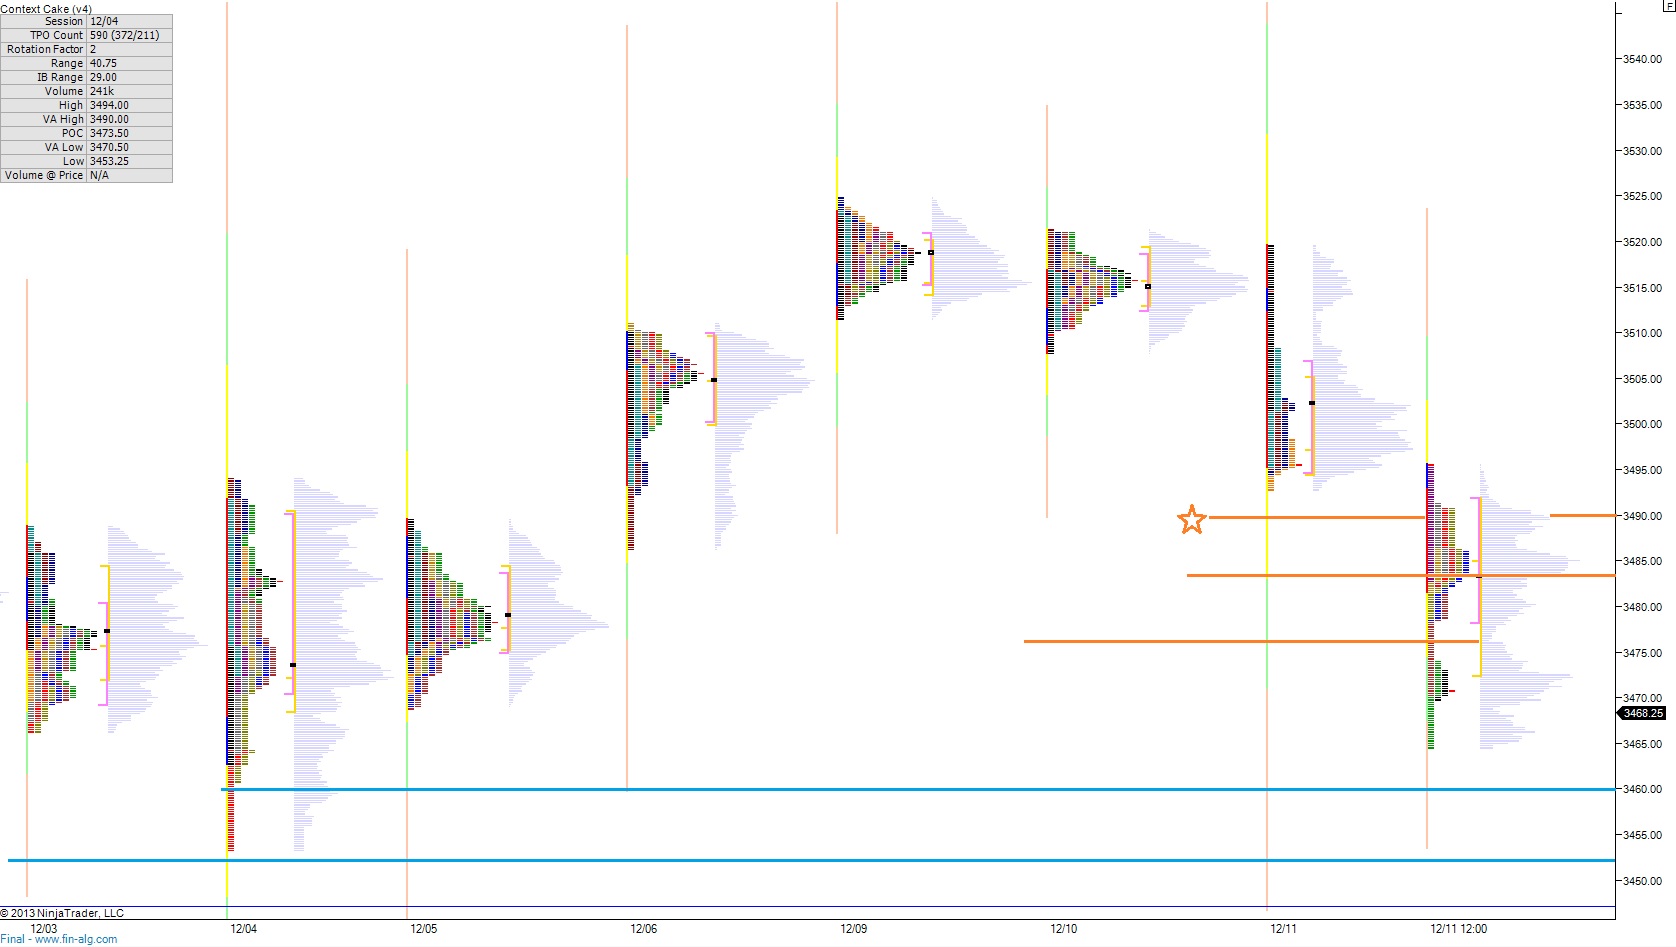
Turning our attention to the NASDAQ, via the /NQ_F, we can see the market printing two distinct distributions overnight as price drifted higher. 

Intraday trading in this large gap environment can be difficult, but it is best to choose one side and stick with it to avoid getting chopped.  The opening type will help shape this bias.  Should price drive higher or lower off the open, we can gather who is in control of the action.  A sideways auction with little given back to the downside would suggest the market has accepted the overnight move and to play the long side, for example.

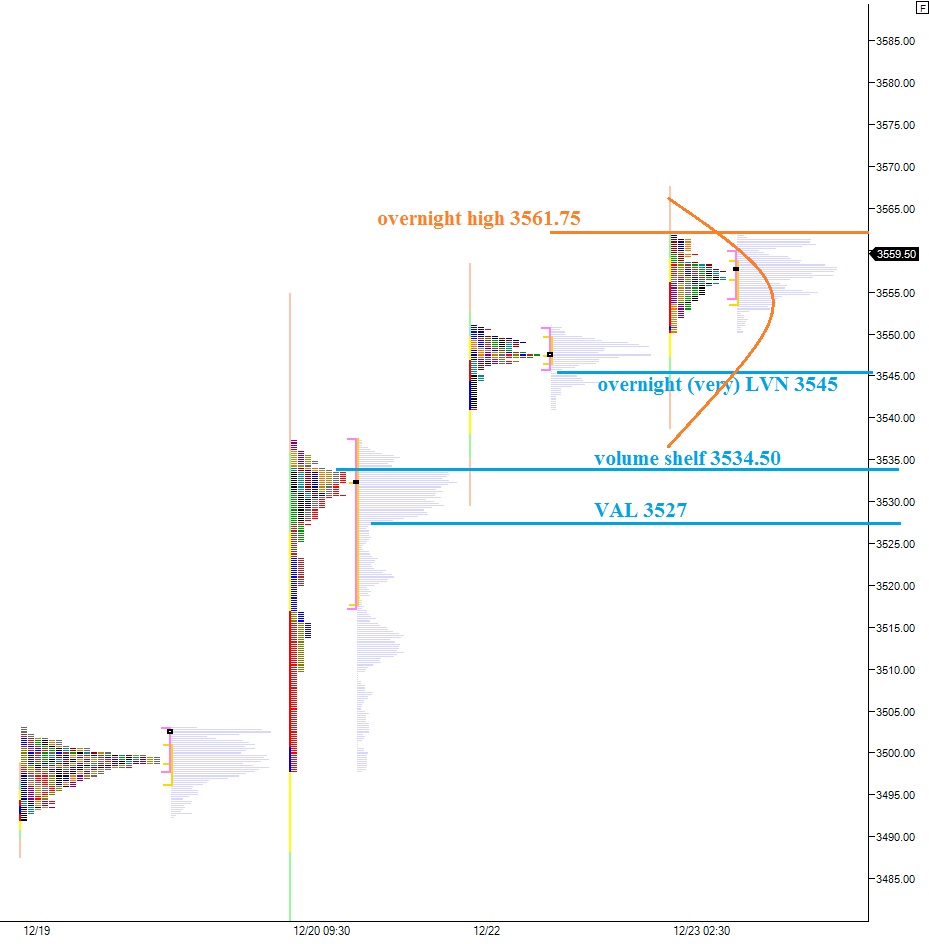
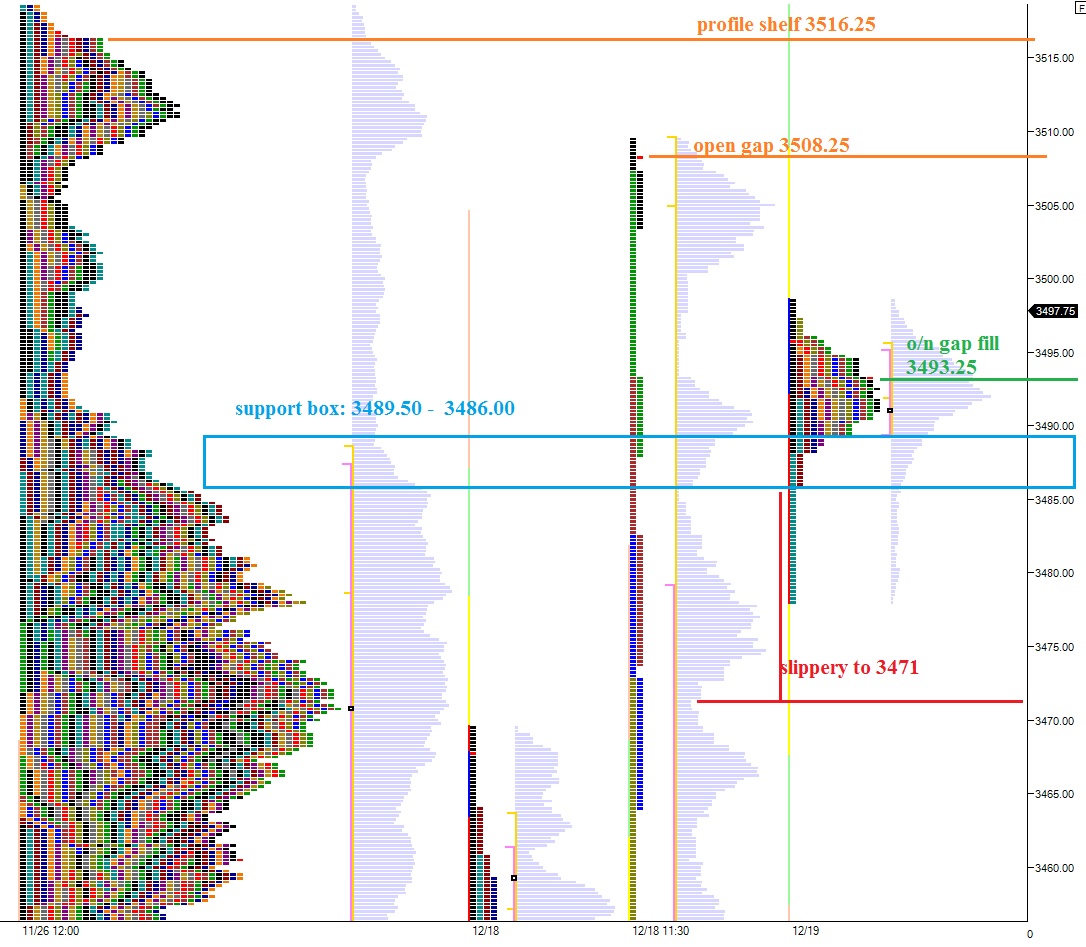
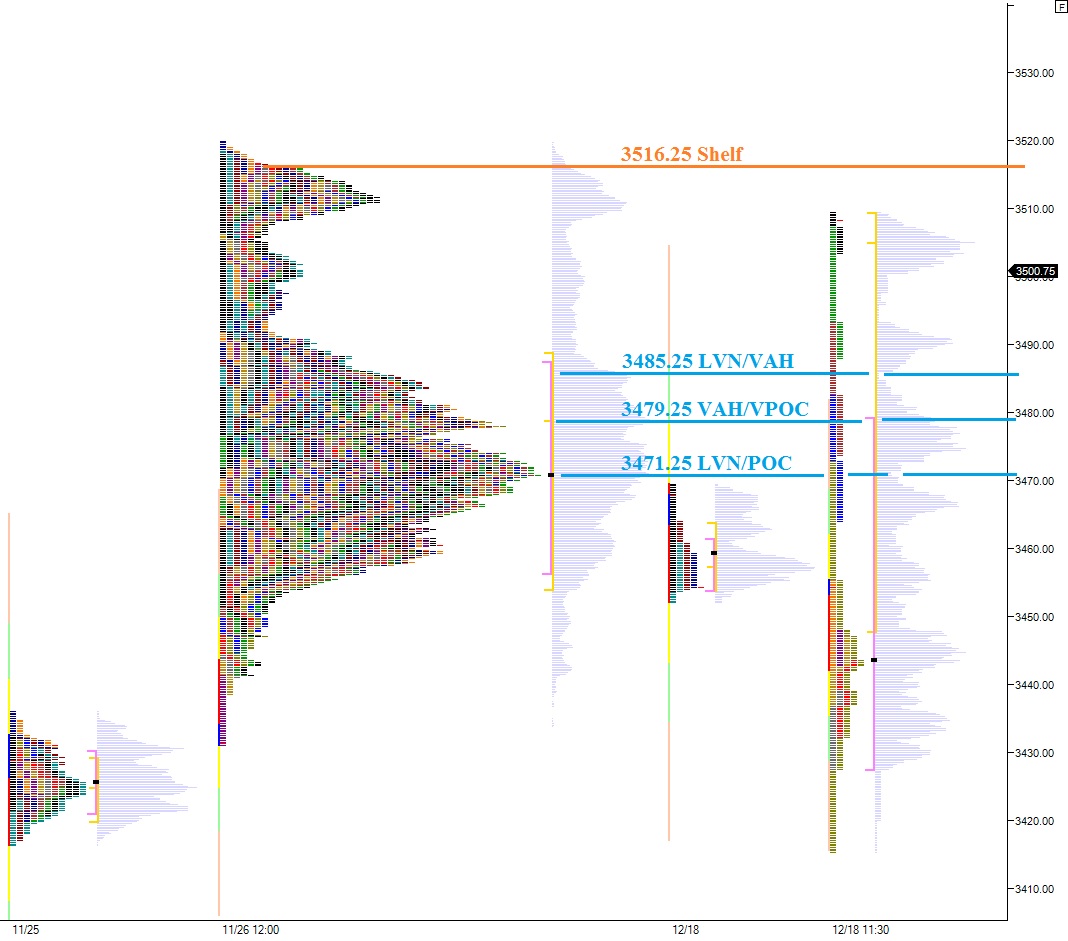
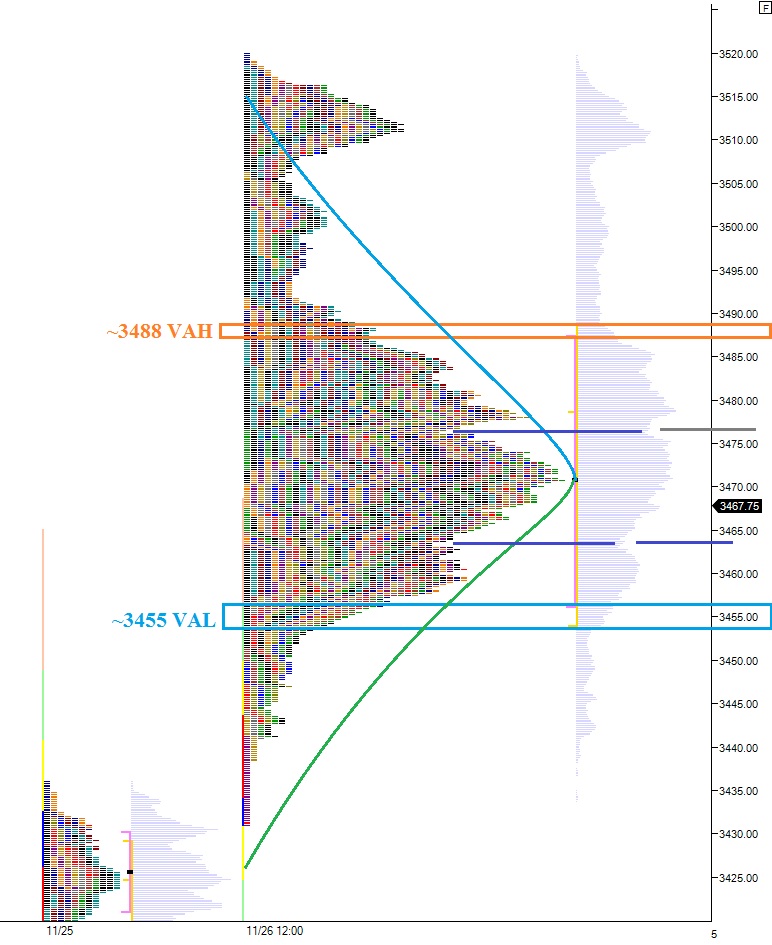
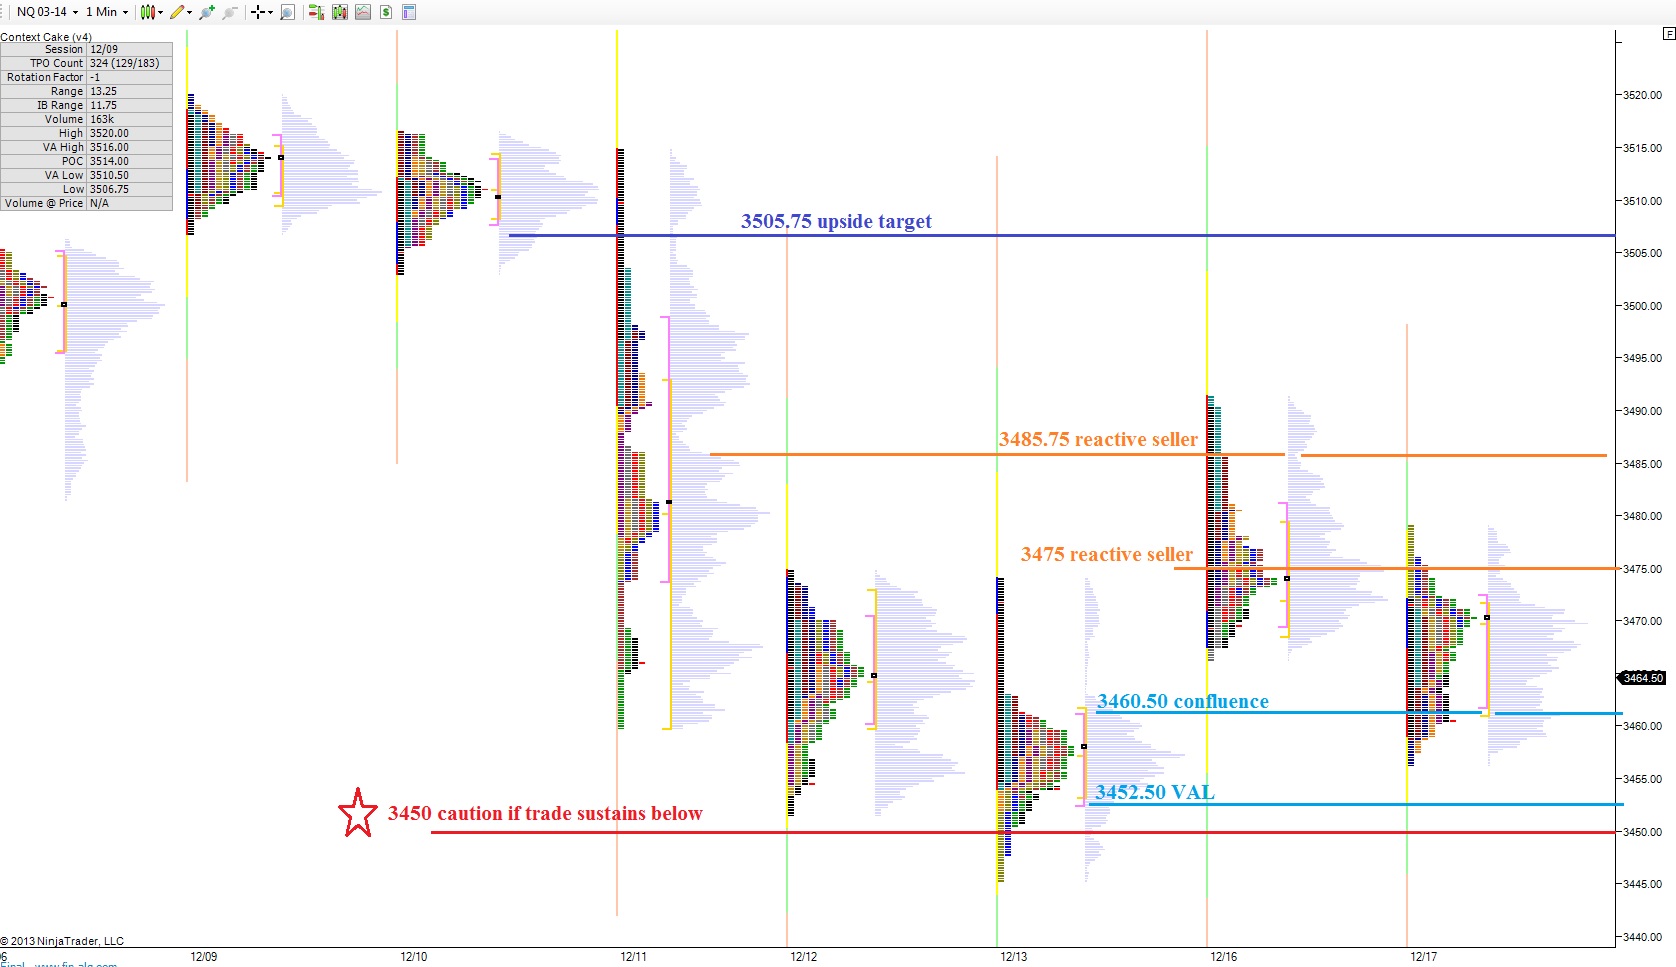
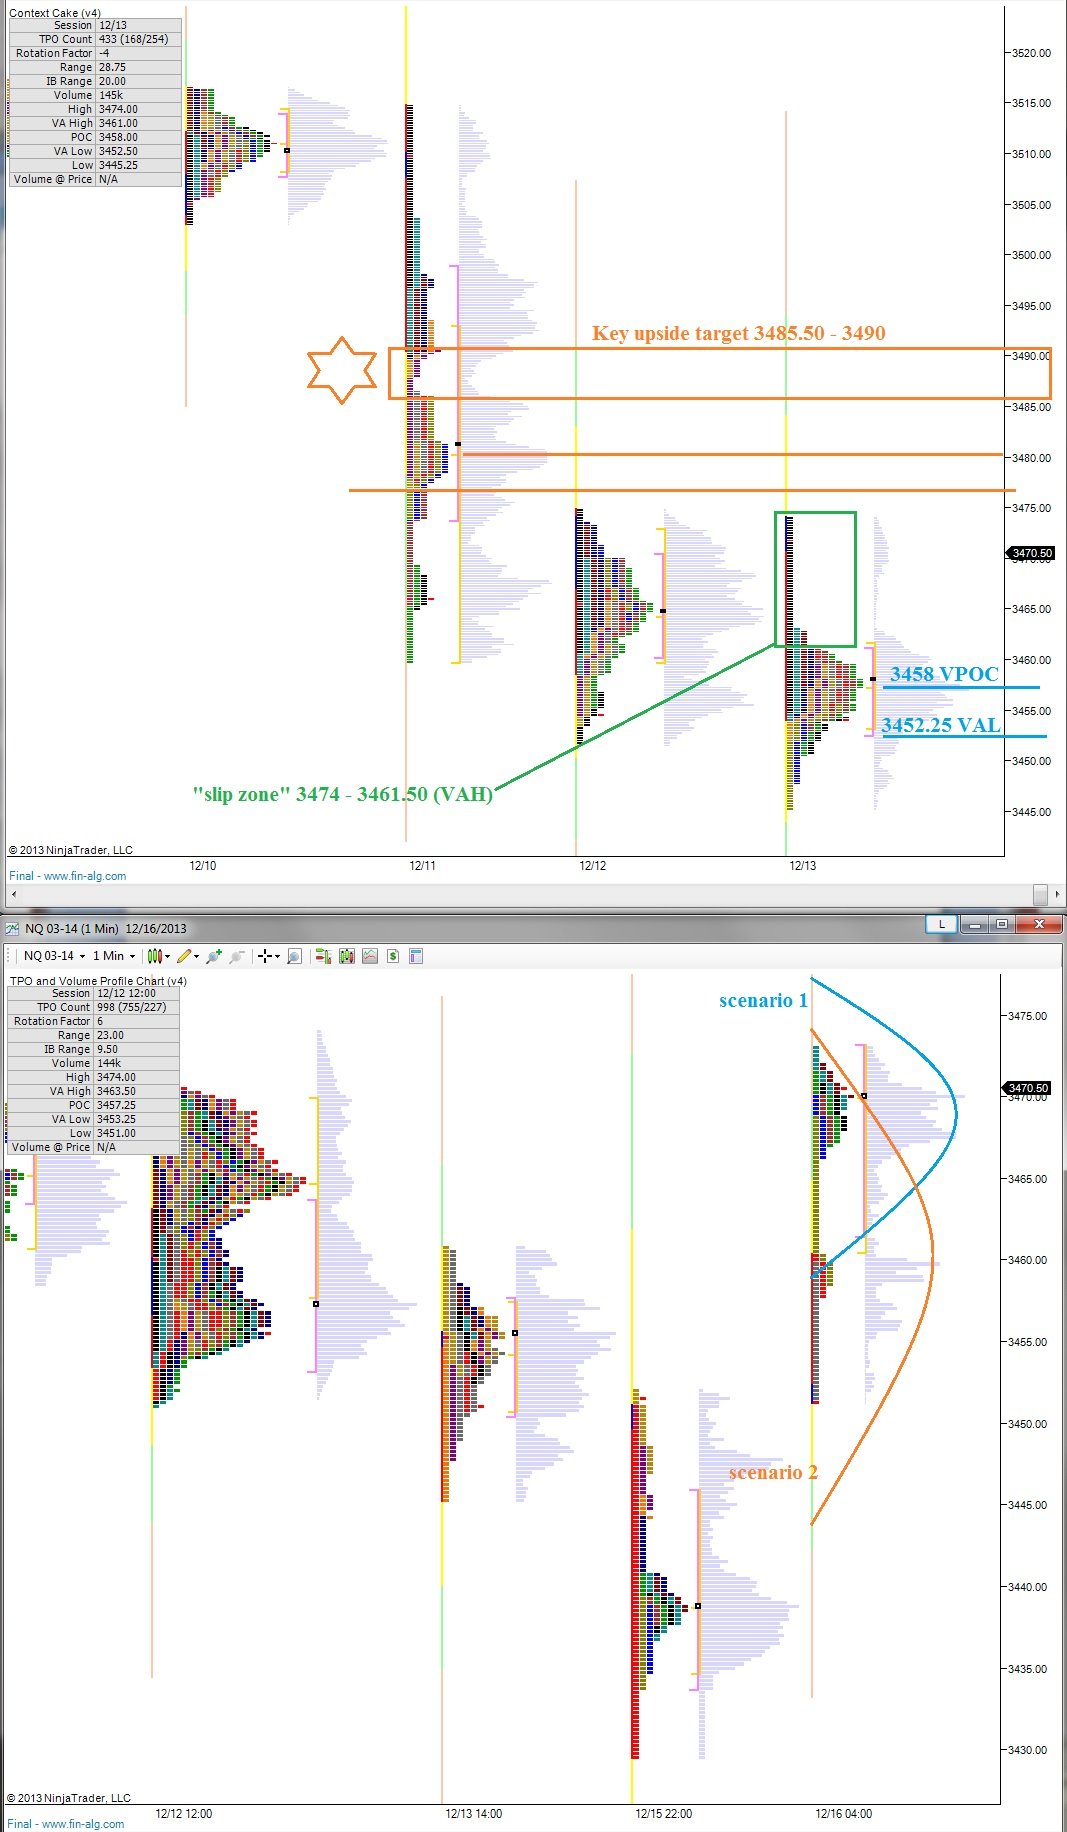
I have highlighted a few levels of support, as well as a few scenarios on the following market profile chart:

NQ_MarketProfile_12222013

Comments »

Put a Bow on the Week With Market Profile Theory

The market drifted higher overnight, with the NASDAQ printing two methodical rotations higher.  The action was dynamic enough to press price outside of yesterday’s value, but static enough to keep prices within yesterday’s range.  Thus the risk/reward level is elevated today, but not National Homeland Security Red by any means.  It’s more like a code orange.

Talking overnight gaps, we still have a gap open between Wednesday and Thusday on the upside at 3508.25 and we have this morning’s gap down to 3493.25.  These contextual pieces may lend themselves to a bit of chop in the early market hours.

Yesterday was a digestion/balancing day, with the market accepting it’s marked up prices and buyers on the delta.  Buyers on the delta refers to the order flow intraday, where we saw participants willing to take the offer and actively engage the market to enter long positions (or cover shorts).  We printed the very uncommon normal day  in market profile terminology, where the first hour’s price action was very wide and contained the range for the rest of the day.  We have a buying tail on the low end of our profile suggesting buyers perceived the early drop in prices as deep discount and reacted accordingly.

Overall, we printed a P-shaped profile which signals a short squeeze occurred.  Whether that squeeze will provide the tinder to spark another rally will be revealed today by the auction activity.

I have highlighted levels I will be watching to track the progress made by buyers and sellers on the following market profile chart:

NQ_MarketProfile_12202013

Comments »

Today Is When You Make The Money

Yesterday afternoon, once we had our news of taper, we saw a clear entry of the long-timeframe trader.  It started with an aggressive buyer reaction to prices perceived as deep discount—a long tail printed off the lows.  Next we saw two-timeframe action where the intermediate term was wrangling for control with the long timeframe.  This action can be seen just below our balance zone’s value area low.  Once we reentered the balance zone, long time frame captured control of the market and pressed us through the value area and up to our hinge of supply near the annual highs.

My expectation today is to see back-and-fill balancing taking place between the shelf of historic price action at the highs and the layers of support built below.  I have highlighted these reference points on the following NASDAQ market profile chart:

NQ_MarketProfile_12192013


While the market is balancing out, look for individual pockets of momentum to run as people chase performance in this last full week of trade.  Check out the Option Addict blog and comment section where top traders are sharing the names they will be watching for momentum.

Comments »

Ignore The Fed and Observe The Auction

It is not necessarily that today’s news headlines are any more important than what we saw last month or any other day or week for that matter.  Instead what makes today important from a trading point of view is the aging balance zone which has developed in the intermediate term.

Long term, we have a market in the solid control of buyers.

Intermediate term, we lack control.  Since about November 26th, the market has balanced and chopped with no clear victor in place.  I have illustrated this intermediate term balance today using the NASDAQ composite futures and the developed Gaussian curve spanning several weeks.  See below:

NQ_MarketProfile_12182013_intermediate_term

On the short term, I give sellers the slight edge for liquidating the market on 12/11 and since then only allowing the market to coil.

Yesterday we printed a neutral print, which signals indecision and tends to occur near inflection points.  This is balancing.

Overnight we bounced back from the late afternoon fade and have chopped along.  More balancing/indecision.

Thus I conclude we are in a balancing environment.  Therefore we must be aware of when the market is moving out of balance, and who is asserting control.  As you can see on the above chart, there is a hinge of overhead supply the market needs to negotiate.  The low end of our intermediate-term distribution shows a buyers’ tail. 

Drilling into the daily market profiles, I list the key levels to monitor as we move about today.  I am especially keen on 3452.50 – 3450 below.  If we do not see buyers at this level, the downside could accelerate.

NQ_MarketProfile_12182013

Comments »

Clear Expectations for Today

The NASDAQ futures market showed a bit of follow through on the behalf of the sellers, where price took out our Monday morning low.  However, the probe lower, likely algorithmic in nature, was met with a reactive buy force and price swiftly auctioned back into yesterday’s value range.

Conversely, the SPX futures made no new low overnight, instead continuing to coil.  There has been a subtle bit of relative strength exhibited by the SPX verses the NASDAQ composite these last few days including yesterday where we printed a normal dayIn market profile theory, a normal day features a dynamic open, likely driven by a longer timeframe trader entering the marketplace.  The range of the first hour is not breached for the rest of the session.  These are very rare, occurring in the SPX only five times in the last six years.  Oddly enough, we printed a normal day in the SPX on Friday and Monday.

The action suggests coiling and this uncertainty is suitable for our current situation.  We are nearing the close of a very strong year in the markets.  Many are likely closing their books early to lock in the gains, yet we have strong pockets of momentum in select industries.  The Fed, our current market moving exceptional, is experiencing a changing of the guards from Bernanke to Yellen and we have taper talks given the recent progress in the labor markets.

The markets have two choices today.  Either continue to coil ahead of Wednesday’s Fed announcement or move away from here.  I have bracketed both the NASDAQ and the SPX today as guideposts as the day progresses.  Keep these brackets, or support/resistance clusters, in mind today as the day progresses to measure any progress made by the buyers and sellers.

I have also highlighted a few scenarios for the NASDAQ using the 24 hour market profile chart:

ES_MarketProfile_12172013


NQ_MarketProfile_12172013

Comments »

Large Range Indecision Overnight

Note:  All price levels mentioned going forward will be in reference to the March contract. 

If you were just waking up to the market, you may be unaware of the wild ride index futures took overnight.  The S&P printed over a 20 point range in the overnight session after reversing early weakness.  The Nasdaq traded over 40 points in range.  In short, last night featured violent indecision of the overnight/low volume variety.

As of 8am, the S&P is set to open above Friday’s range which tells us we are in a high risk/reward environment.  The NASDAQ is not quite above Friday’s range, but is outside of Friday’s value which gives us a similar context to frame our day.

Early on it will be interesting to see if sellers can reject the overnight progress and press back into Friday’s value.  Turning our attention to the NASDAQ, we are opening in the slippery single prints from early Friday where sellers aggressively auctioned lower.  We may see a similar push from sellers early on and should monitor trade at 3461.50 which marks the value area high on Friday’s session.  Below there we have a VPOC at 3458 and a value area low at 3452.25.  Short sellers will be on the lookout for a rejection of this range as it may signal a bullish reversal is materializing.

I have noted these levels, as well as key resistance points and a few possible scenarios on the following market profile charts:


NQ_MarketProfile_12162013

Comments »

Discouraging Times

We continued working through a correction yesterday in the NASDAQ where sellers continued to their control.  Their success in controlling yesterday’s auction can be seen in yesterday’s RTH market profile print.  Assessing their control boils down to the following points:

Range extension lower

Value overlap/lower

VPOC migration lower

Lower high and lower low

The positive news for longs is price has begun the pinball process of discouragement, where price is chopping around and taking no prisoners on either side.  If my read on sentiment is correct, I will be looking for a higher low to setup soon on the NASDAQ.  This may occur as soon as today.

The S&P has a very similar sentimental context.

Buyers came in overnight and bid the markets up a bit, but we are still trading inside of yesterday’s value, thus it has been accepted.  Early on, I will be looking for sellers to reemerge and press price lower.  I will be gauging their sentiment between 3465.50 – 3462.50.  Should their pressure abate in this range, I will be looking for long exposure.  Should their selling campaign continue, I will look for sellers to push into our 12/04 low at 3453.25.

On the upside, I will look for any signs of trade sustaining above 3476.50 our value area high from yesterday and also a low volume node left behind during Wednesday’s liquidation.

I have highlighted these levels on the following market profile chart:

NQ_MarketProfile_12132013

Comments »

Where to Get Long

If you have been sidelined in cash with risk capital you otherwise desire to be committing to equities, you may be coming into today with a shopping list of stocks.

Perhaps however, you should not simply buy at the open.  If instead you have the option to watch the day develop, I have two downside targets in mind for adding exposure.  The following prices are in reference to the

The first is 3460 and the second is 3453.50. These price levels represent targets algorithms will have in mind when they attempt to liquidate any holdouts to the long side.  The market went up for quite some time, lacked follow-through conviction, and is now testing lower to gauge buyers’ appetite.  A step taken by the market place to do this is pressing into existing longs to see if they liquidate.

The overnight market was on the move and slightly lower.  The short term momentum favors seller control.  Therefore we can measure their conviction verse the above to support levels.  Should sellers abate early on, they may be waiting to see the auction first.  In this event, look for their presence at 3476.25, the low volume node just above our overnight high, then 3483 which is yesterday’s VPOC.

Should strength rip through the market, my upside target is 3490.

I have highlighted these prices on the following Market profile chart:

NQ_MarketProfile_12122013

Comments »

Sign Posts to Guide Your NASDAQ Sentiment

Sellers pushed into the marketplace early this morning and continue pressing into the NASDAQ.  Although a news bite may be the culprit, let us instead focus on the price action.

As I write we are making new overnight lows and they are carrying a bit of velocity.  Should the algorithms sense buyer blood we may see trade down to 3511 – 3509.75 range, pressing any long initiated yesterday during RTH underwater.

It would make sense to test the sentiment of the buyers early on after they lacked any real follow through on their rally yesterday.  Should buyers not show up at the above range our next levels of support are the LNV at 3505.50 then the value area low at mezzo-century mark 3500.

Below the mezzo century we open the door to a 12/5 retracement, when an open gap still exists down to 3478.25.

However, I am still calling for a rally off these highs.  Overhead I will look for signs of selling around 3519 (VPOC and gap fill) and yesterday’s high of 3525.

These levels can be seen on the following MP chart:

NQ_MarketProfile_12102013

Comments »

Powder Keg

The equity markets opened Sunday evening only to find buyers interested in increased exposure.  Since then price has behaved orderly, consolidating the overnight gains and positioning price outside of Friday’s price range and value.

Should prices on the NASDAQ composite sustain trade over 3511 into the opening bell, we are opening out of balance, and the risk of a violent move is high.  However, if I have correctly identified where were are currently trading within the sentiment cycle, we are deep in denial, which may produce muted trade.

The S&P is currently trading only two handles above Friday’s closing price which leaves the door open for a gap fill lower.  Early on, perhaps even pre-market, we may see sellers coming in to close the gap.  More important contextually than the gap however, is the low volume node we printed on Friday’s S&P volume profile at 1802.50.  This price level set value area low several times in November and on Friday the action from buyers was dynamic enough to leave a low volume, fast moving footprint.  Should the sellers quickly reject us back below this level and sustain trade for over an hour, we may be in store for further downside.

The NASDAQ is currently trading eight handles above its closing print showing greater strength early on.  I will be watching the overnight swing low at 3506.75 to measure bullish appetite early on.

Overall, the action looks ripe for a rally however it is paramount we stay objective in our analysis and accept and define price levels which may negate our thesis.  I have highlighted the low volume zone on the S&P on the following market profile chart:

ES_MarketProfile_12092013

Comments »