Opening Swing is an ongoing series where we review the opening swing for each day of trade in the NASDAQ futures and the effect these price levels demonstrate on the subsequent price action. We also look at tradable opportunities and discuss the risks involved with these trades.
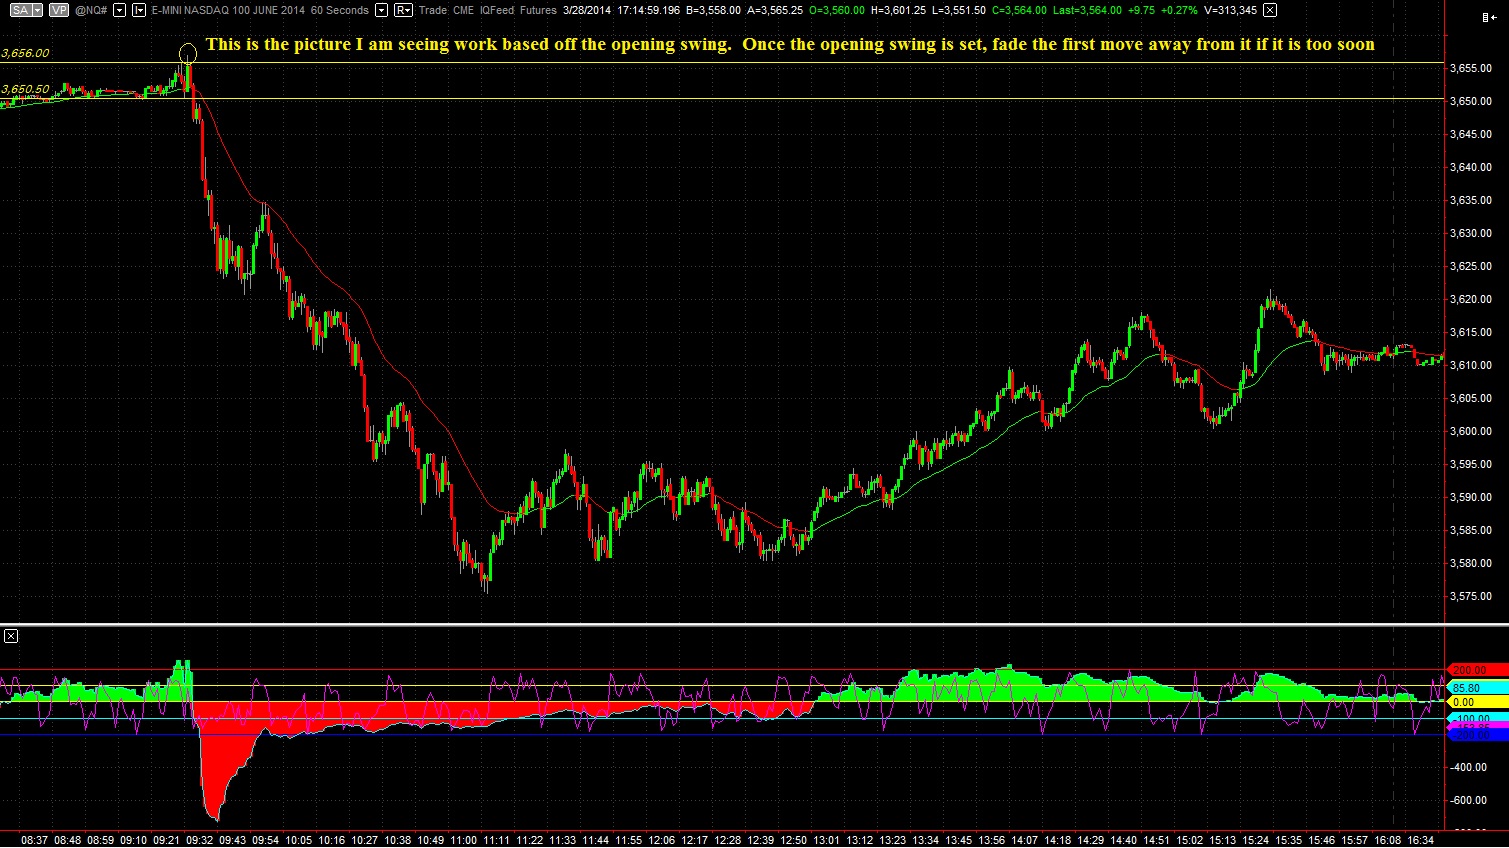
The opening swing is the price range established right after the market opens. There are orders called Market On Open (MOO) orders which execute when the market opens. The opening swing is not timed, but rather the push in either direction from these orders.
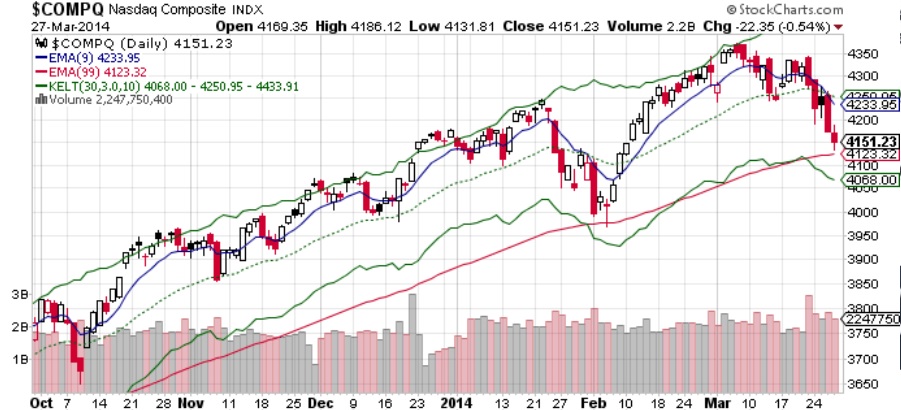
I began writing this series at a very interesting time in the market. Many of the traders I respect and follow foreshadowed 2014 to be a year of increased volatility and as soon as it hit in mid January I began formulating thoughts and testing strategies to capitalize on the wider ranges volatility offers. I chose to focus on the NASDAQ because it offers a wider range to trade then the S&P and also by monitoring the index I have an indication of the pressures existing on most of the stocks I trade.
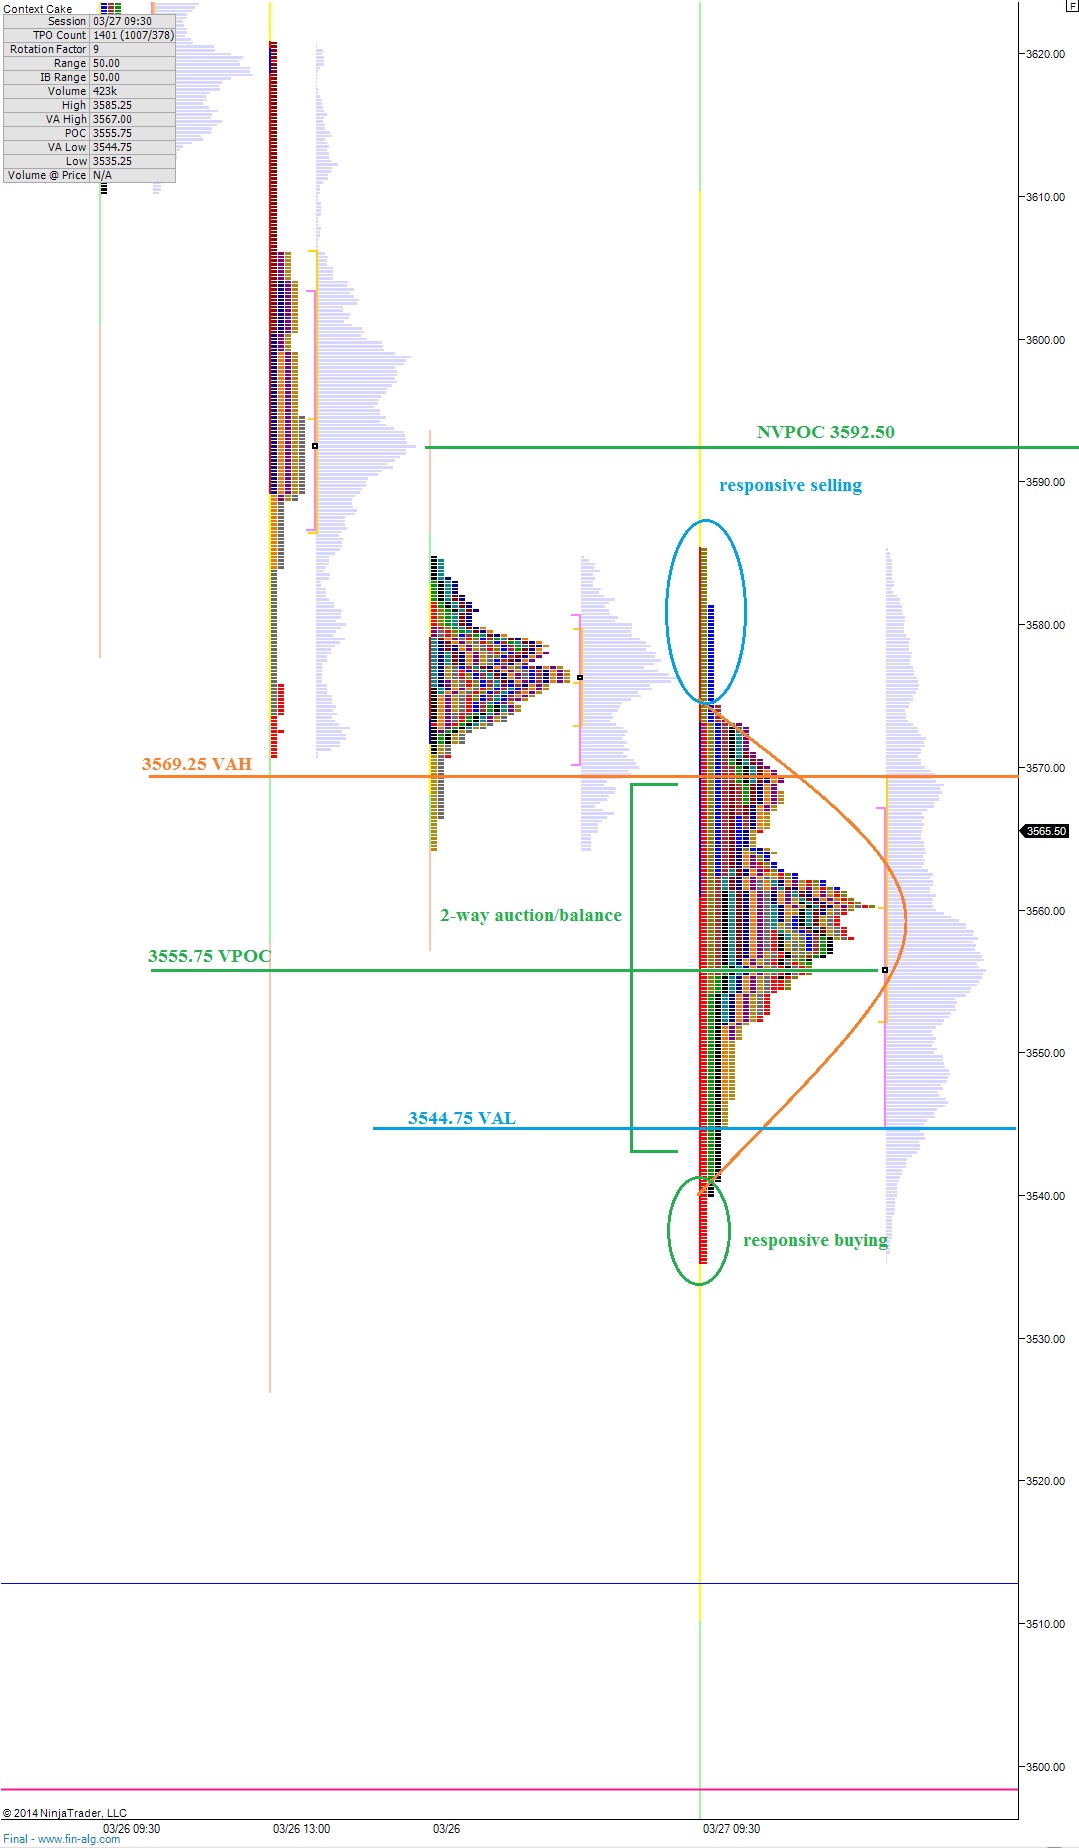
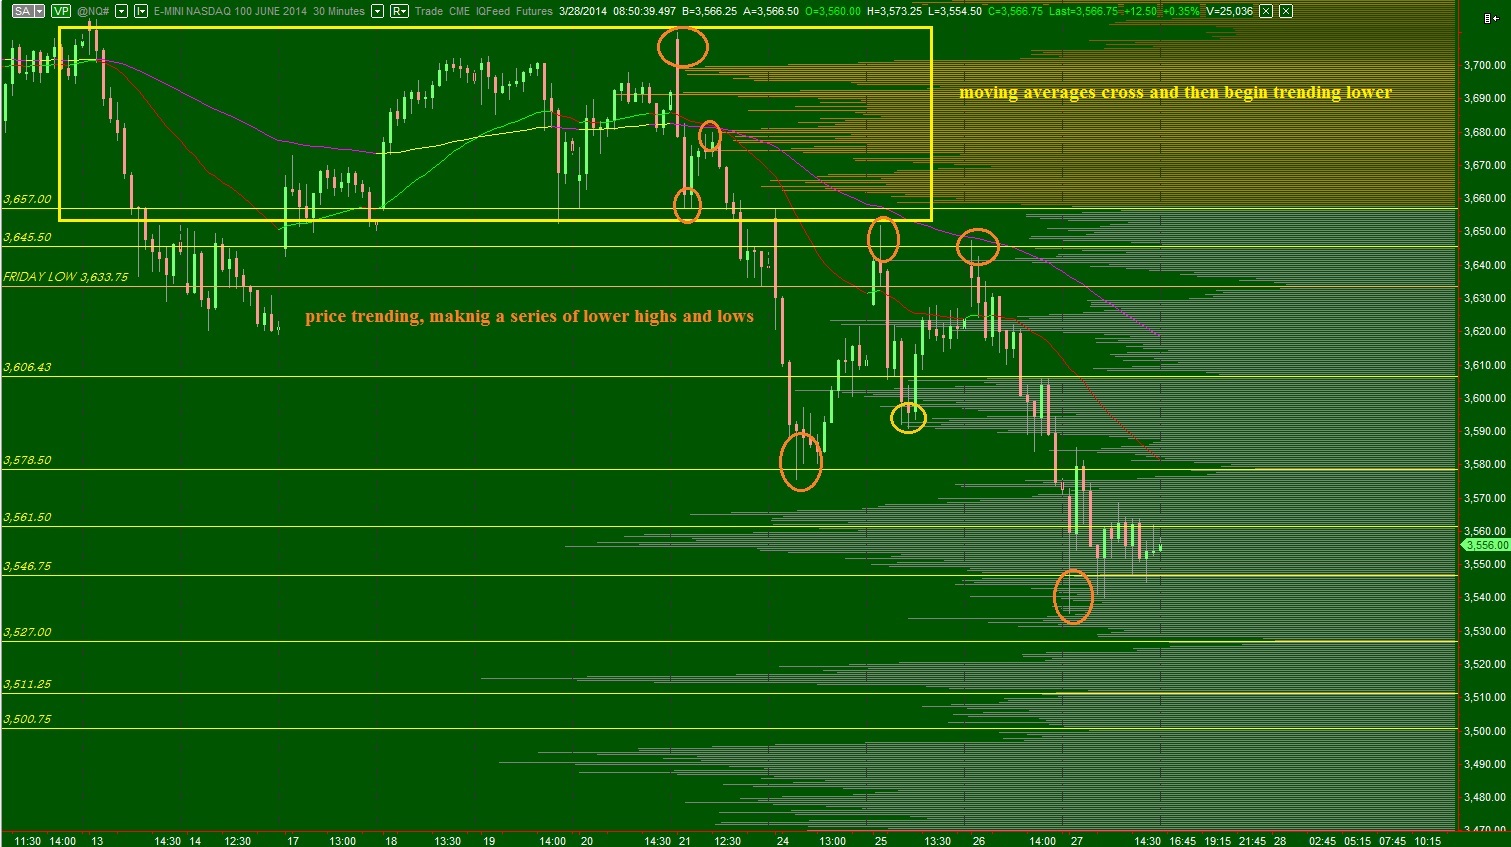
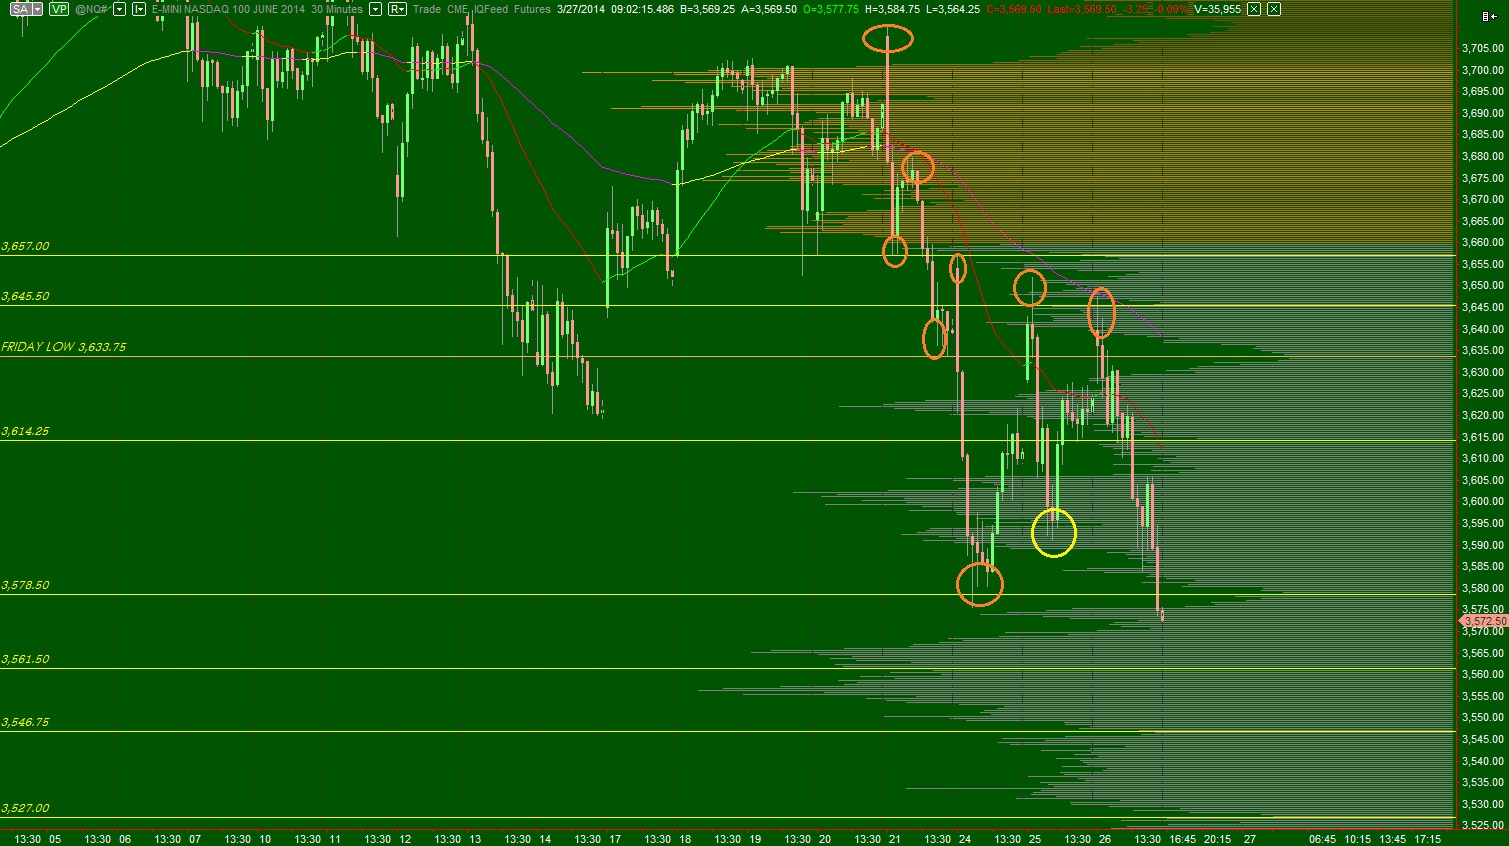
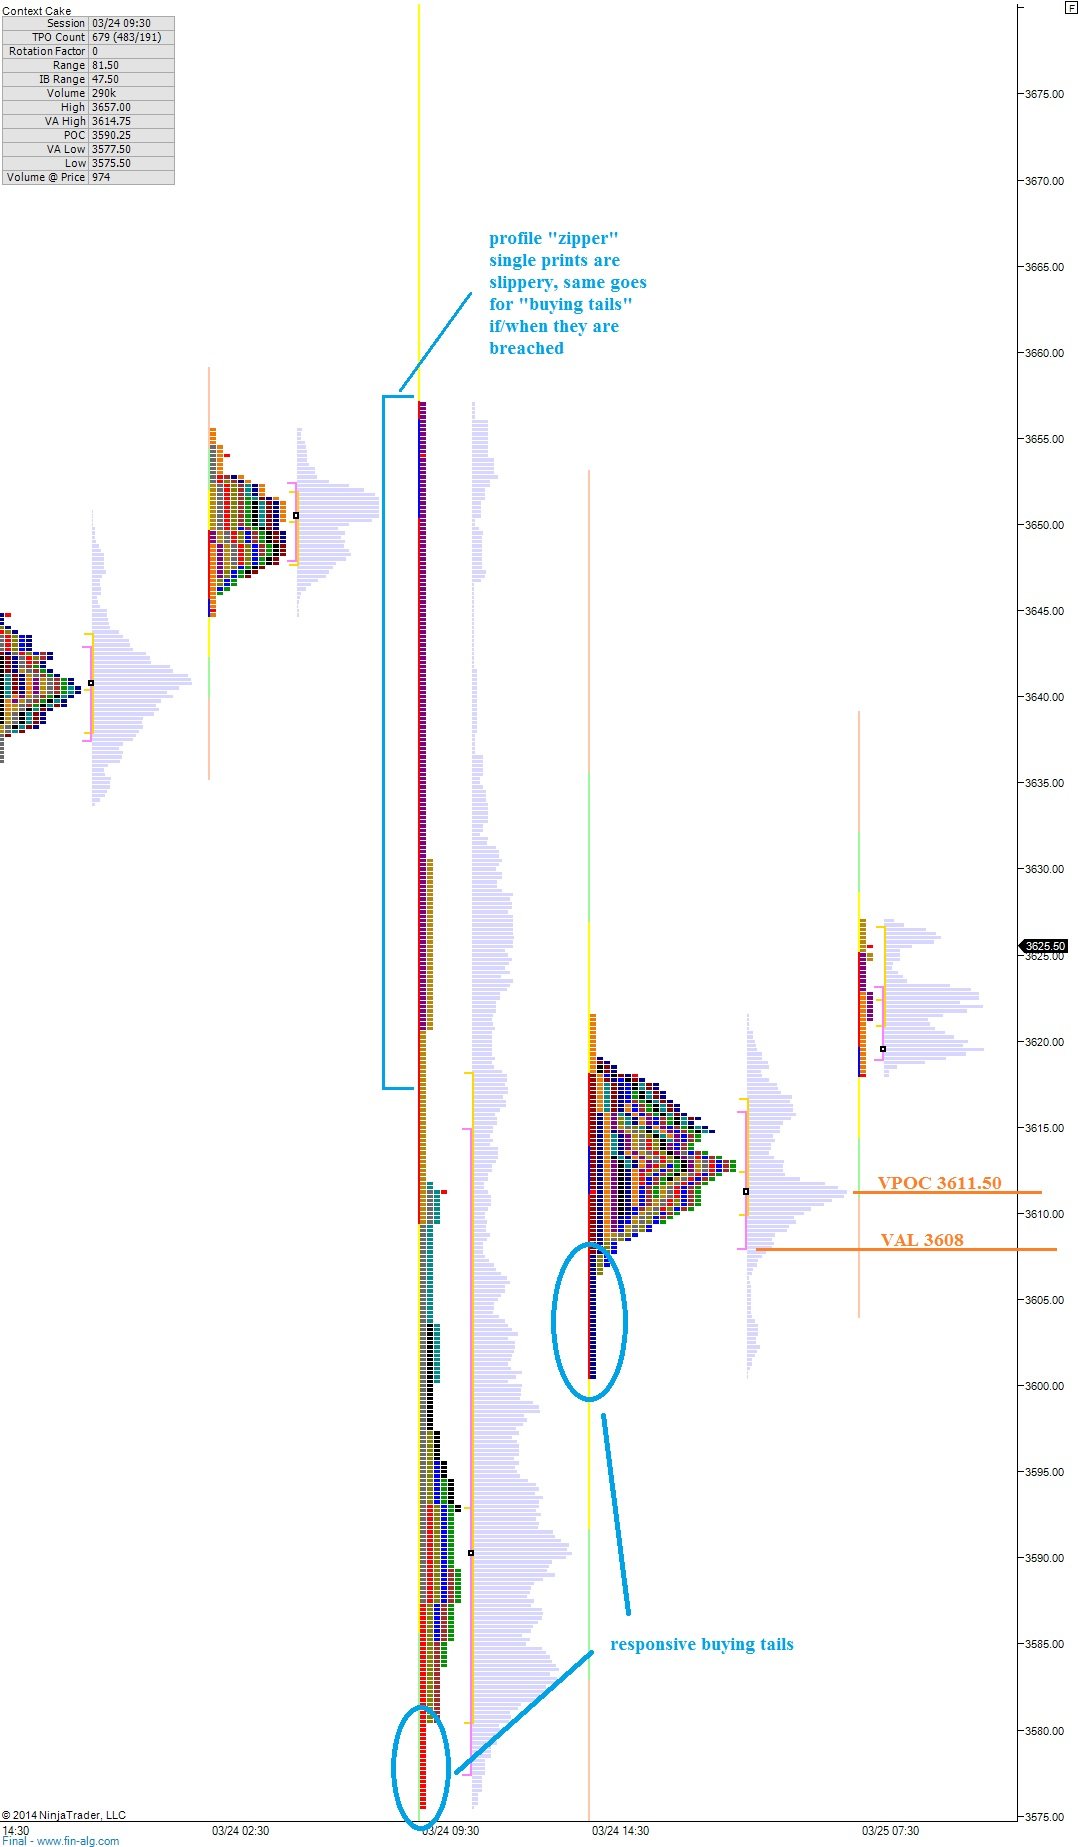
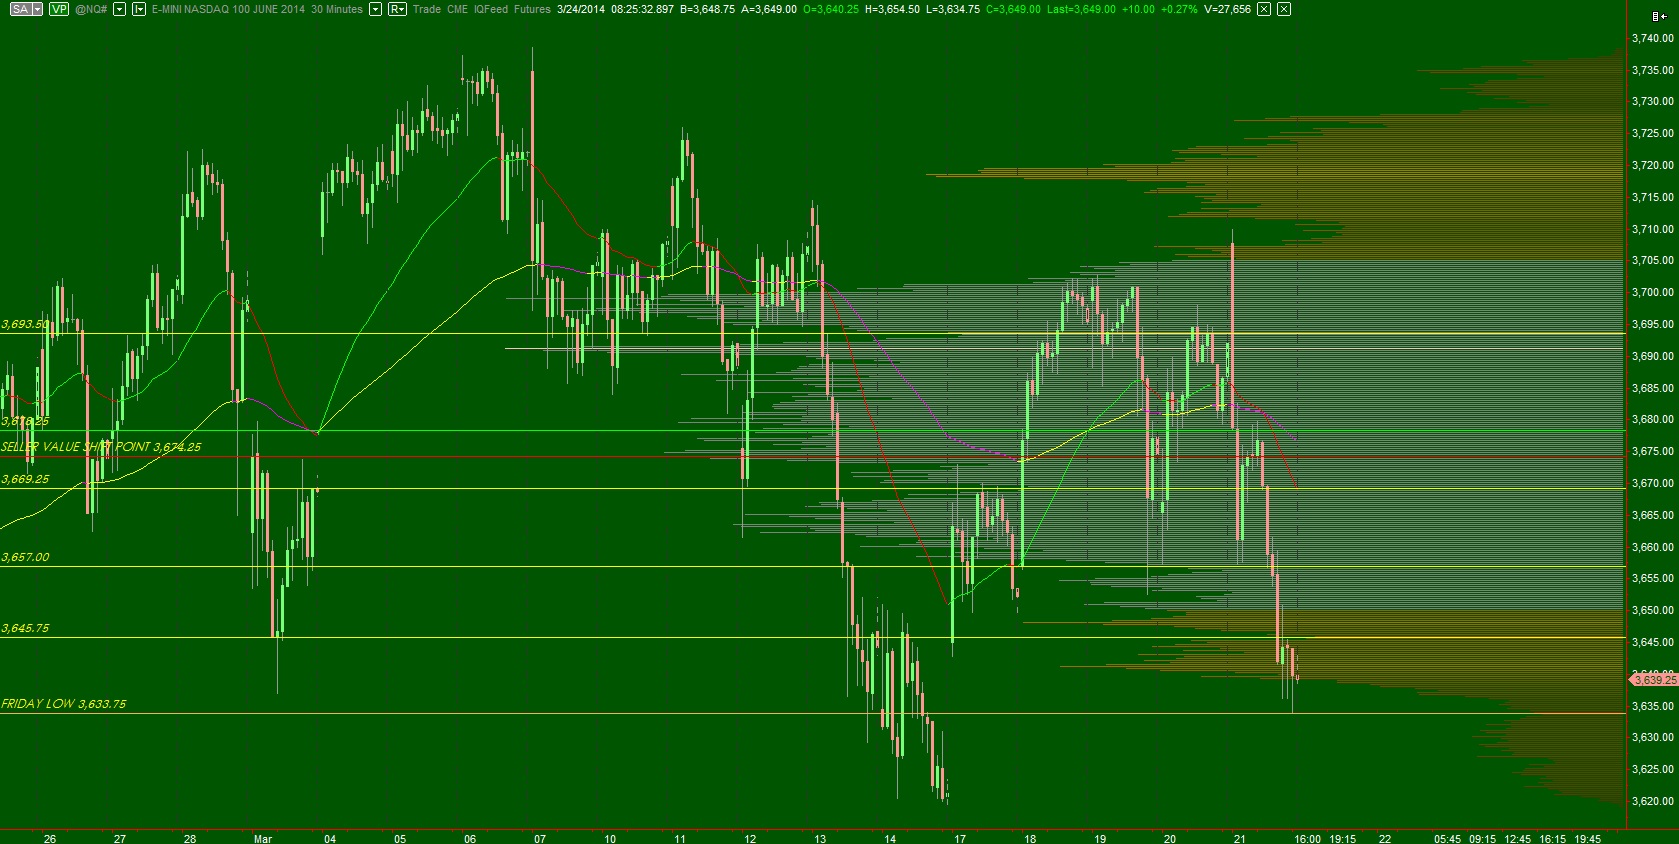
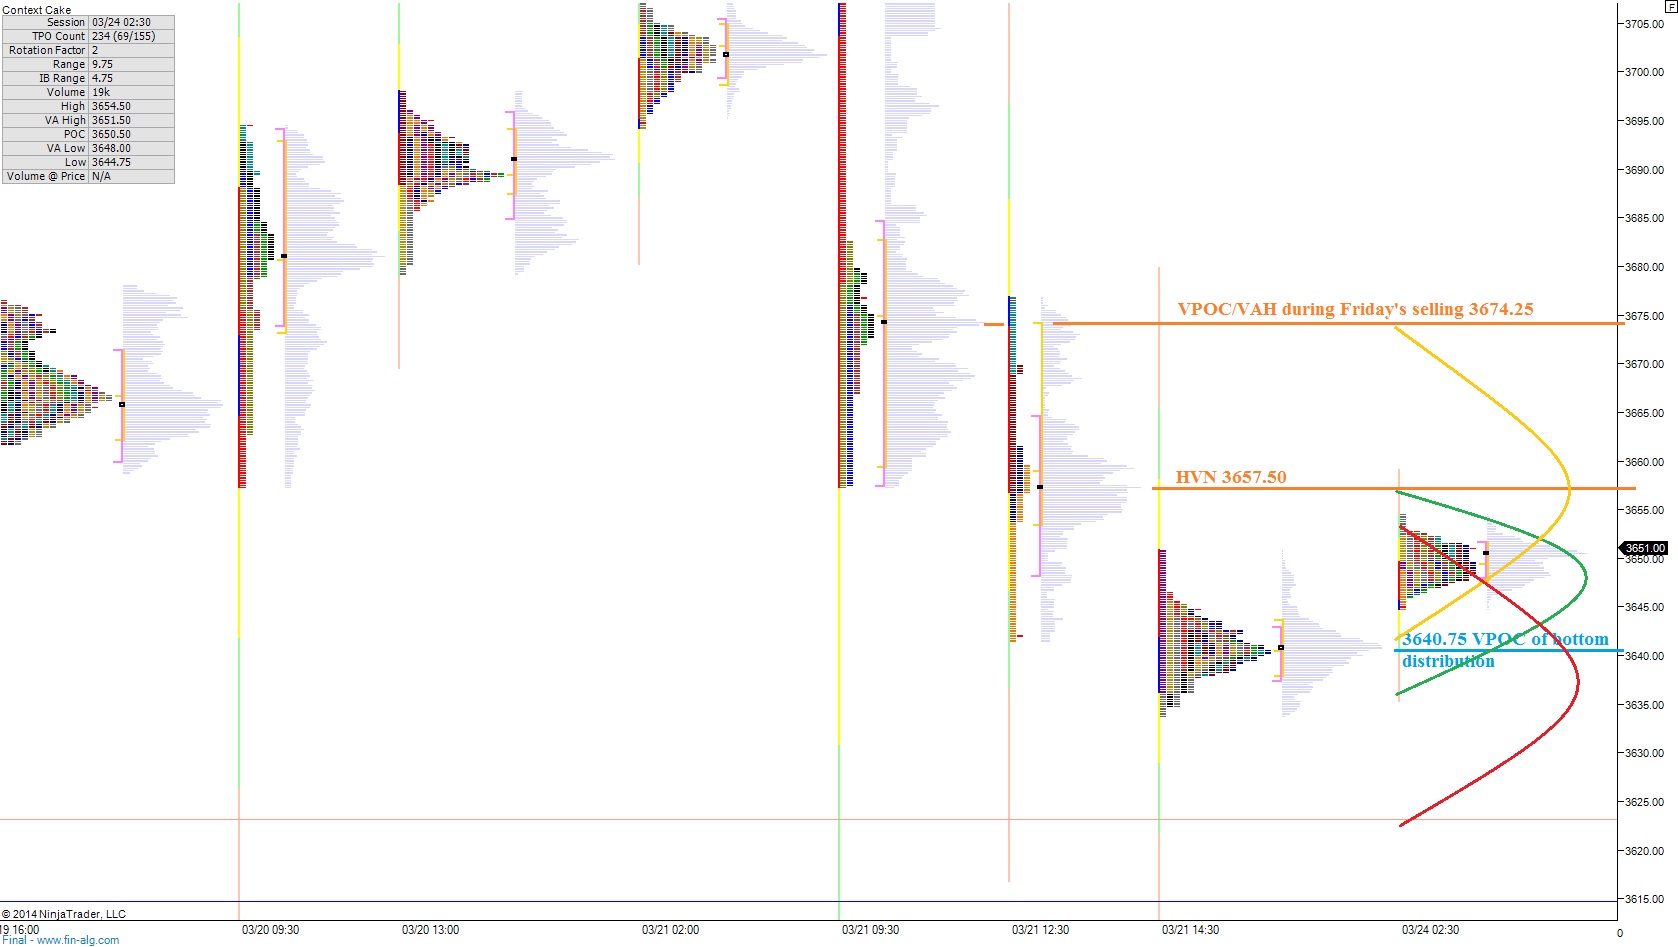
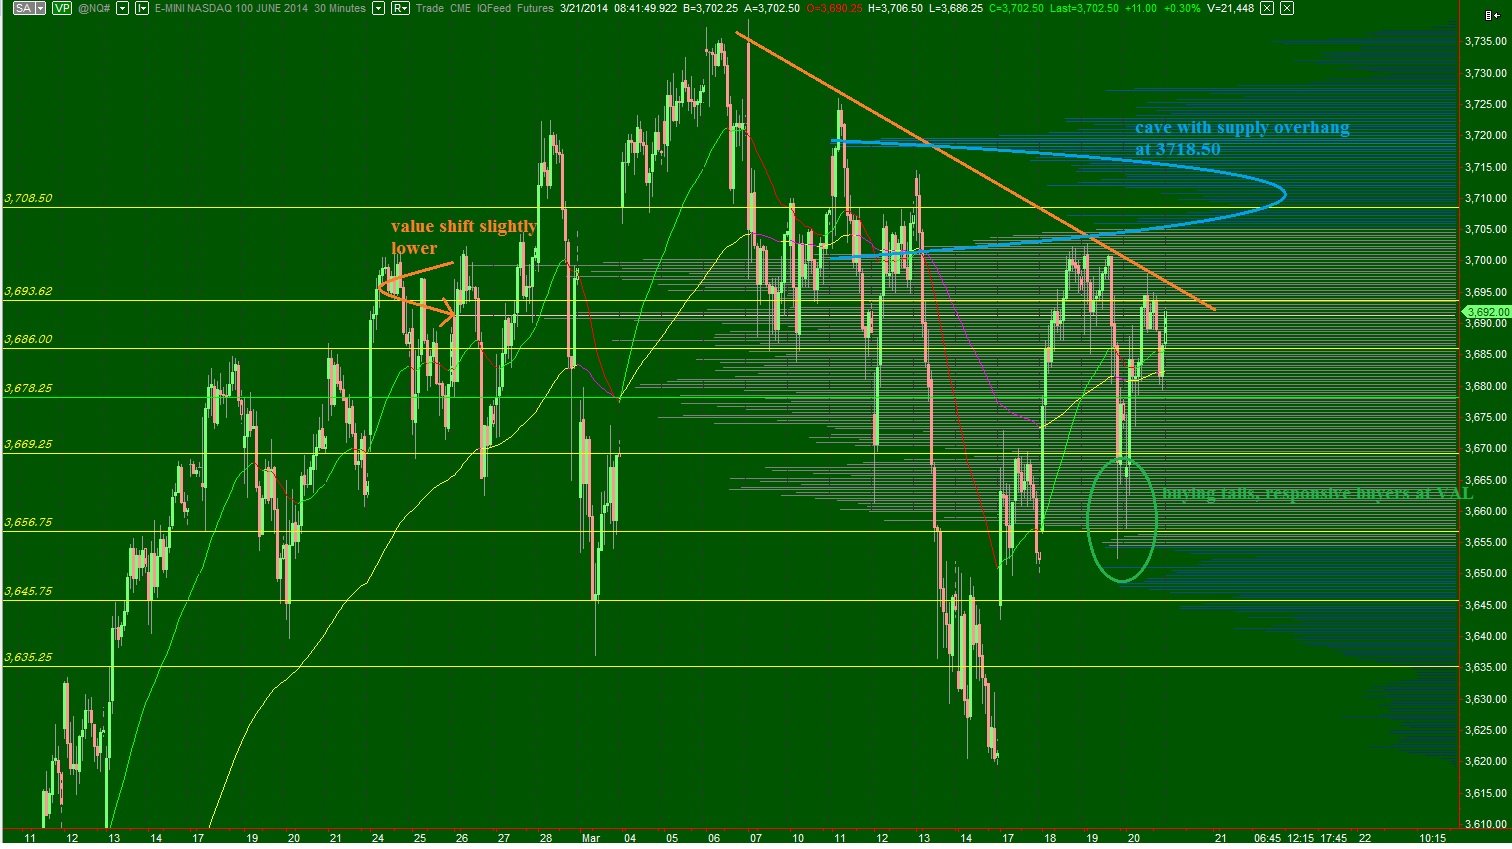
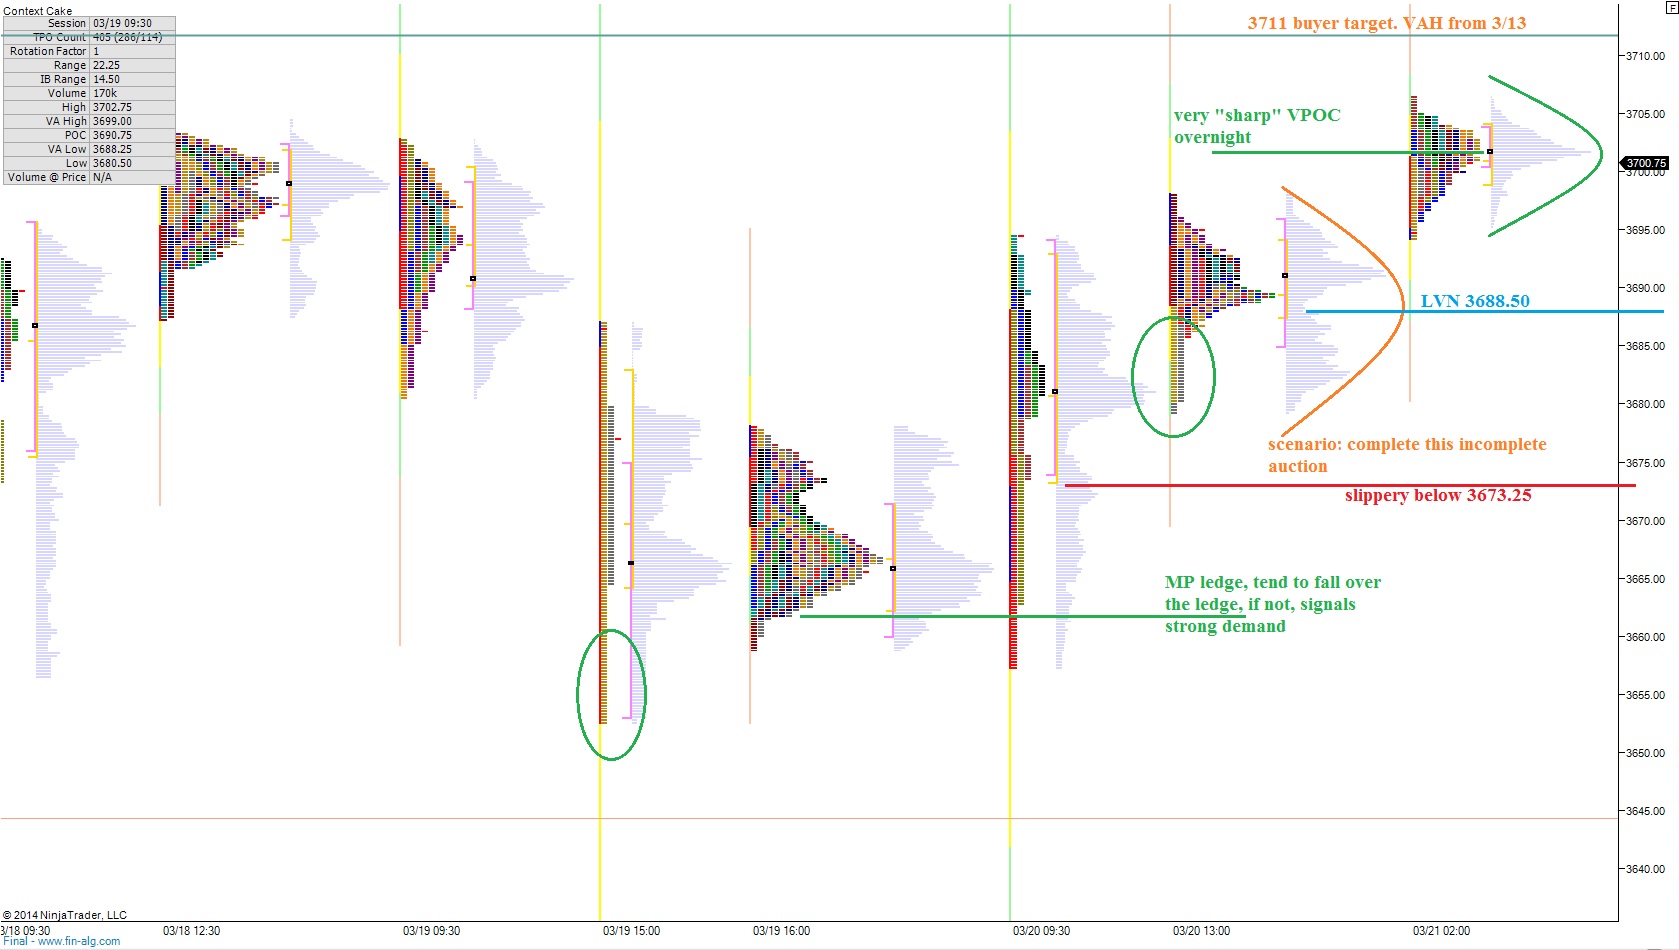
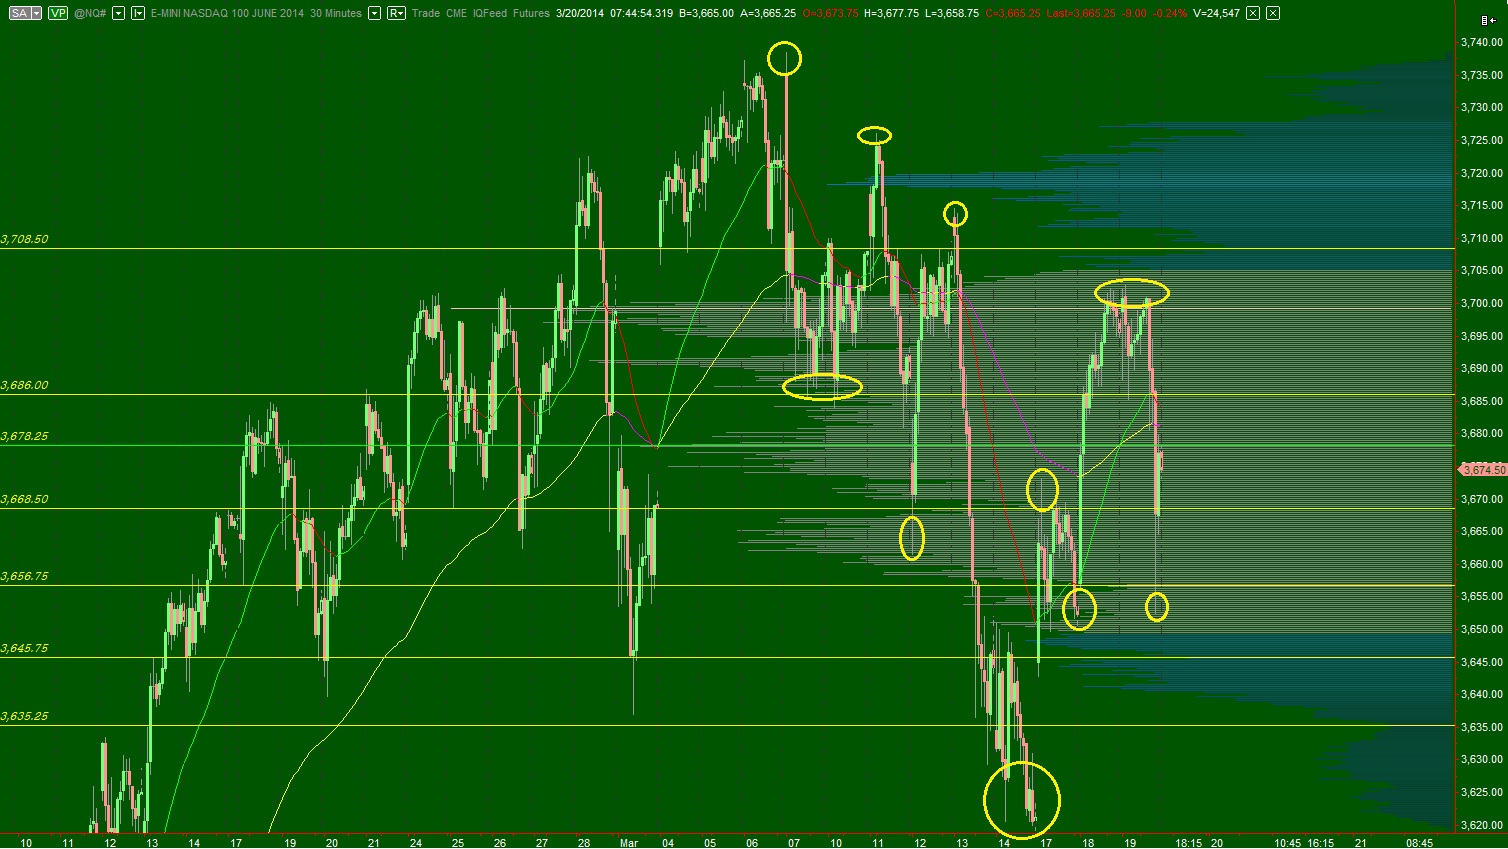
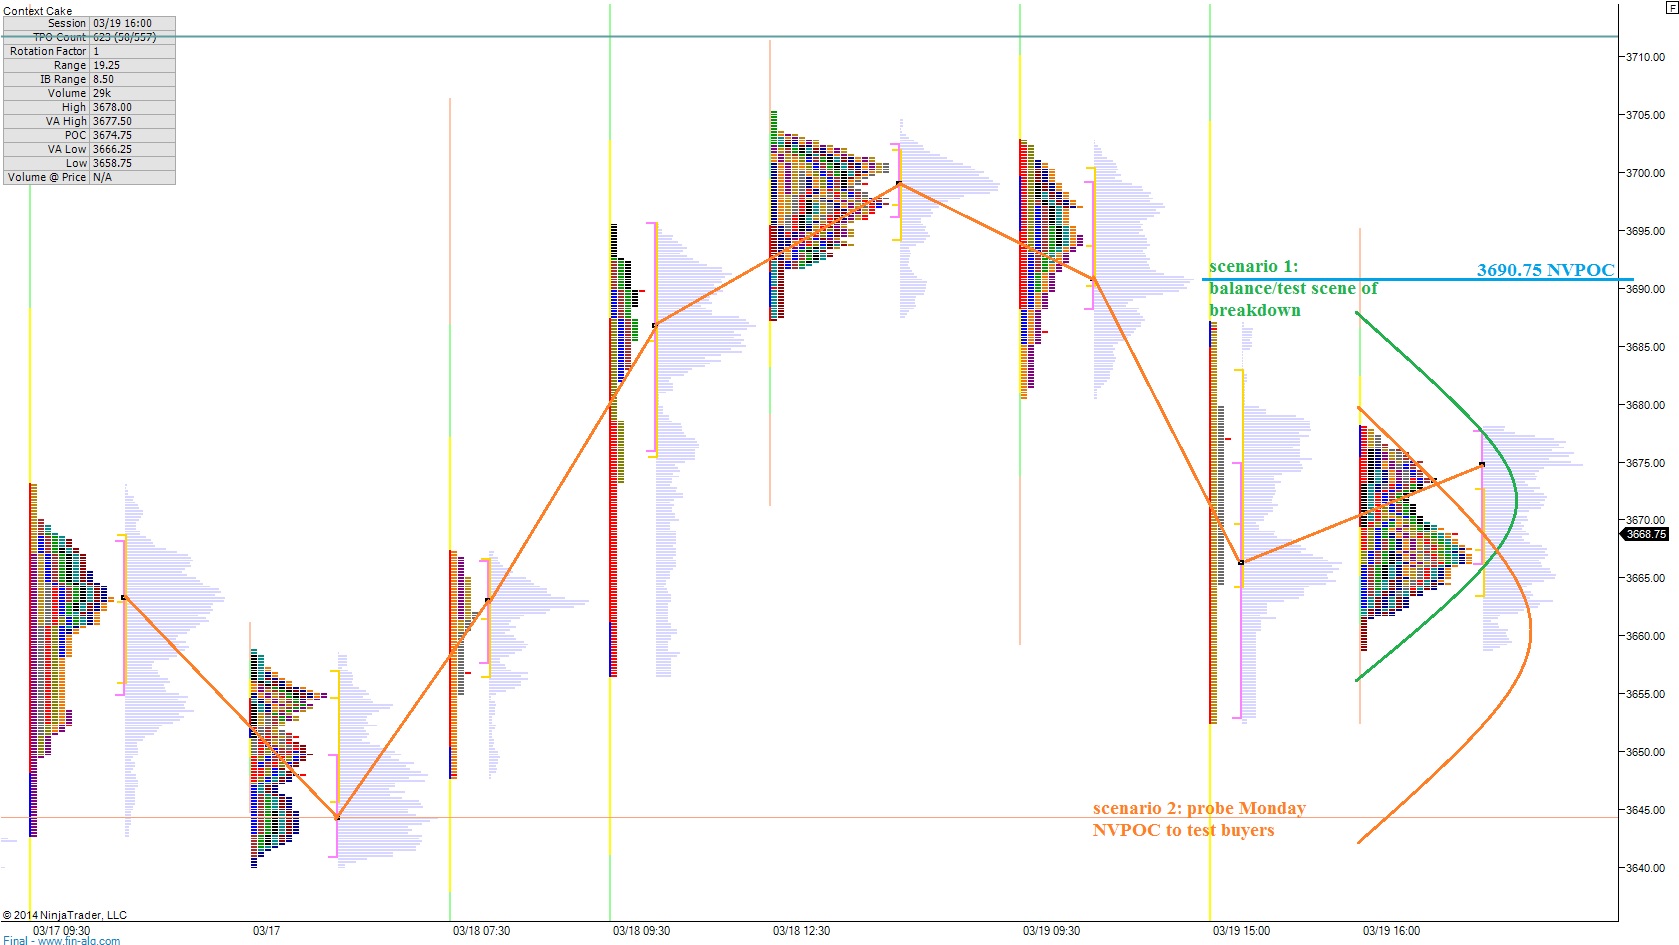
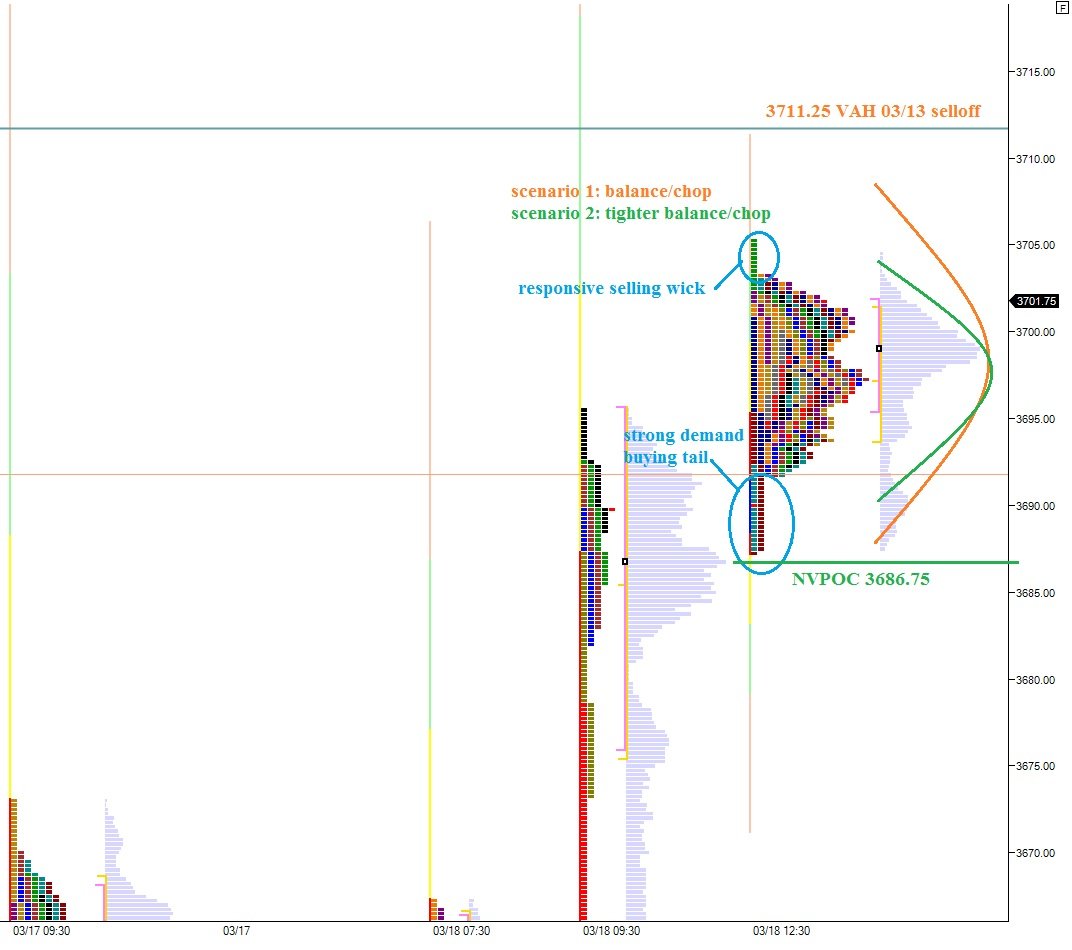
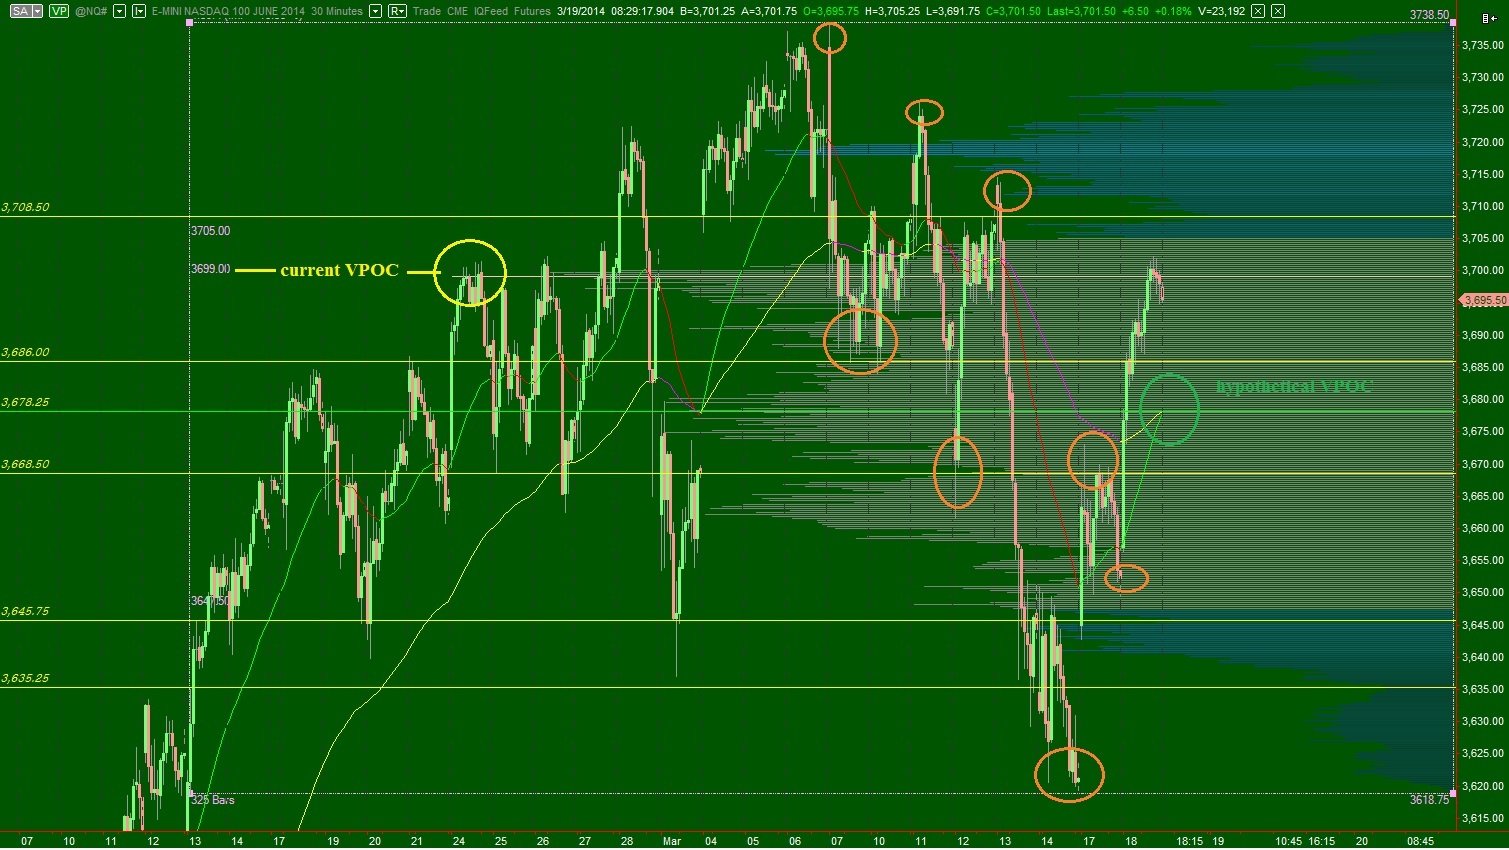
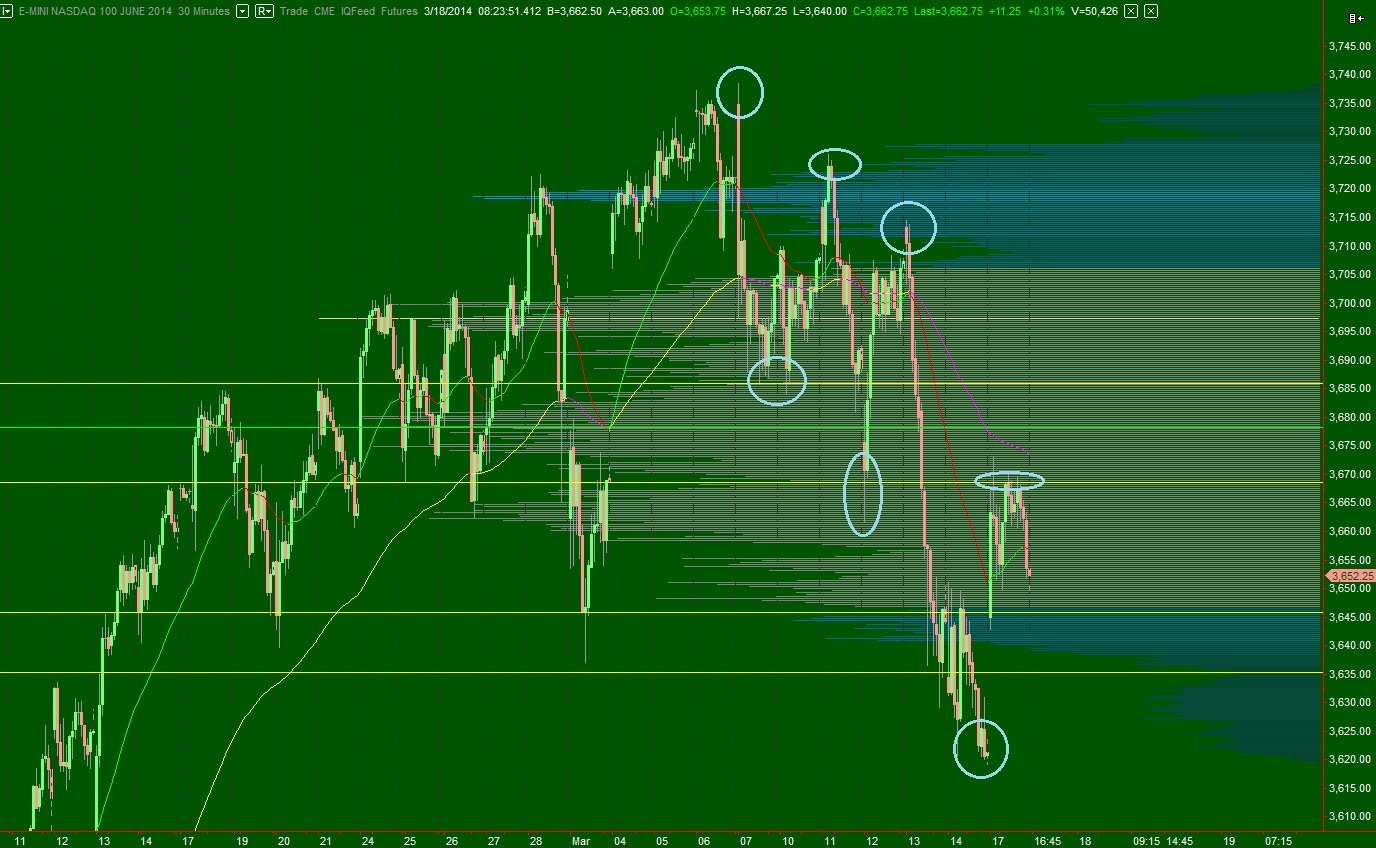
Most of my notes this week are embedded in the images, so click through them to see some very interesting market activity in and around the opening swing. There were some fantastic tradable opportunities this week. As always, do not hesitate to discuss these strategies and share any inputs you may have.
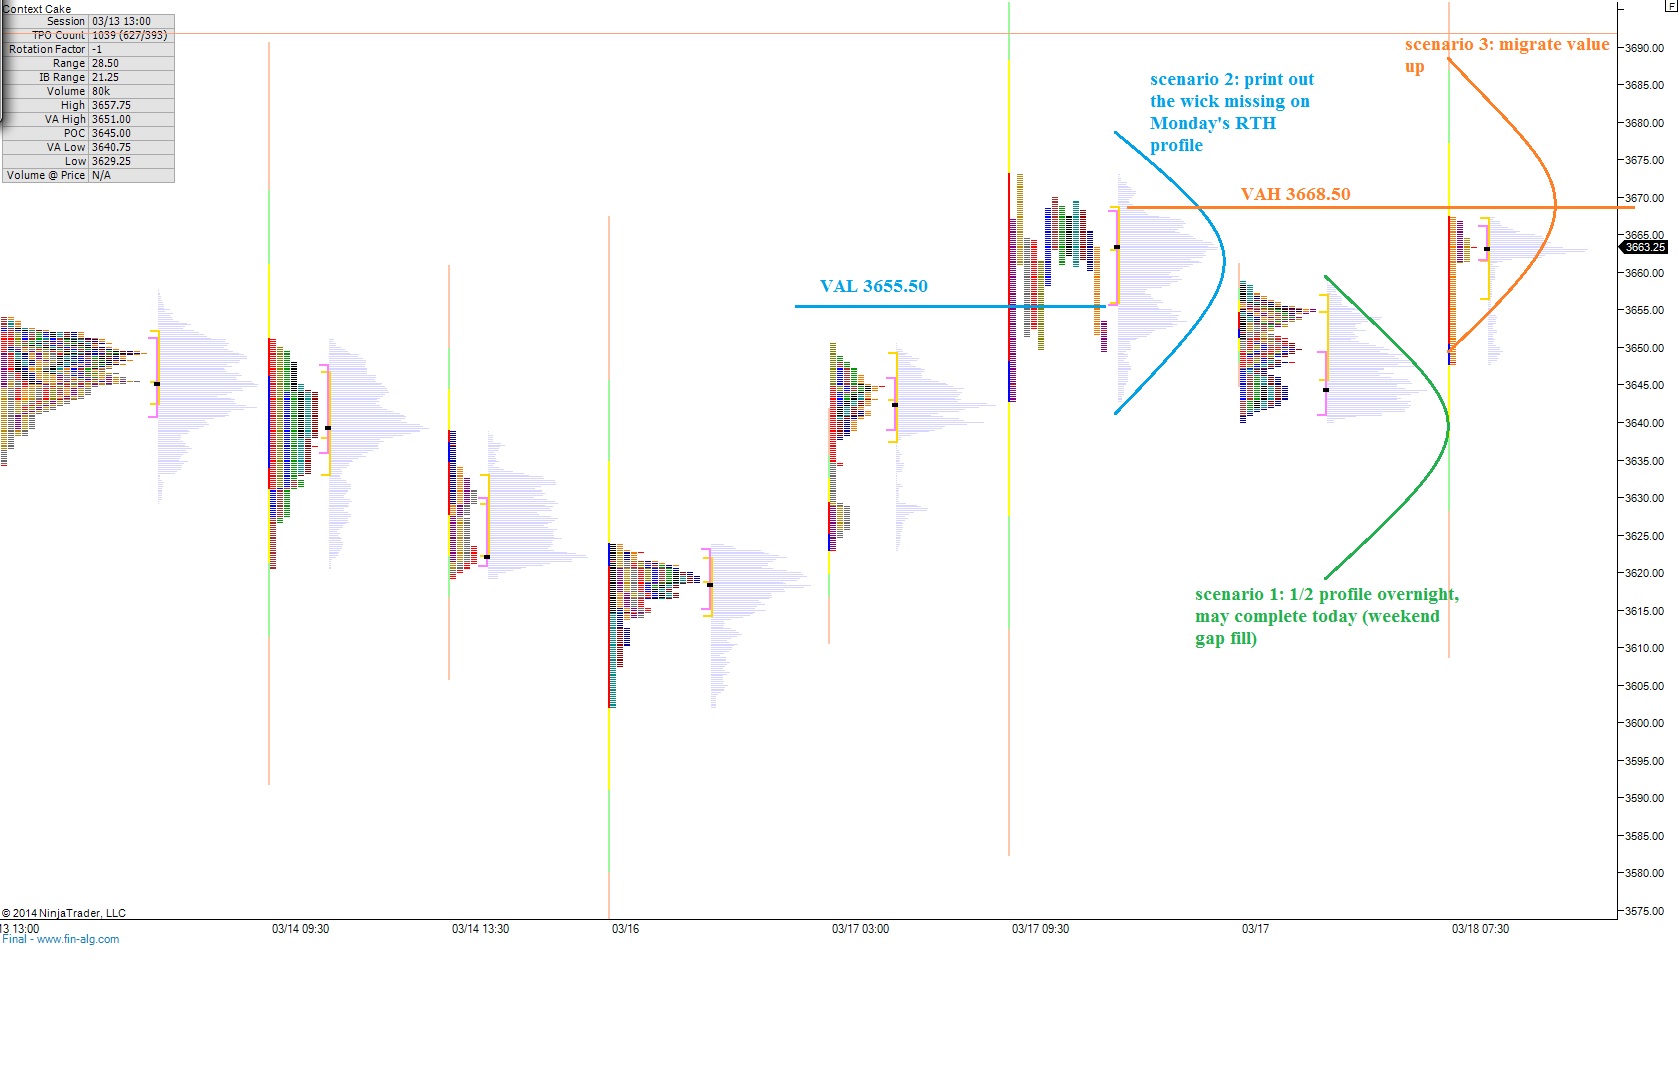
For additional insight into the overall context from each day you can review my morning context reports.
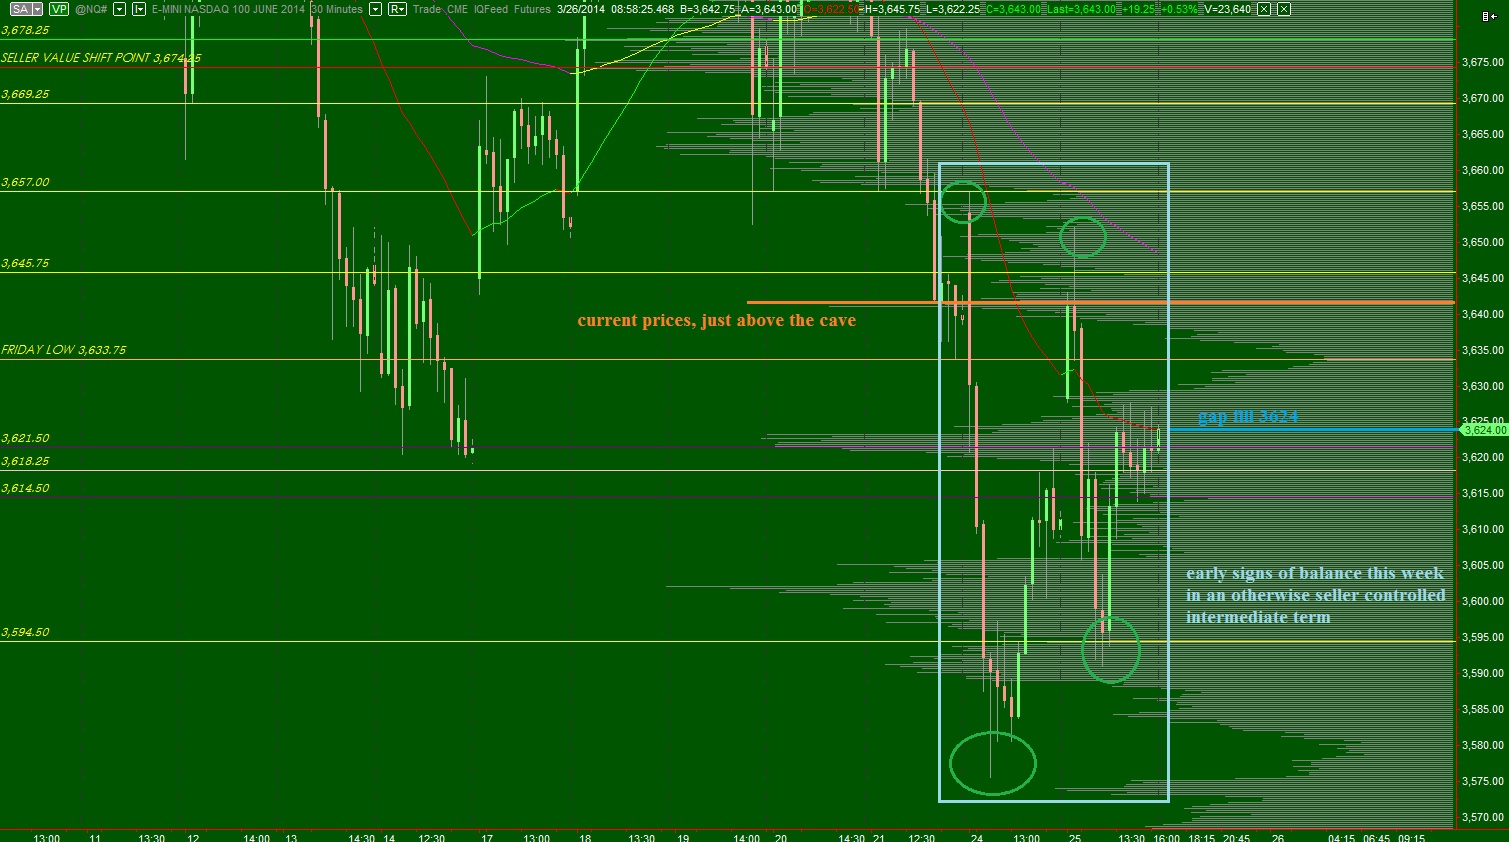
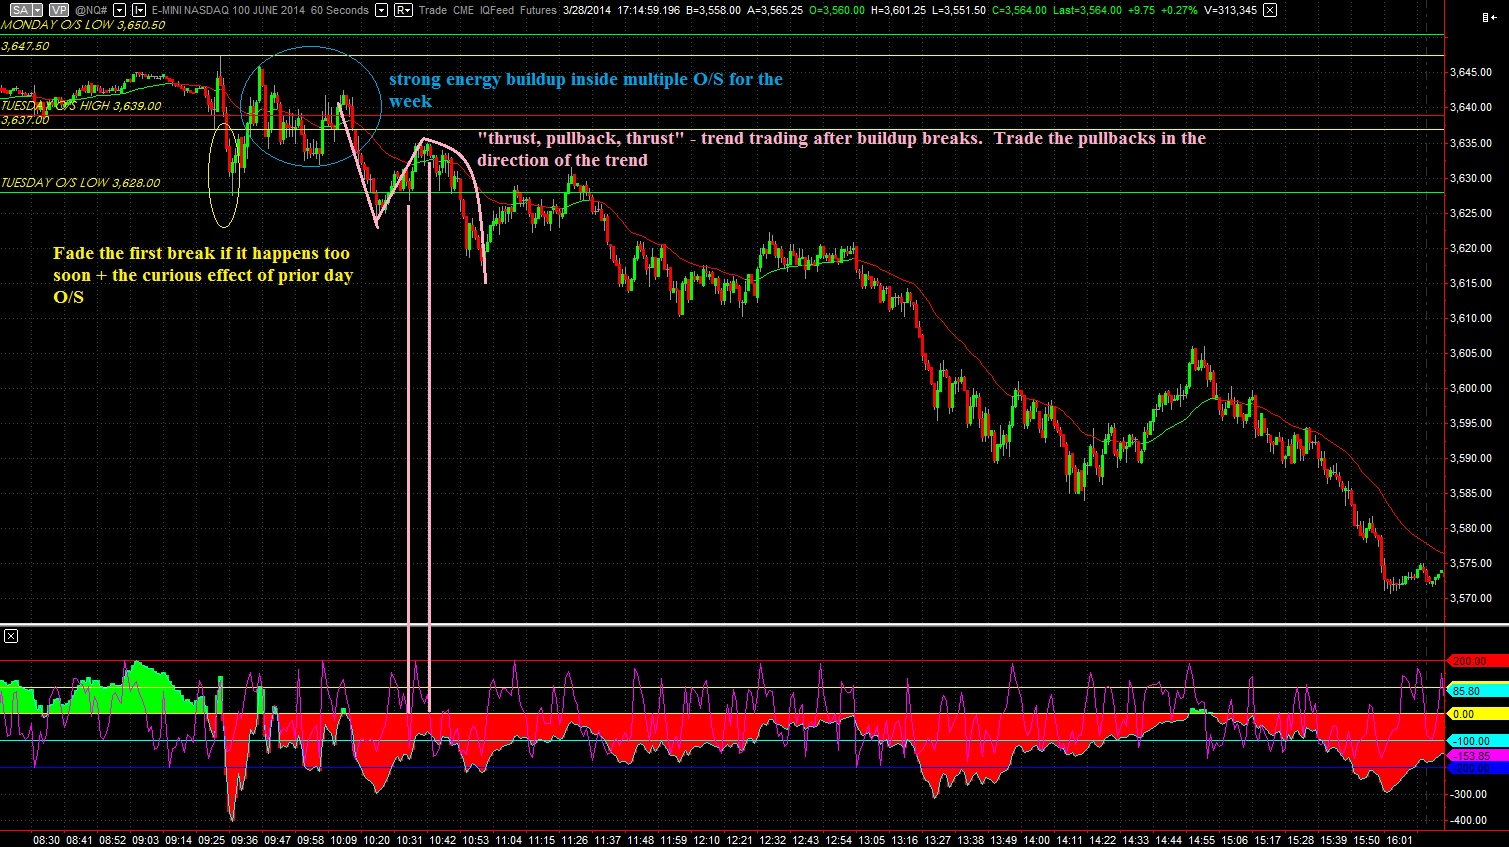
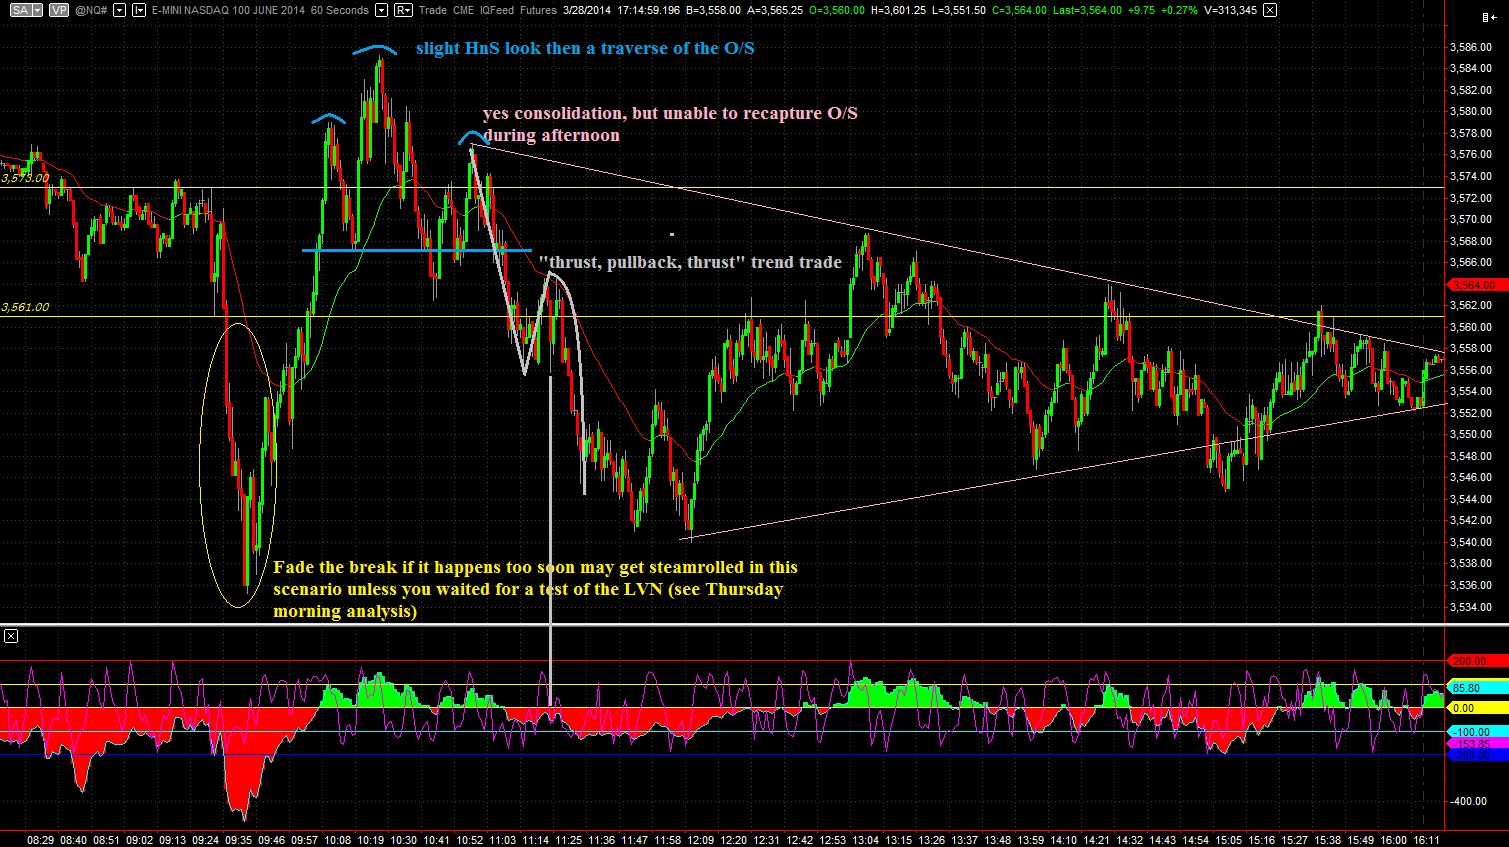
MONDAY:
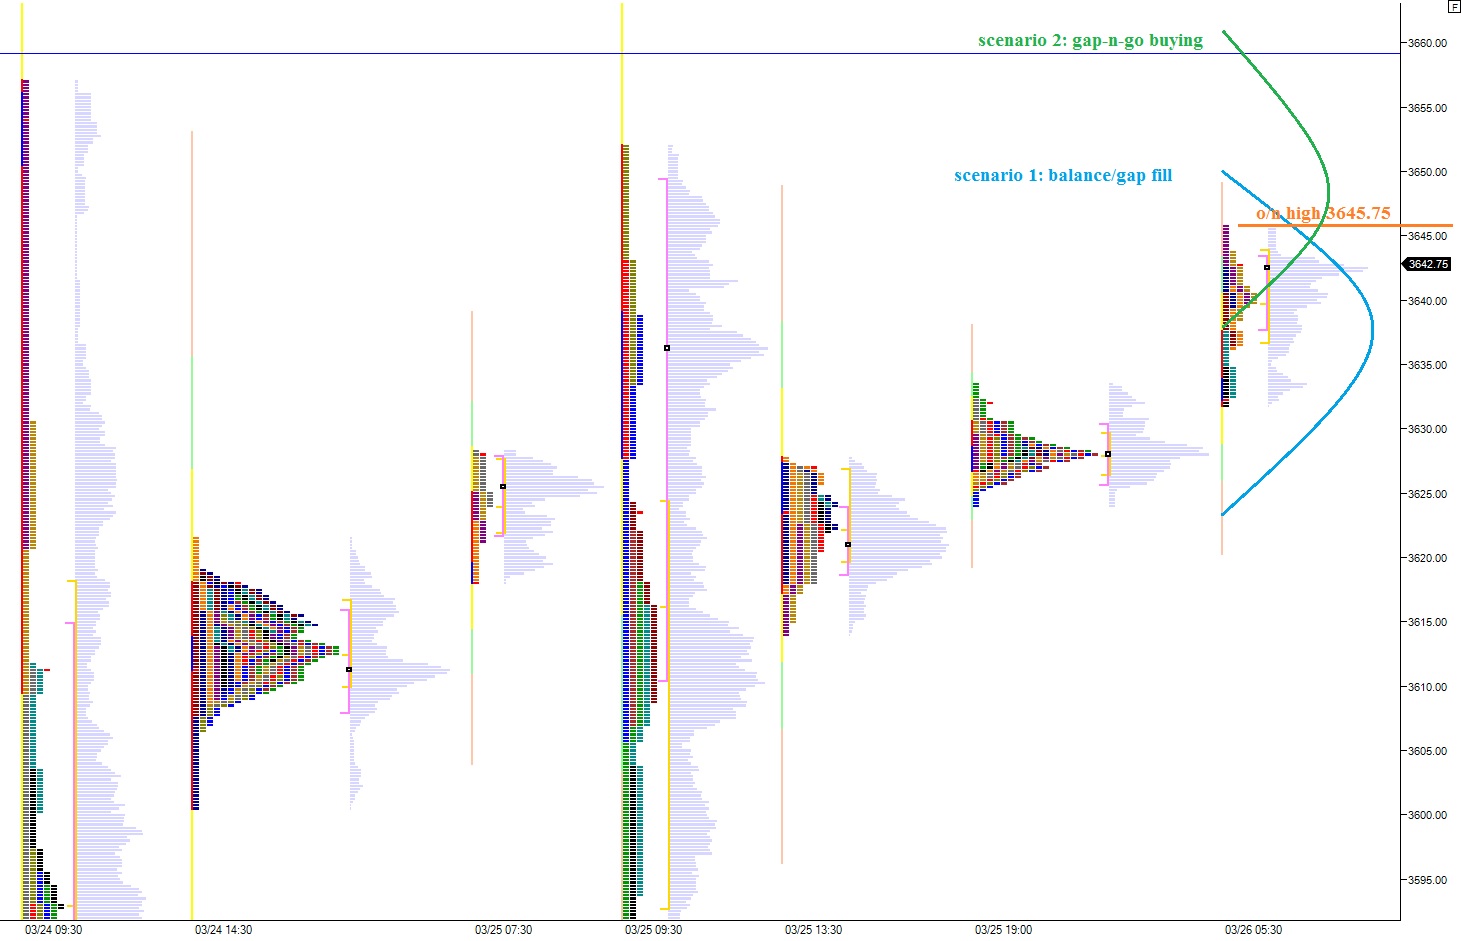
TUESDAY:

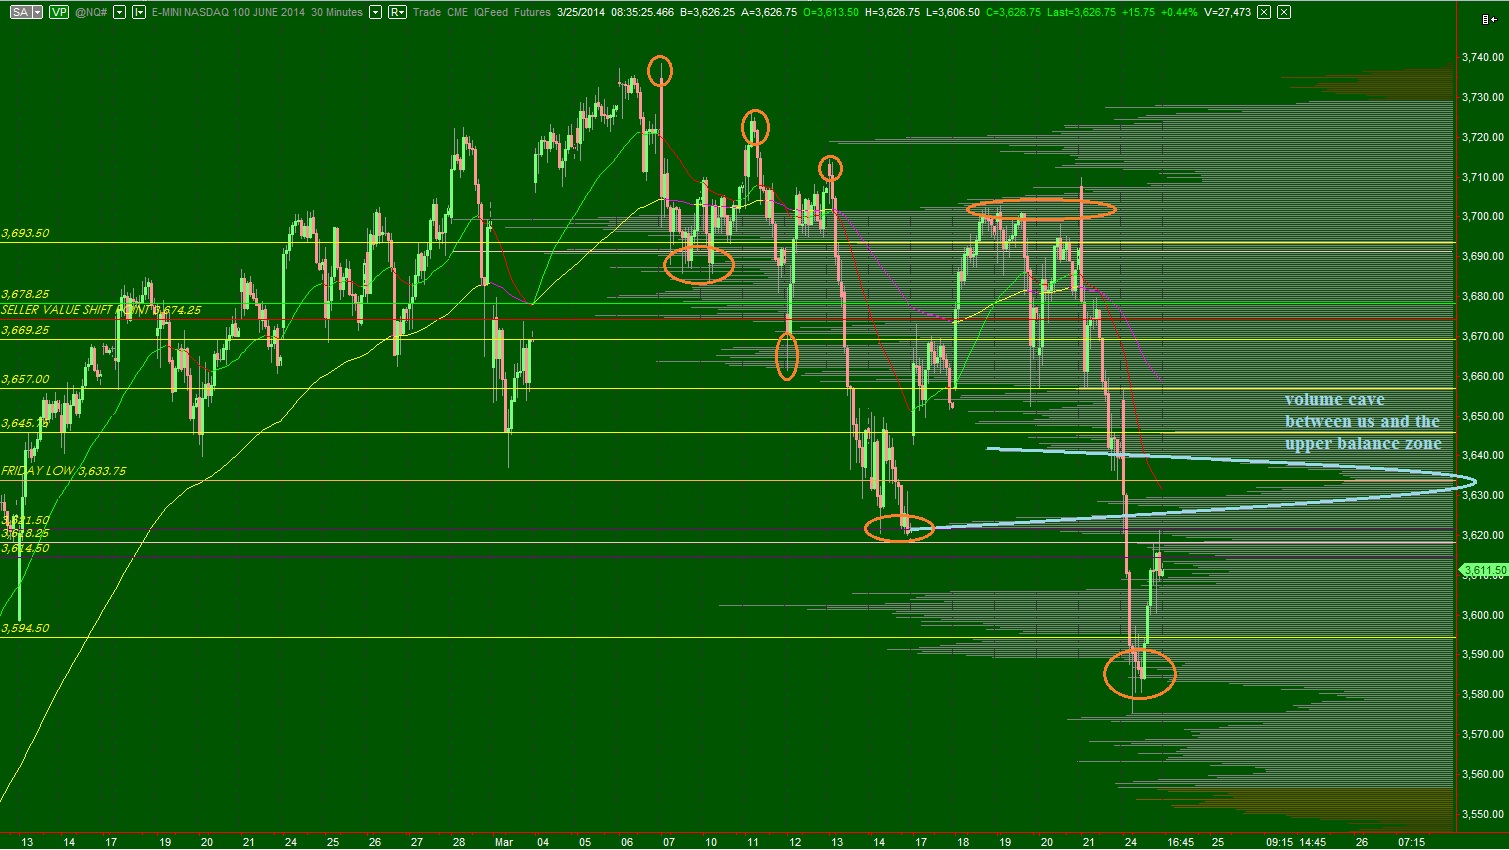
WEDNESDAY:
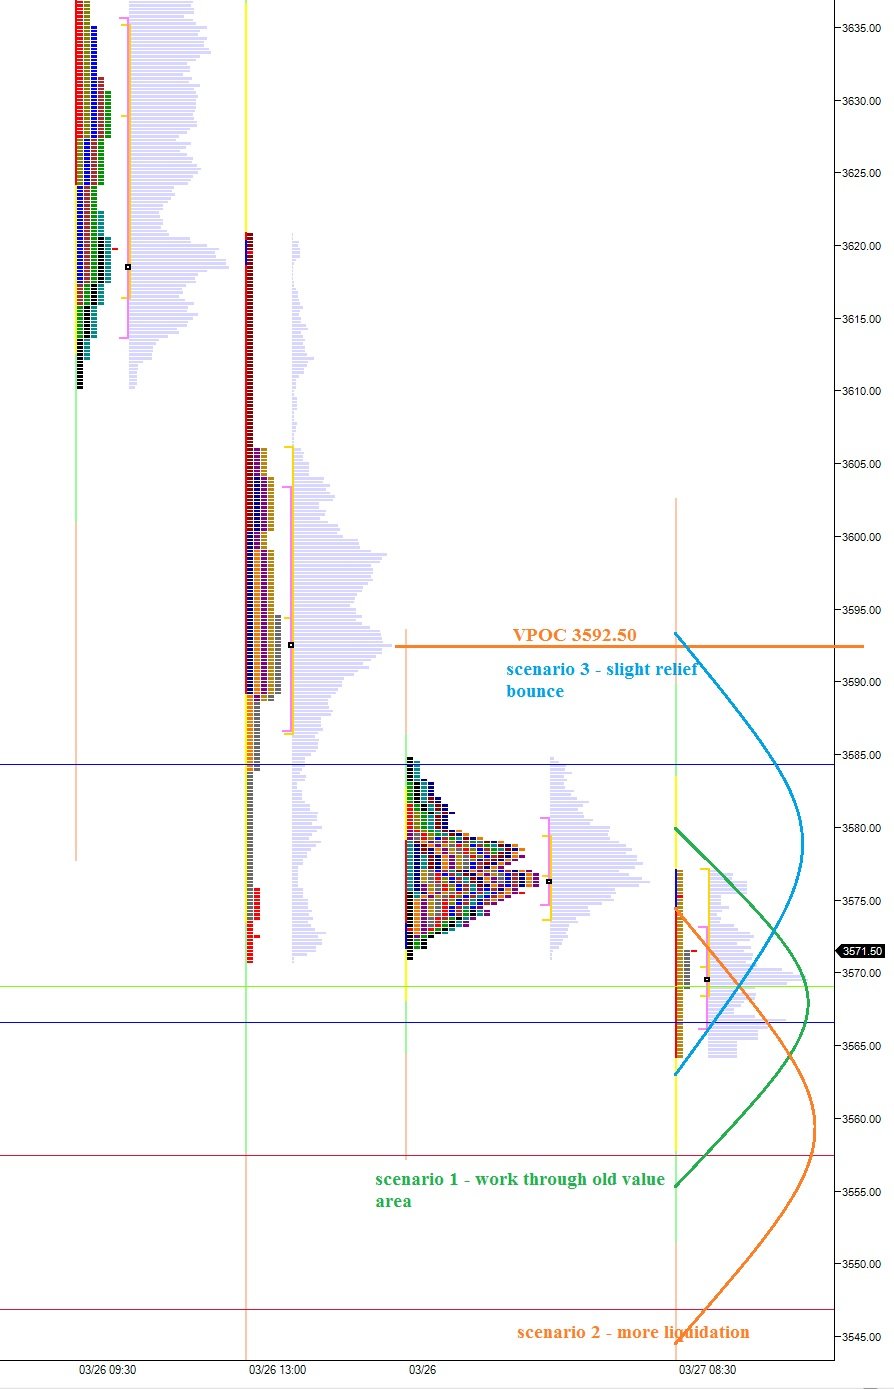
THURSDAY:
FRIDAY:

Comments »