iBankCoin
Home / Tag Archives: $NQ_F (page 23)

Tag Archives: $NQ_F

Expect Very Little Before Brunch

This morning we have Nasdaq futures up a bit, just over 5 handles, but until we hear from the dovish Yellen at 10 am it is likely the markets just chop around.  We are currently priced to open inside yesterday’s value which suggests little-to-nothing occurred overnight to change the perceived value of the index.

The intermediate term is in near-perfect balance.  As exciting as that may sound, it means an increased risk of long liquidation exists.  We likely need another 10 points of Nasdaq progress atop our current swing high before price can escape the gravitational forces of mean revision.  See below:

07152014_IntTerm_NQ

Elevating the likelihood of a mean revision even more is the 11.25 point gap we printed yesterday morning.  If buyers cannot defend their initiating drive tail (pictured below) today, then we could be in store for a quick gap fill which could very well set the tone for a complete mean revision trade.  This is only one scenario, of course, as sustaining trade above the initiating drive tail could be the catalyst to launch a new value discovery phase up.  Remember, there is still a 14-year-old open gap above, an artifact from the dot com bubble.  I have highlighted this driving tail, as well as a few other price levels on the following market profile chart:

07152014_marketprofile_NQ

Comments »

Pressing Boundaries

We started out last Thursday with a 50 point gap down.  The move was partially attributed to questions of insolvency at Espirito Santo, one of Europe’s largest banks which is located in Portugal.  This morning we wake to see Euro-Zone stimulus announced by “Super” Mario Draghi, one trillion.  Central banks continue to be the primary driver of market prices, and we are waking up to nearly 20 points of upside in the Nasdaq futures.

Price stalled out overnight after taking out prior swing high by one tick.  The 1-tick is sometimes the preclusion to a failed auction.  However swing highs and lows are rarely made outside of the cash session.

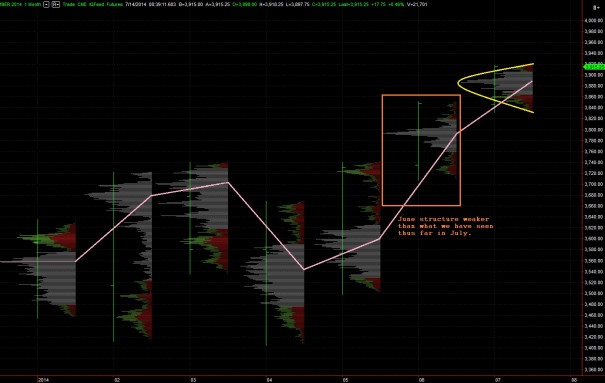
The monthly volume profile chart shows us forming a high quality distribution up here at the highs.  This suggests market acceptance of these prices and is a positive as we go forward.  Whether we go higher today from here or retrace a bit first, seeing this type of distribution form tells us a sharp rejection of these prices has not occurred:

07142014_Monthly_NQ

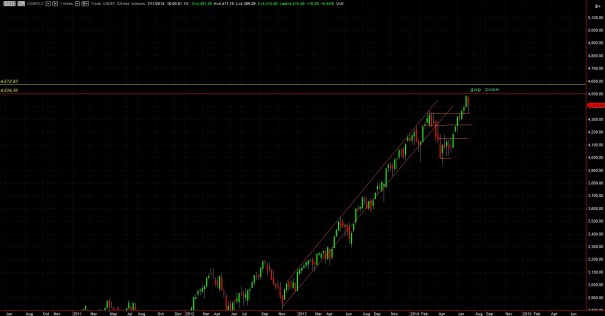
On a weekly chart of the Nasdaq, we can see a responsive bid coming in last week (seen as a long tail on the red candle).  There was an uptick in volatility yet buyers continue asserting a control on the long term, see below:

07142014_Weekly_NQ
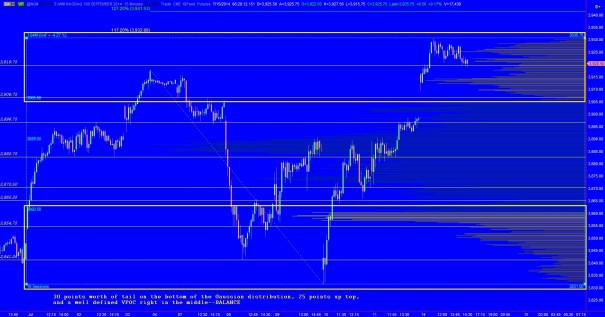
The auction can be seen best on the intermediate term.  The last nine sessions have done a wonderful, albeit fast, job of establishing a low bid and then beginning the process of auctioning higher in search of an upper boundary.  The net action has produced balance for the month of July.  We are coming into today’s session much like last Thrusday, only with the gap pressing us up against the high of intermediate term balance.  We do not have quality markers above for assessing whether we are leaving intermediate term balance.  Instead I will look for sustained trade above our current swing high at 3918 and a measured move higher without sharp responsive selling.  I have highlighted the measured move targets below, as well as the nearest low volume nodes for assessing any selling back into the intermediate term range:

07142014_IntTerm_NQ

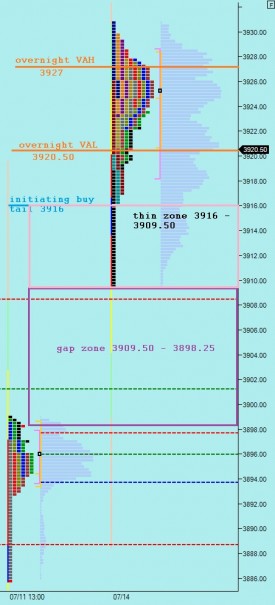
Finally, here is a snapshot of the market profile heading into the week.  I have noted the price levels of interest as well as a few other observations below:

07142014_marketprofile_NQ

Comments »

Discovering Balance

Nasdaq futures are up a touch after ceding some of their gains as we approach cash open.  There were no major economic releases this morning aside from Canadian unemployment data with the main items on the US docket being Fed’s Charles Plosser speaking at 11:15am and Charles Evans at 2pm.  We also receive the Treasury Budget at 2pm.

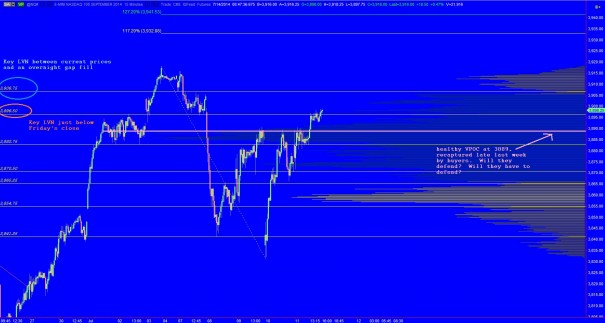
The intermediate term held onto balance, barely, with the big responsive buying gap fill trade yesterday.  I have highlighted the very significant price levels to monitor as we progress through today and perhaps early next week, the levels that will give insight into who is jockeying for control of the balance:

07112014_IntTerm_NQ

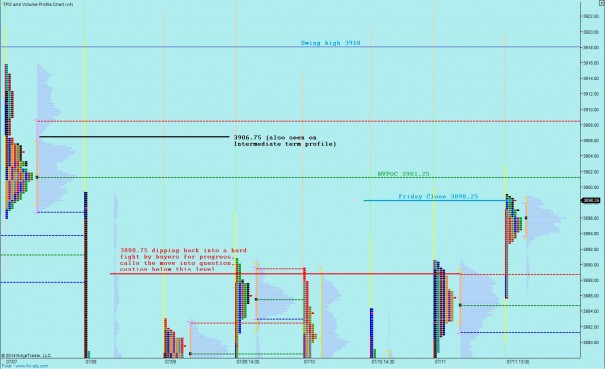
I have walked through the market profile on the following chart to give a sense of what the market has done this week:

07112014_marketprofile_NQ_whathasthemarketdone

What the market is trying to do is find balance on the short term after being jostled out of balance by the big selling early in the week.  The question is where we balance and how it fits into the longer timeframes.  The balancing process is going well.

I have highlighted the key short term levels on the same market profile chart without the descriptions being in the way:

07112014_marketprofile_NQ

Comments »

Pro Gap Territory

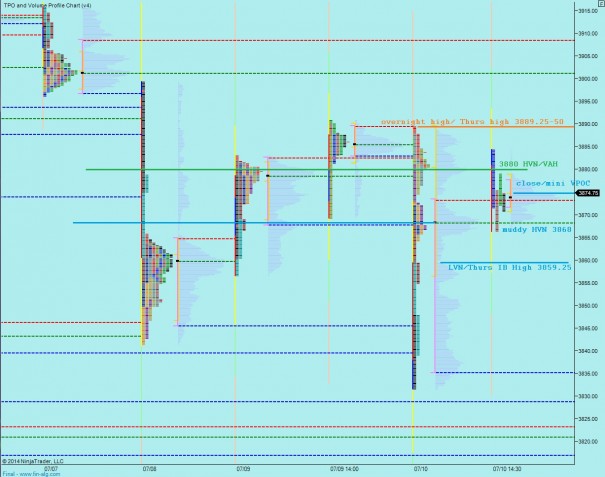
Nasdaq futures are sharply lower overnight on a session of nearly uncontested selling.  Whether or not the affect, there were some troubling numbers from Japan overnight on the economic front.  Year-over-year machine orders were expected to come in at 10.1% but the actual change was -14.3%.  The action really accelerated around the release of UK Trade Balance data which came in worse than expected.  US Jobless Claims data just came in slightly better than expected and we are continuing to see sell flow.

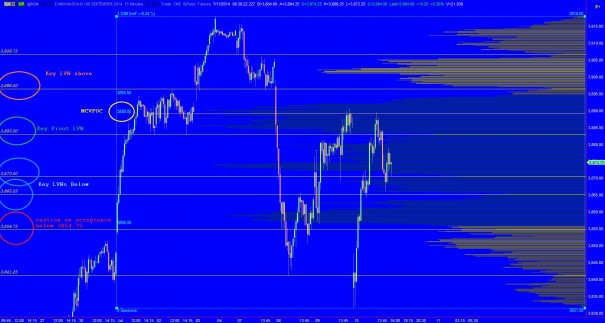
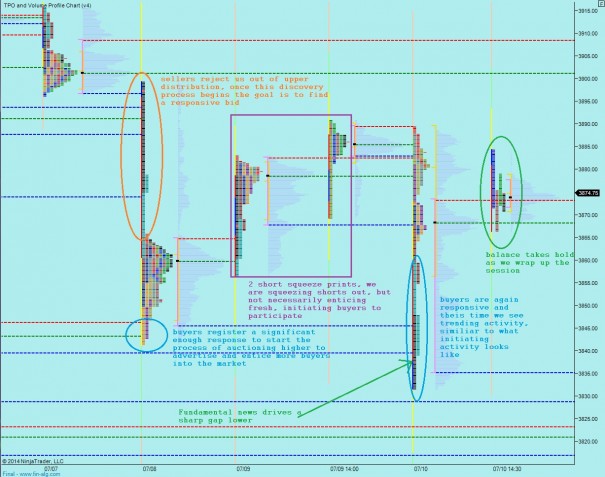
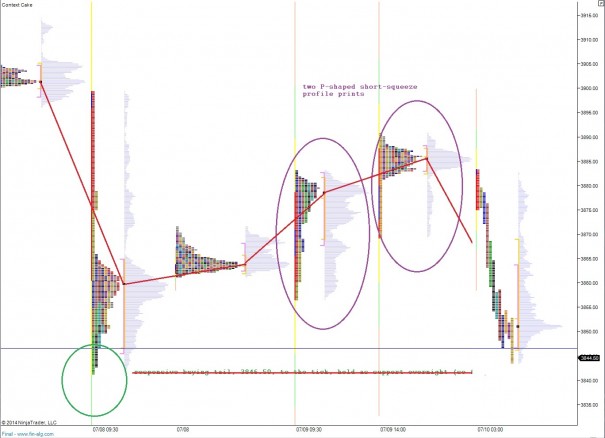
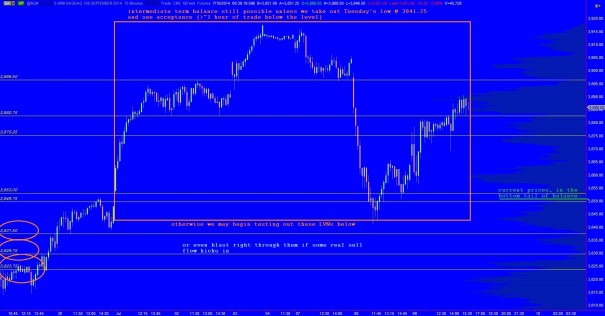
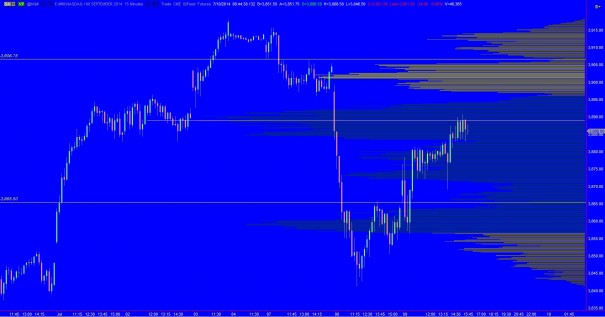
Hindsight is always 20-20, but looking at the profile prints from yesterday (splitting the session at the FOMC minutes) we can see two distinct P-shaped profiles.  These suggest a short term phenomenon was occurring, a phenomenon called the short squeeze.  We have seen these prints mean very little for the short term recently, when they occur in the context of a longer term uptrend, but in the wake of Tuesday’s liquidation they were a clue that the sell trend might continue.  Thus far the responsive buying tail from last Tuesday has held as support.  Whether or not it holds through today will be an early clue as to whether we sustain intermediate term balance or move into a seller controlled environment.  The first chart below is a 24-hour market profile, the second is an intermediate term volume composite, and the third is another intermediate term volume composite drawn over the past 7 days to show the possibility for intermediate term balance:

07102014_marketprofile_NQ_24hr

07102014_IntTerm_NQ

07102014_IntTerm_NQ_7day

I have noted the short term market profile levels I will be observing early in the day on the following market profile chart:

07102014_marketprofile_NQ

Comments »

Fast Open, Slow Through Lunch, Fast Afternoon

The Nasdaq is up about 5 points ahead of the US cash open after a slow grind higher of an overnight session.  The major economic news overnight came from China who released CPI and PPI data both of which came in below expectations.  Here in the USA, we have crude oil and other energy data set for release at 10:30 and then a 2pm FOMC minutes release.

If we open where the market is currently priced, then we may seem some sharp moves off the open because we are in a very thin pocket of volume left behind during yesterday morning’s liquidation.  It will be interesting to see if responsive buyers show up to defend the overnight drift when the cash market opens.

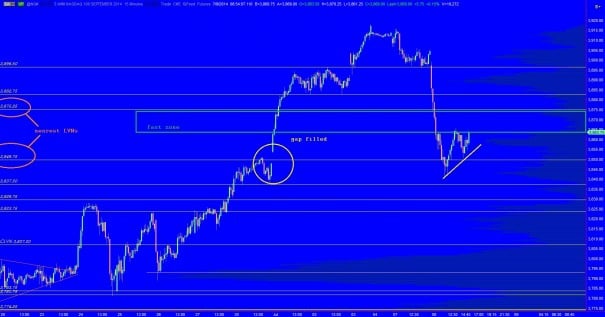
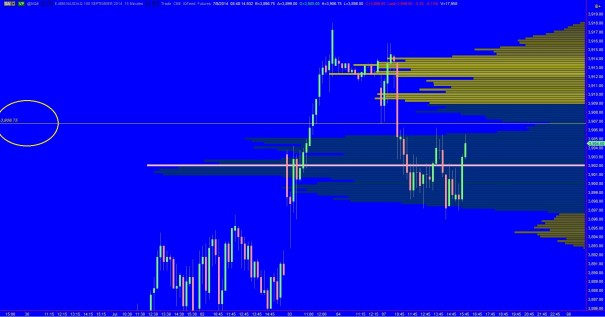
Yesterday the process of establishing balance accelerated.  Price moved sharply lower to entice responsive buyers to participate in the market.  The elevated prices prior to the selling were deemed unfair short term and the balancing process began on the intermediate term.  All of the upward progress achieved at the start of the quarter was tested and the gap which started the month/quarter was filled.  Markets abhor a gap, thus seeing it back-and-fill is a net positive for the overall structure of the intermediate term.  The market was trying to test the conviction of last week’s buy flow, to see if a strong bid truly existed at these prices.   It did a good job, as you can see below responsive buying showed up.  Whether buyers defend again today or progress higher will help us understand if we are truly coming into balance intermediate term or whether more selling is needed.  I have marked the relevant price levels below:

07092014_IntTerm_NQ

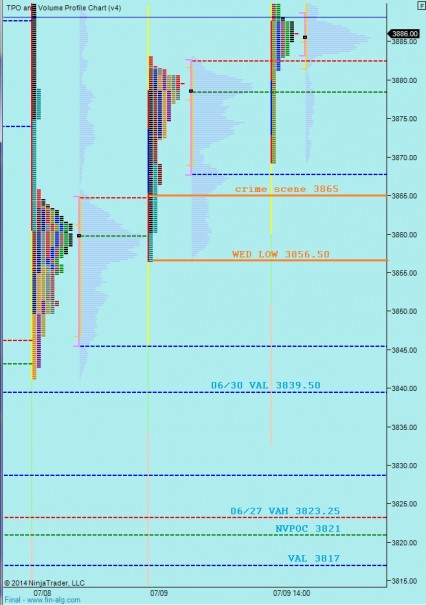
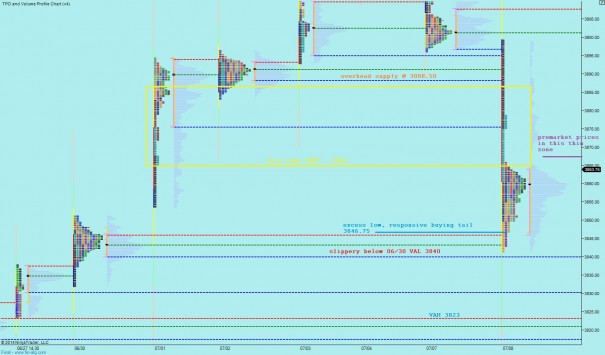
Short term we can see the sharp rejection of higher prices.  We opened near the bottom of Monday’s range and rejected and reversed lower.  After that it was off to the races until we saw a strong enough reaction.  Sellers were able to extend the initial balance range for an hour and a half after the initial balance suggesting liquidation was occurring on a longer timeframe.  However we did see buyers coming in.  The market is doing a really good job finding participants which leads me to suspect we come into balance on the short term.  This hypothesis is contingent upon holding the VAL from June 30th because below there we have the possibility to slide.  I have highlighted this support and other observations on the following market profile chart:

07092014_marketprofile_NQ

Comments »

I Know Where This Market Could Get Fast

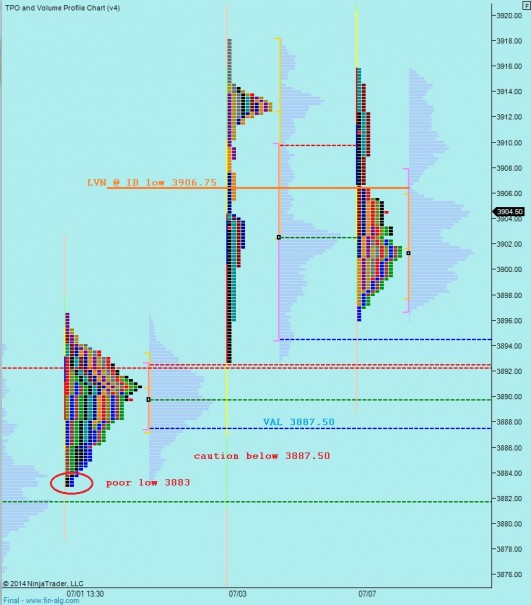
Nasdaq futures are trading a bit lower overnight on a balanced session of trade.  Before weakening, the prices rose to the Monday opening swing low (also initial balance low) at 3906.75 to the tick.  There was a slew of weak economic data out of Europe overnight, we have JOLTS Job Openings at 10:00 am, Consumer Credit at 3pm, and key Chinese PPI statistics this evening at 9:30pm.

The intermediate term auction was set into balance yesterday.  The early action was successful in discovering a responsive seller and once that was established we saw a successful discovery process lower.  It took some time to entice buyer back into the market however once they were found a modest response was registered.  Overall it left a key LVN above at 3906.75 (same level as mentioned earlier), see below:

07082014_IntTerm_NQ
The market profile print yesterday has a slight b-shape suggesting a long liquidation took place.  The action was relatively dynamic, however sell flow was not overwhelming the bid enough for prices to continue exploring lower.  Instead we formed a lower distribution.  If we take out yesterday’s low I could see it sparking another exploration lower.  I have highlighted the levels I see potential to test on the following market profile chart:


07082014_marketprofile_NQ

Comments »

Wrap Your Mind Around The Nasdaq Auction

Nasdaq futures are trading lower overnight as we come back to the market after a long holiday weekend.  Last week was a very strong week for the composite and extended the new swing high made in the prior week.  The net result of the action is an extended chart with buyers doing a good job migrating prices higher.  The biggest economic news overnight was weaker-than-expected industrial production numbers from the Germans.  We have little on the docket in the United States until Wednesday when The Fed will release minutes from their June meeting.

Looking at our long term Composite chart, you can see buyers in control via seven weeks of near uninterrupted progress to the upside.  I have highlighted two price levels above our current price action.  The first, red line, is where the 14 year old gap in prices starts and the second yellow line is where the gap ends.  This the biggest piece of context I am observing above.  Gaps tend to initially offer stiff resistance, perhaps even several times, before possibly being filled and likely in a rapid manner:
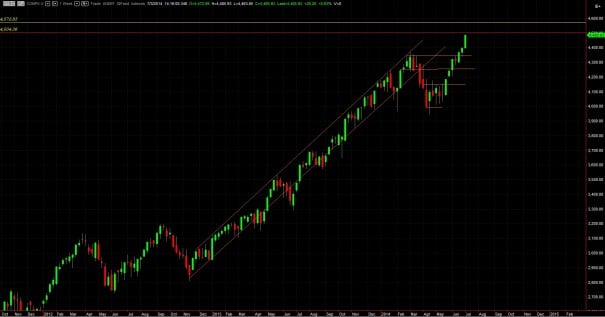
07072014_Weekly_NQ

Long term, there is a bit of structure that troubles me a bit and it started in May.  When I look at the monthly volume profiles, I see weakness in our recent bull run, the foundation poured before the rally seems odd.  These long term context pieces are just that, long term, and are the very broad strokes before honing in on the more actionable short term.  See below:
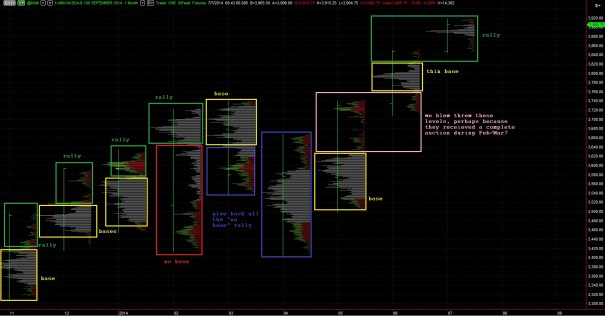
07072014_MonthlyProfiles_NQ
Intermediate term we might see a better perspective on just how much progress buyers have made these last two weeks.  There was a significant compression down near 3800 and buyers used its combustion to propel market prices over 100 Nasdaq points higher.  In their wake is a thin stretch of volume profile with some low volume nodes we might begin testing out if sellers start responding this week.  There is some structure near 3890 but no really thick volume structure until you look down to about 3800.  This is climbing the wall of worry and it appears many participants have opted to do so, see below:
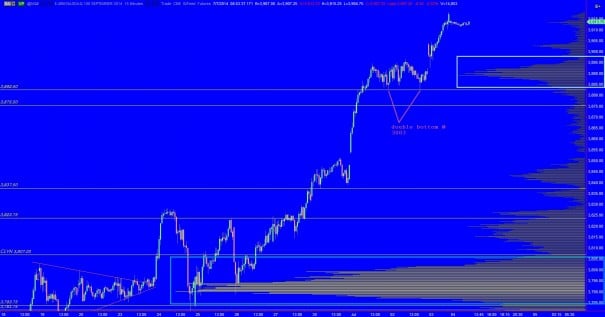
07072014_IntTerm_NQ

Taking to the market profile, we can see the market never really came into balance as we closed out the week.  The only balanced profile in sight occurred Wednesday after the trend.  I broke out part of the trend day, the part where the trend ended, and combined it with Wednesday’s balance.  This gives us a nice thick balance structure below to monitor.  It also made the vulnerable double bottom more clear to see at 3883.  We are currently set to gap lower inside an unbalanced profile which buyers were in control of at the end of last week.  This lack of balance and the gap lower might lead to some interesting intraday action to start the week.  I have highlighted some of the key zones I will be observing on the following market profile chart:
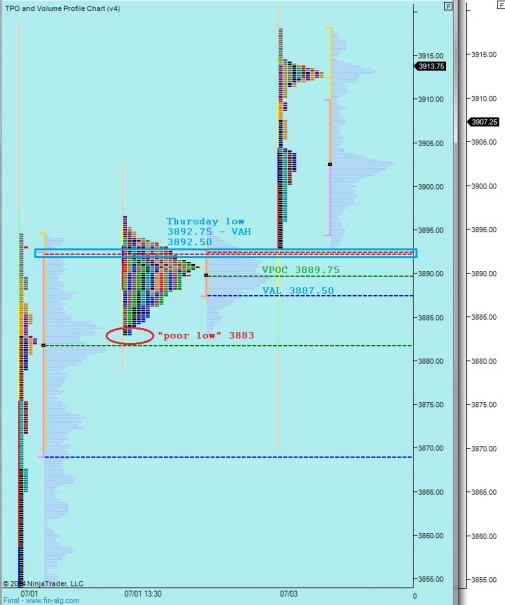
07072014_marketprofile_NQ

Comments »
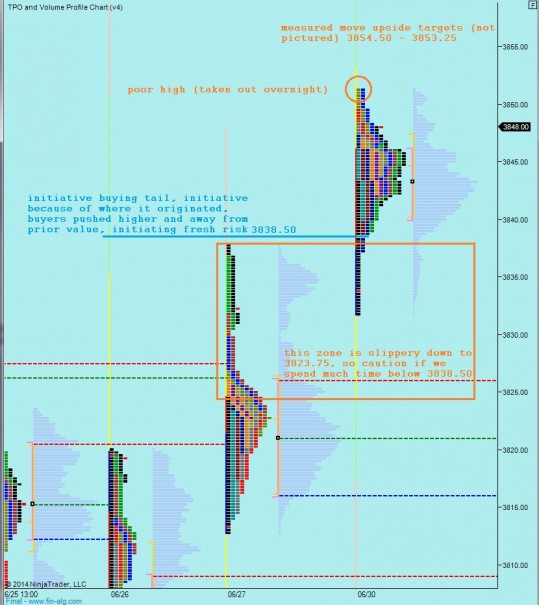
Opening Swings – Buyers Rule The Roost in The Short Week

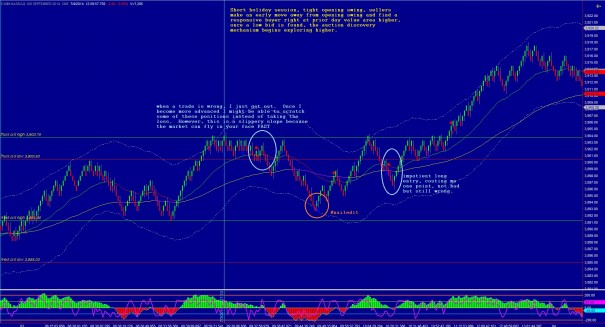
The holiday drift was in full effect last week and there were not very many opportunities to trade the short side of the tape.  Overall we saw very methodical auctions where the market set a low bid and then auctioned higher.

I highlighted the opening swings, except for on Tuesday, the strong trend day, which did not print an opening swing, instead only driving higher.

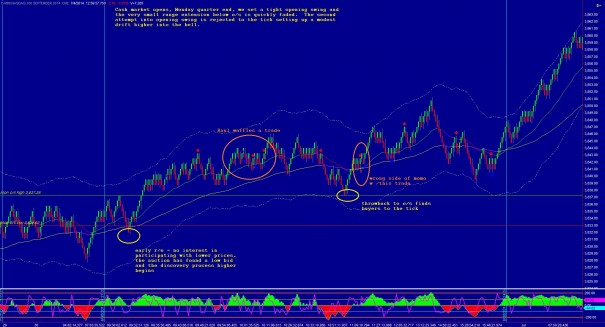
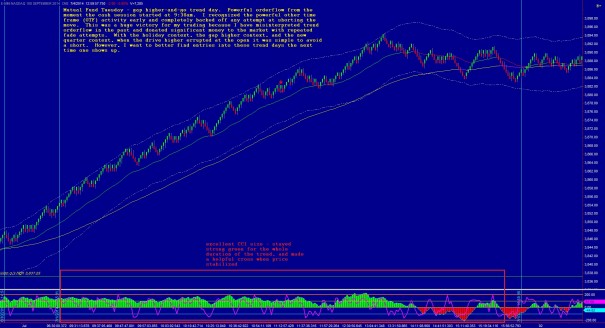
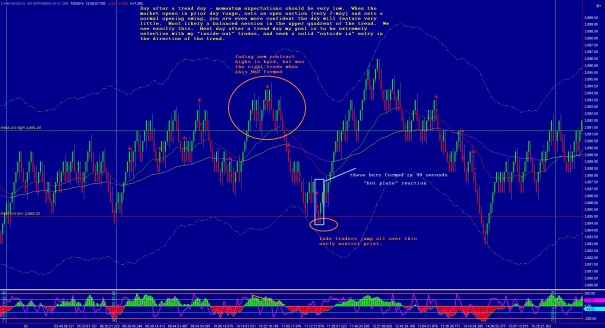
I have highlighted some of my best and worst trades of the week as well, enjoy:

MONDAY:

06302014_os

TUESDAY:

07012014_os

WEDNESDAY:

07022014_os

THURSDAY:

07032014_os


Comments »
Mutual Fund Tuesday – Holiday Edition

Today is the first day of the third quarter and also the second day of a holiday shortened week.  Nasdaq futures are currently priced to gap higher into the session by just over 10 points.  The important economic releases scheduled for today happen early during our session, with PMI Manufacturing index at 9:45 and more importantly ISM Manufacturing Index and Construction Spending at 10am.  There is a 4-Week T-bill auction at 11:30am.  Janet Yellen is set to speak tomorrow at 11am.

Price drifted higher overnight, and given the context of a poor high, the acceptance of value as evident by the clean distribution yesterday, and late responsive buyer the drift was expected.  These few days ahead of the 4th of July tend to be bullish, but with money managers eager to start the new month/quarter off we can see some bigger swings in both directions intraday.

The long term and intermediate timeframes are buyer controlled meaning prices are not balanced nor are they making lower lows and lower highs.  Instead we are making higher highs and higher lows on a weekly chart of the composite (see yesterday morning’s premarket analysis) and the intermediate term chart is doing the same.  If the market sees some selling today, there are some interesting low volume nodes we could test out while still retaining buyer control.  I have highlighted these levels on the following intermediate term composite:
07012014_IntTerm_NQ

There is a slippery zone on the market profile.  This is a price area where buyers were very confident yesterday.  However, should we trade back into this region and not observe the same level of confidence from the buyers, they we are likely to see a fast liquidation take hold, something to shake out weak handed longs perhaps.  On the upside we are working with measured moves.  I have noted the measured move targets, as well as a few other observations on the following market profile chart:

07012014_marketprofile_NQ

Comments »
Month End Monday

As we head into another month end trade, the Nasdaq is starting off the shortened holiday week in the green.  The overnight session was mostly balanced.  A wave of selling came through around 6am which found responsive buyers lurking below.  The Canadians released weaker than expected GDP stats at 8:30am this morning and the news thus far has not triggered a response from the US equity futures.  Notable economic data on deck today includes US Pending Home Sales and 10am, Dallas Fed Survey at 10:30am, and Fed’s Williams speaking at 1:10pm.

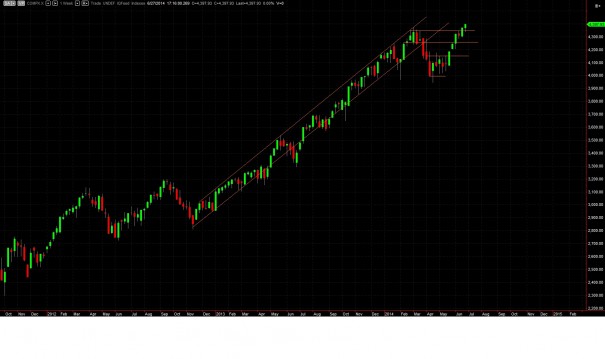
We closed out last week with a rally, and with prices at fresh swing highs.  Looking at a long term chart you can see the buyers are in control as price advertises higher in an attempt to entice sellers into the exchange:

06302014_Weekly_NQ

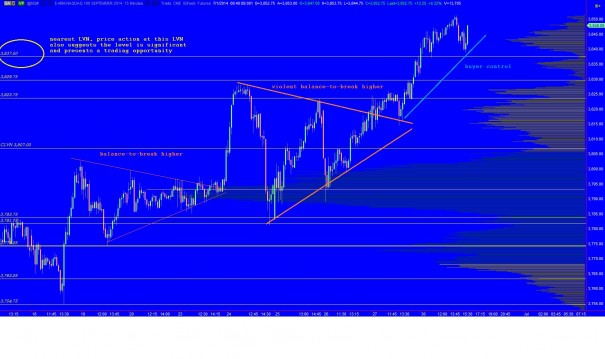
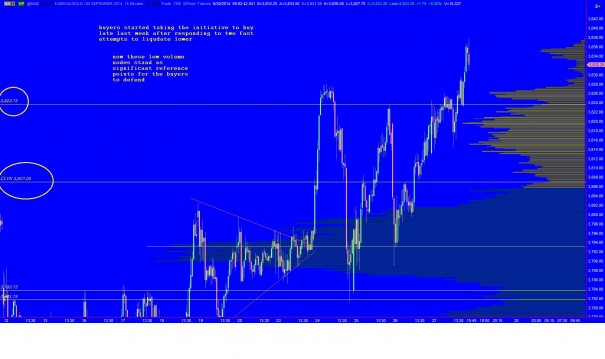
On the intermediate term we can see an important low volume node formed just before the breakout, 3823.75 is on watch early on this week:
06302014_IntTerm_NQ

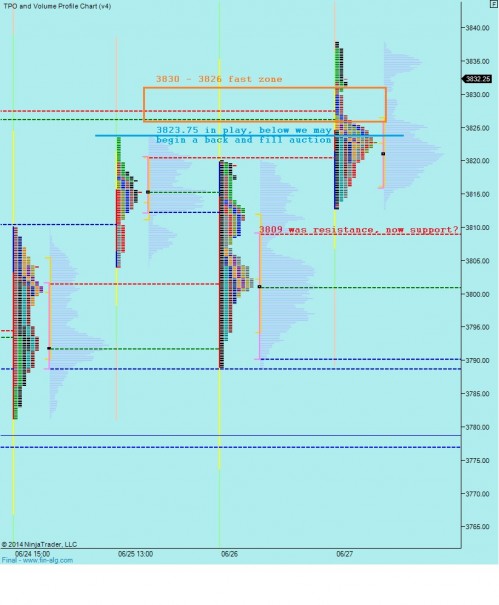
Bringing our attention closer to the action, the market profile shows value on the rise with Friady printing a normal variation day with buyers extending the range higher and also pressing value higher.  The price zone from 3830 – 3826 is fast and we may traverse it a few times today, especially if the market begins to balance out.  I am particularly keen on the low volume node which appears here on the market profile as well as the composite, right at 3823.75.  This level is my in play action level of the day. I have highlighted this level and a few more observations on the following market profile chart:

06302014_marketprofile_NQ

Comments »