iBankCoin
Home / Tag Archives: $NQ_F (page 21)

Tag Archives: $NQ_F

The Market Will Keep This Up Until We Are Done Finding Sellers

The economic calendar is quiet to start the week but will be ramping up as we progress.  We have NAHB Housing Market Index at 10am, Bank of New Zealand Inflation Expectation just before midnight, and UK and USA CPI data out before the open of Tuesday trade.

Nasdaq futures are currently set to gap higher to begin the week.  We are right about at the threshold of “pro gap” territory where seeking to fade the overnight action can require deeper pockets than most traders have.  The key however is to observe how we open and especially any attempts to reject the higher prices.  Opening like this, to start the week, up at contract highs, elevates the risk of an opening drive in either direction.

If instead we see an open auction and then some chop, we know the other timeframe is waiting before making a decision.  Either way, the discovery process is active until the market is done finding sellers.

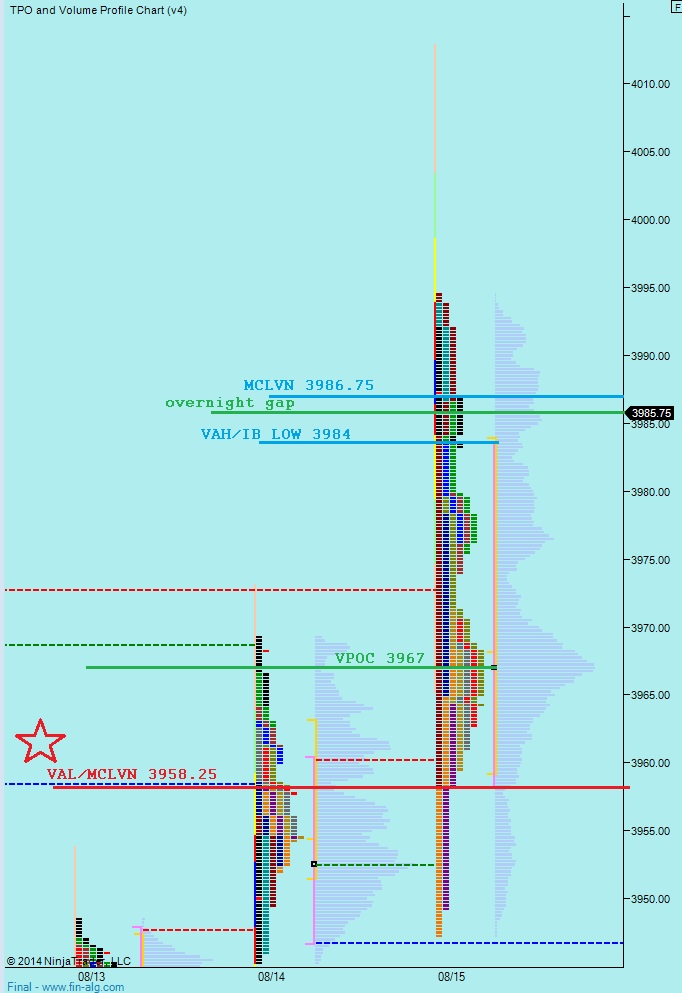
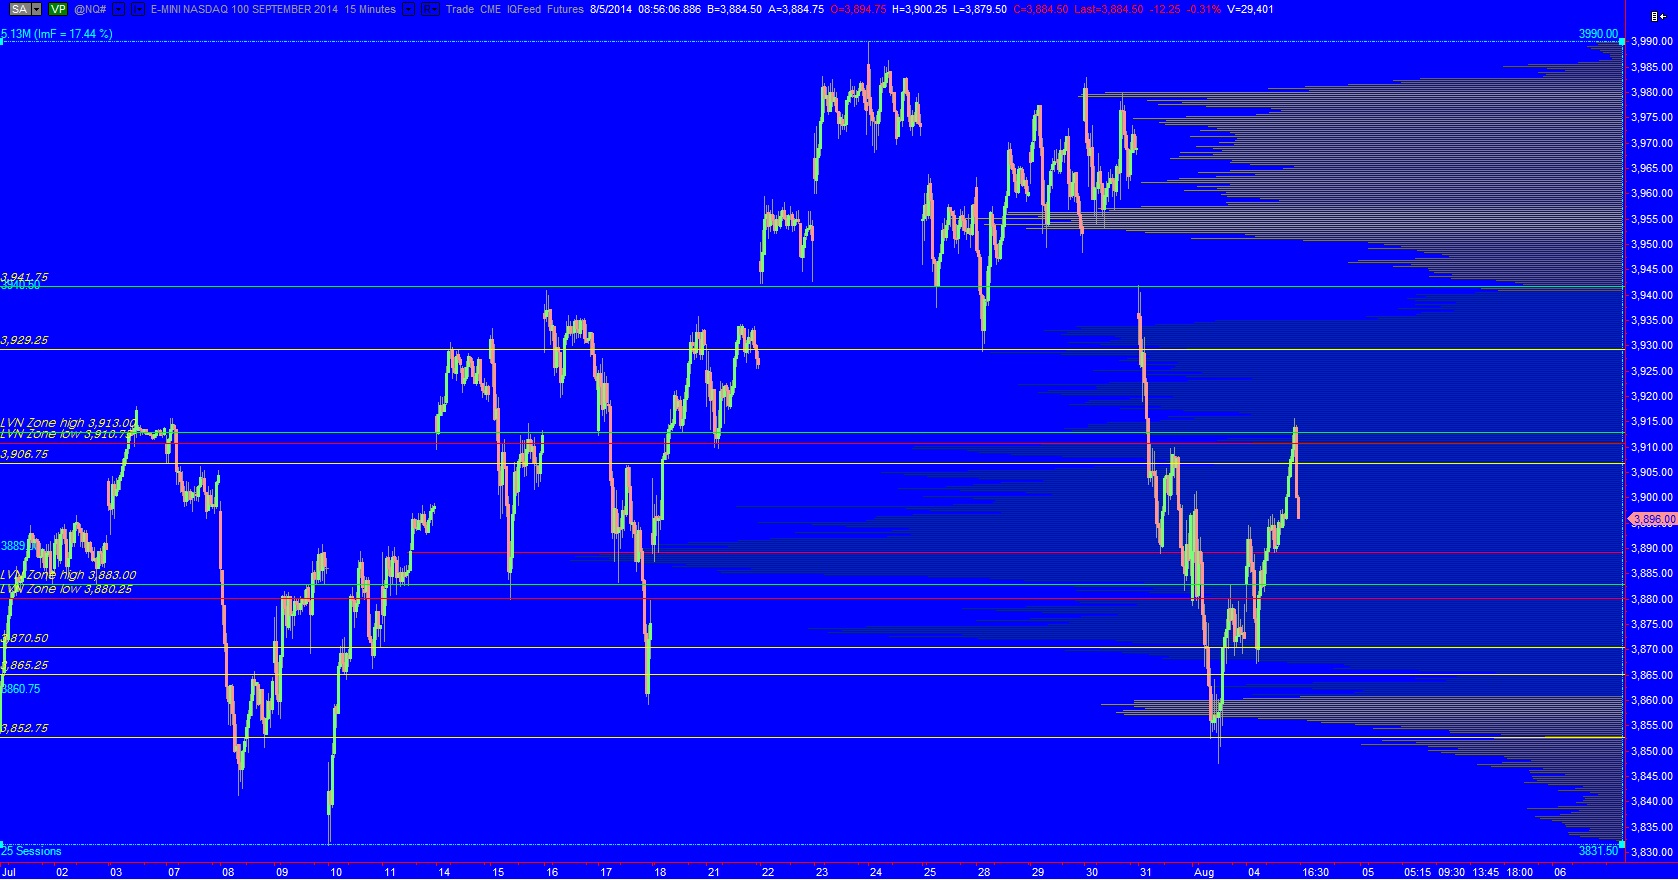
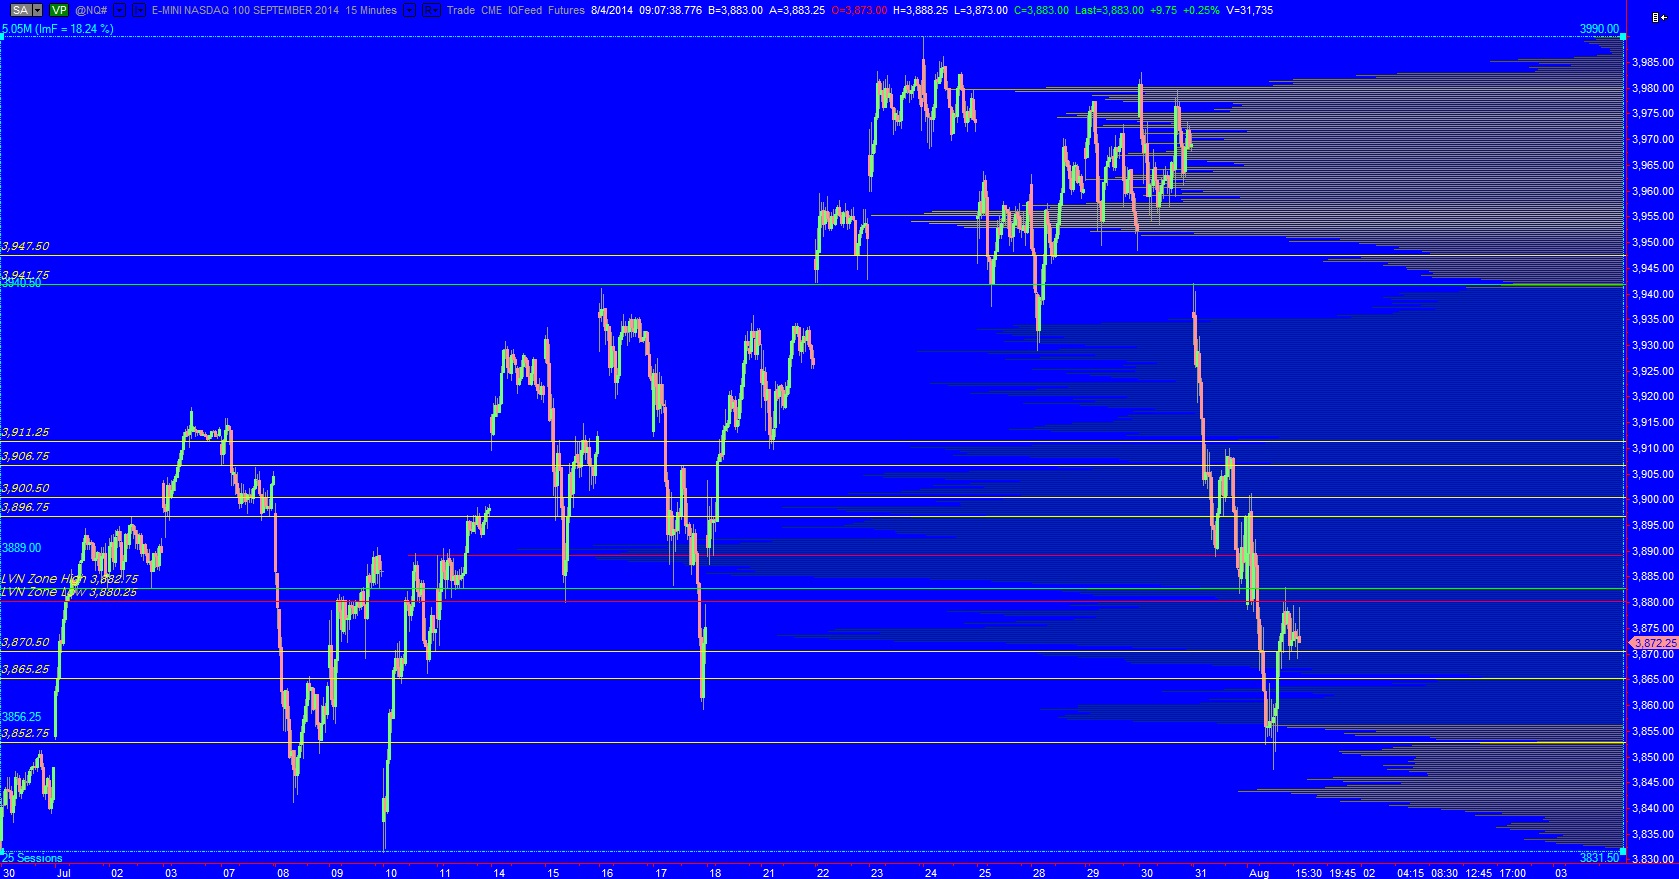
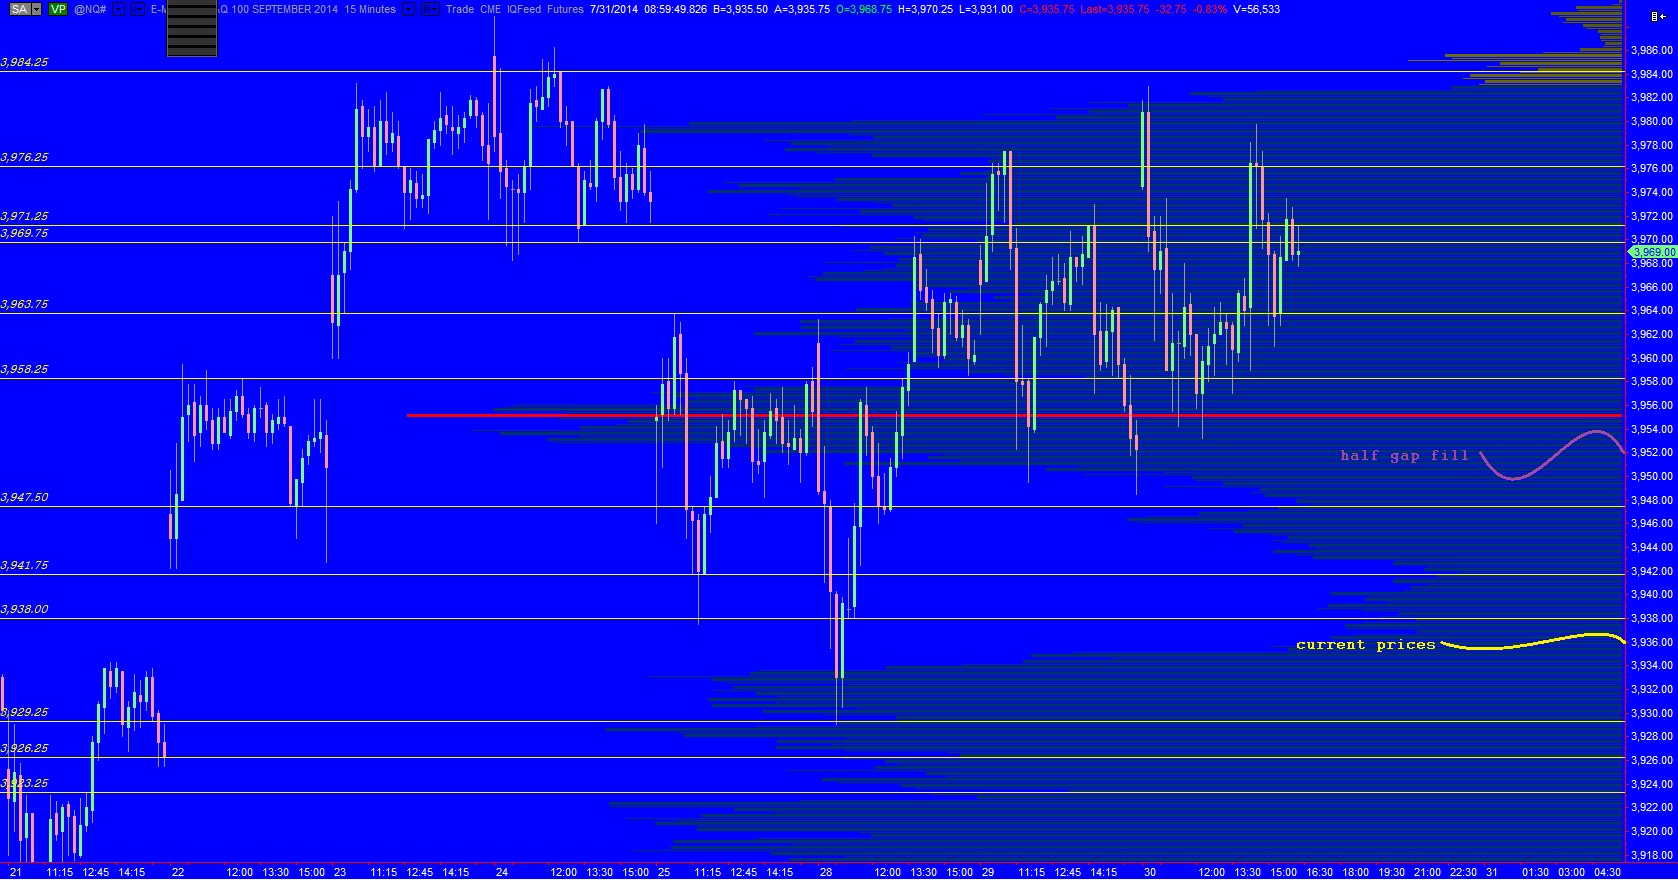
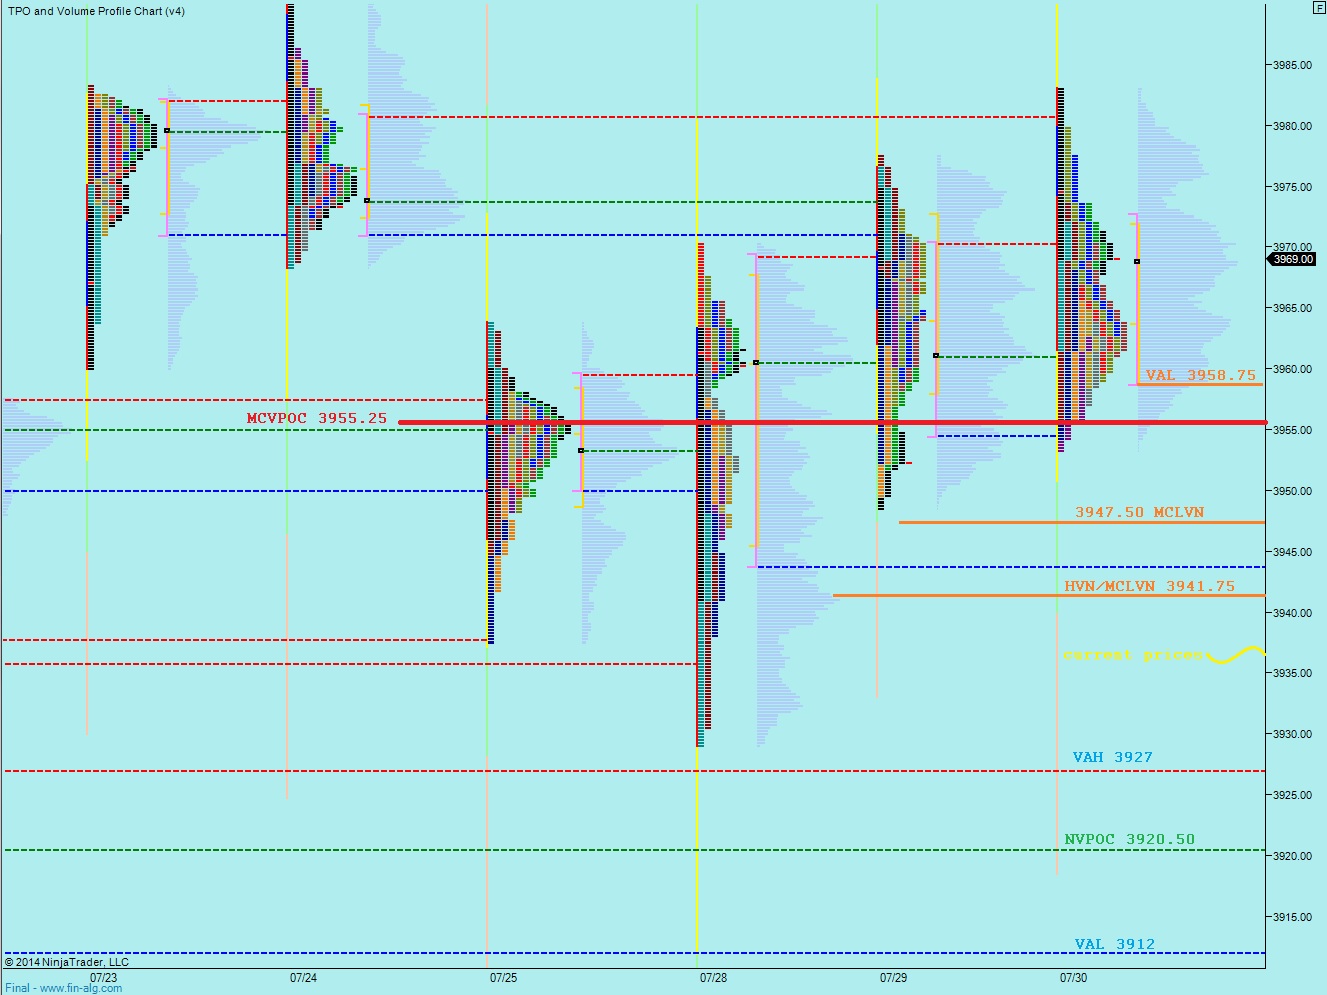
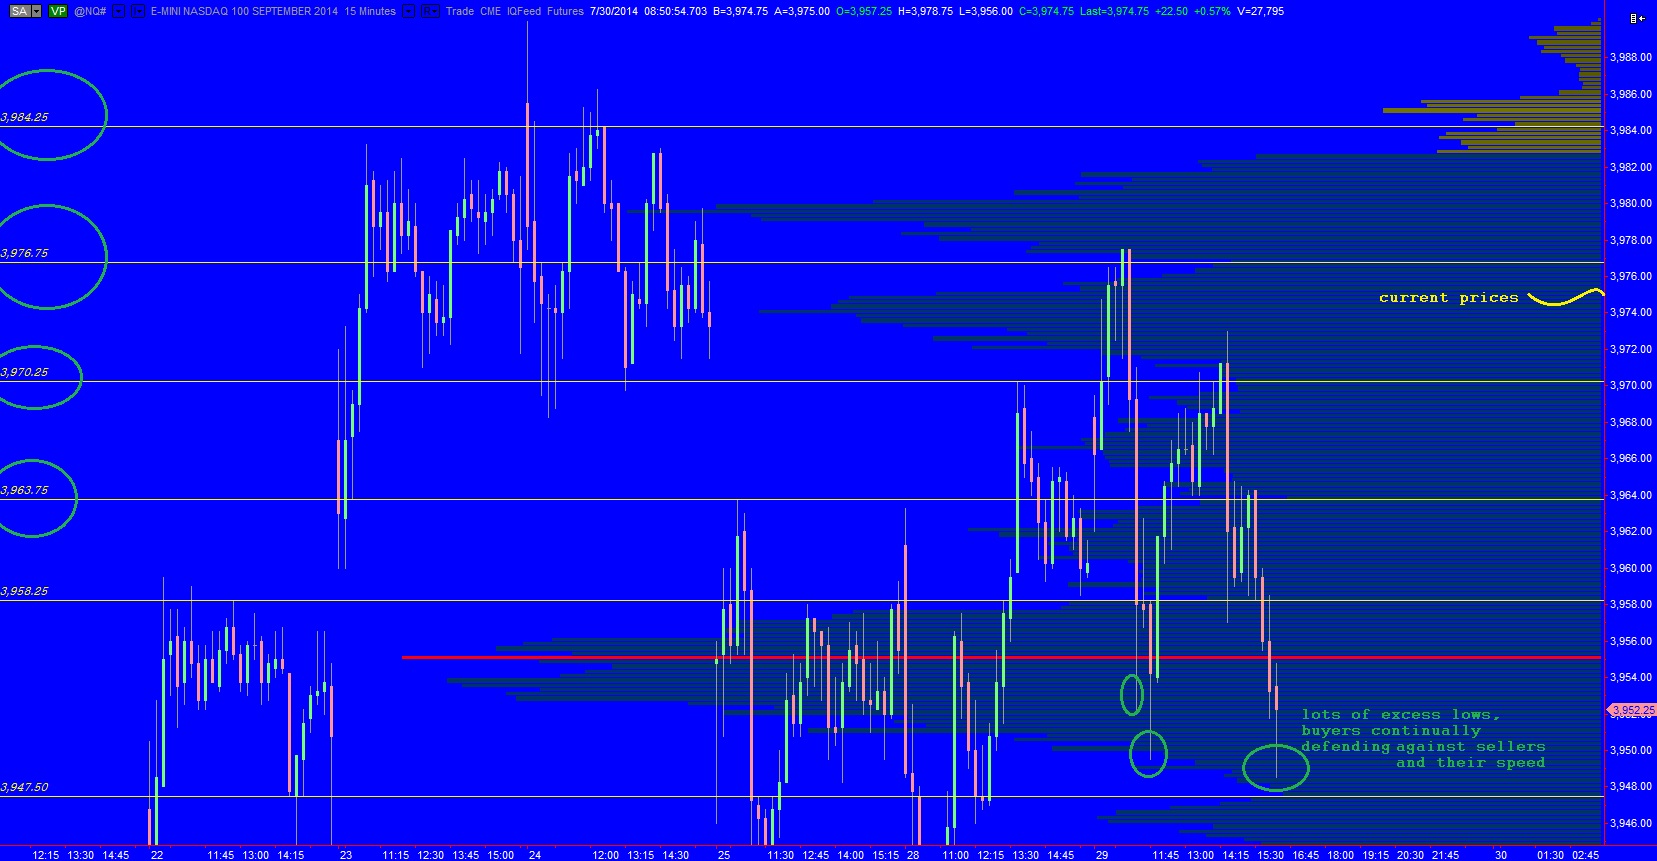
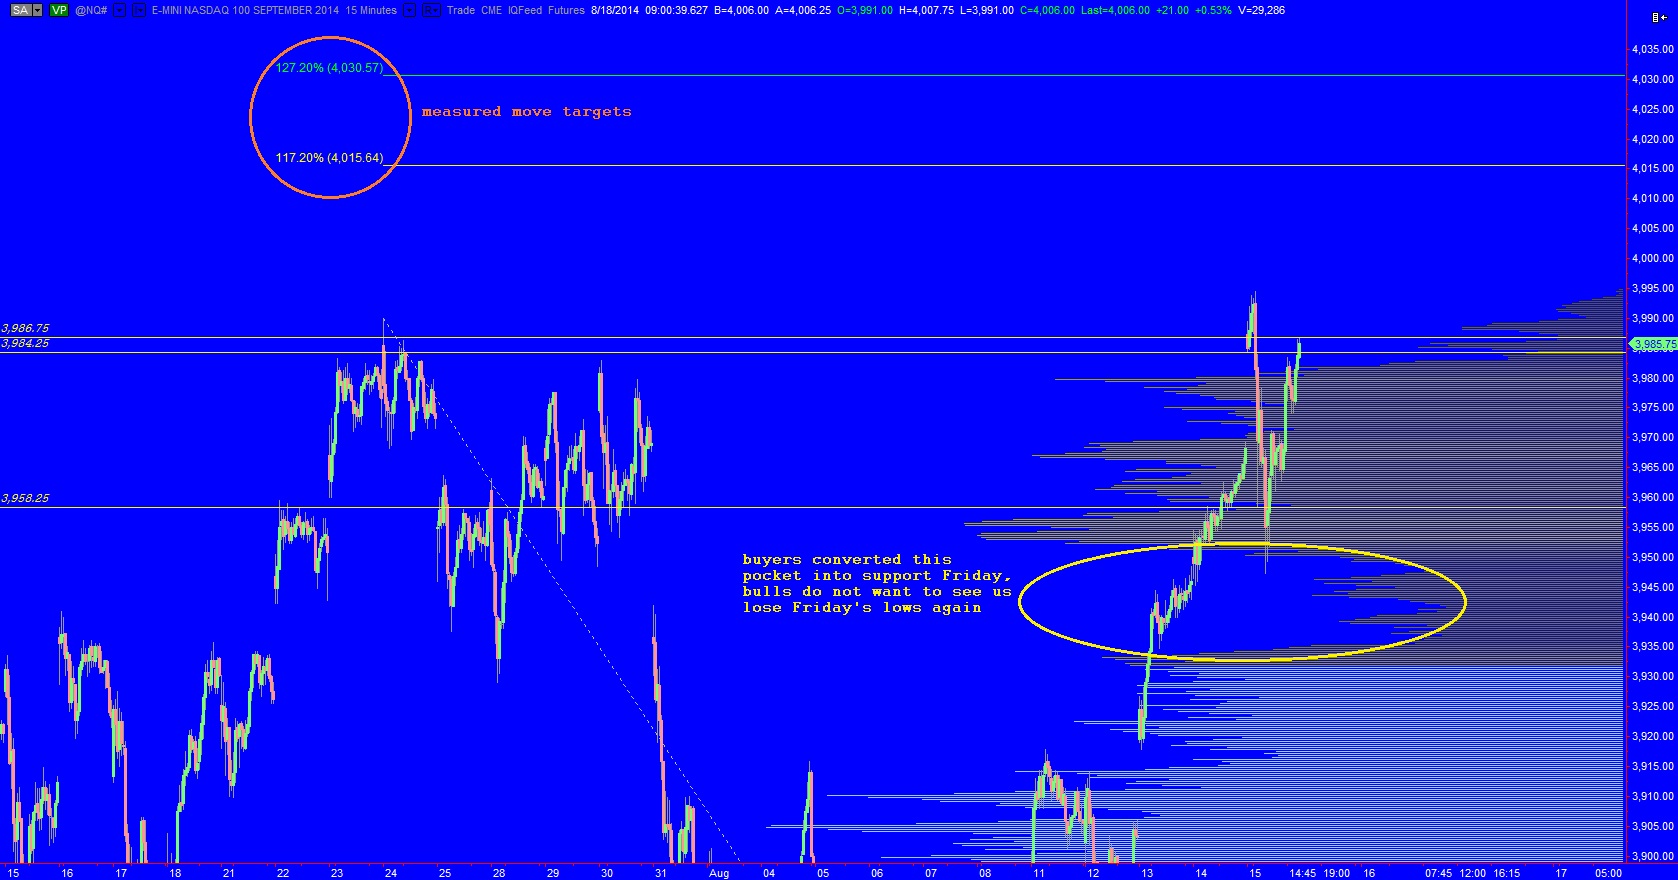
I have noted the nearest low volume nodes on the following intermediate term chart.  If sellers can push trade down through 3958.25 then the market likely has done a good job finding sellers on the intermediate term timeframe and we can begin balancing again on this timeframe.  This may not be a welcomed development for the market.  I have also noted my measured move targets to the upside.  These serve more as reference points then specifics, but are upside road signs to gauge the action.  See below:

08182014_IntTerm_NQ

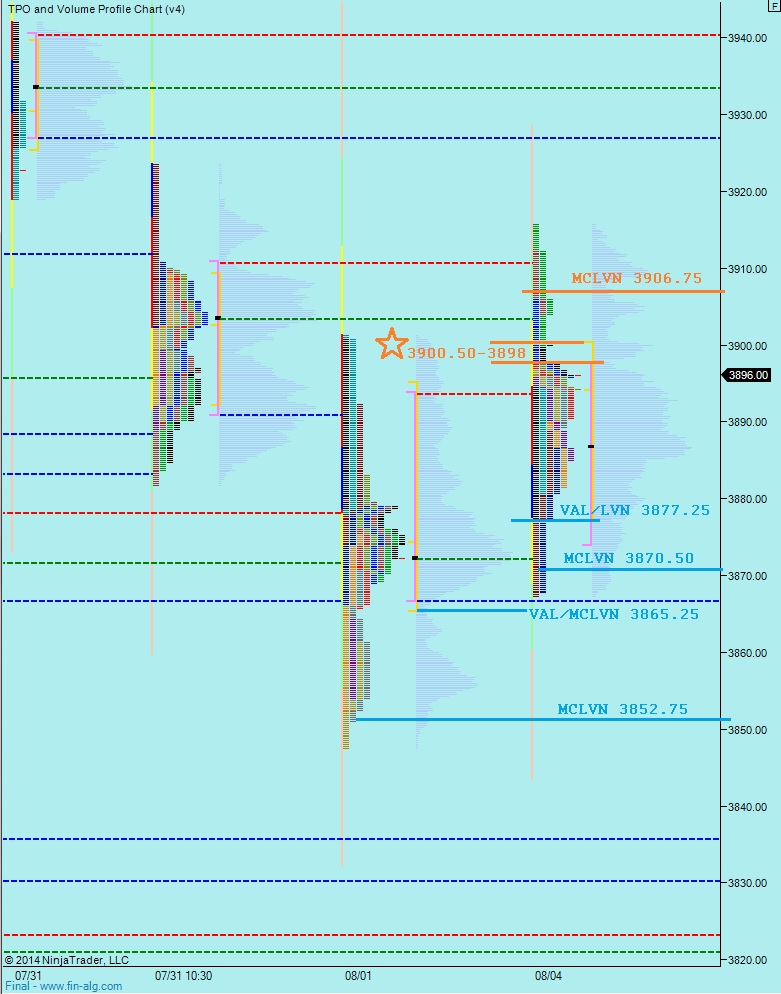
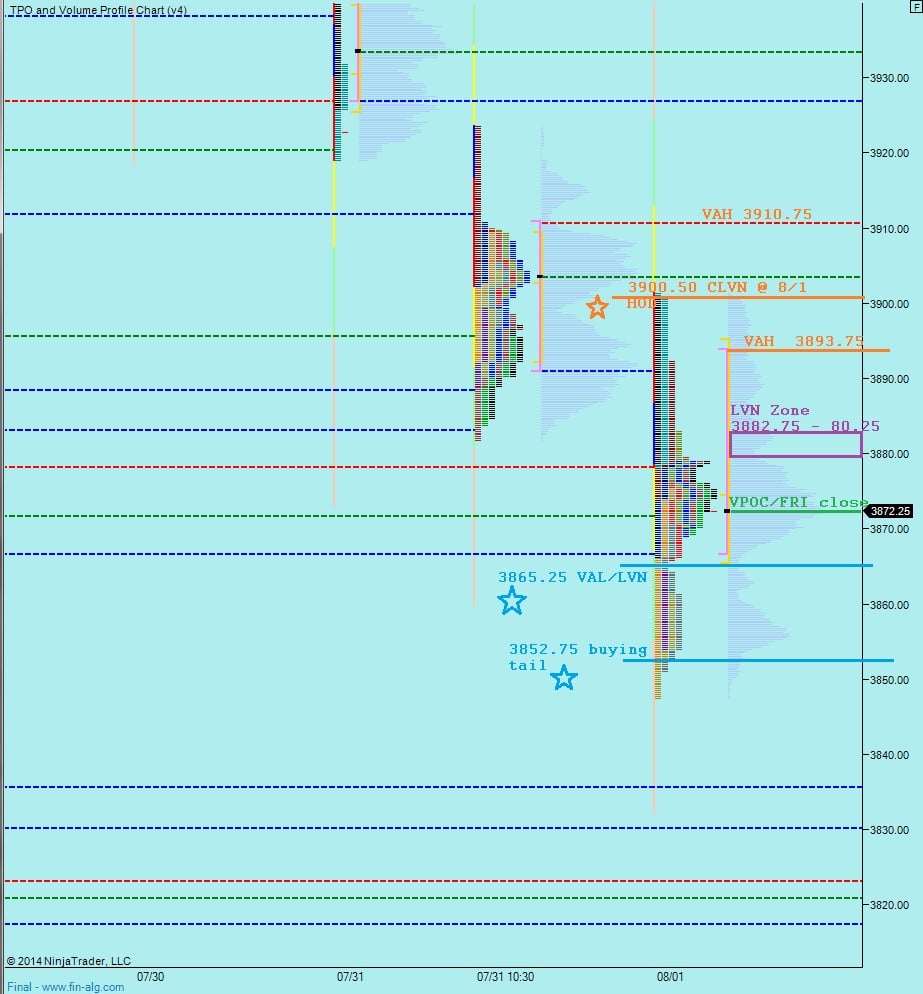
Therefore, should we see sellers push down and fill the overnight gap, we need to be keying off of Friday’s market profile.  I red starred the VAL at 3958.25.  If we start trading below that level, especially today, then you should take caution on the long side.  I have noted the key levels below:

marketprofile_08182014

Comments »

Holding Shorts Underwater

Last week’s work is paying off today.  When you put aside the headlines and focus on interpreting the auction you will find yourself much more able to execute.  Traders often struggle with their trading during the summer months for a variety of reasons.  In many ways, summer trade is like the off season and such a break is much deserved and needed.  However, if you push too hard, forcing trades, you might be frustrated when the thin action plays out.

The Nasdaq has been leading thus far this morning, where price gapped up and chopped a tight range before breaking higher.  Although I do not expect a ton a conviction from buyers today, I would still caution shorts with this initiative-type buying occurring.  I highlighted the 3907 price level this morning as a key composite LVN to monitor during today’s trade.  Watch how the market treats this level today as your intraday pivot.  Should we continue sustaining trade above it, then the discovery process is likely to continue higher.

08112014_IntTerm_NQ_midmorn

On the day my only action was scaling off a piece of my TNA long.

Comments »

Monday Morning Context Read

Quiet morning on the economic front, with our biggest scheduled event being premarket earnings announced by PCLN whose shares are currently trading over 2% lower on a weaker-than-expected Q3 forecast.  The calendar is relatively quiet until Wednesday, however we continue to be in an elevated headline risk environment associated with both Mid East and Russian tensions.

As we head into USA trade, the price of the Nasdaq is set to gap higher.

Turning our attention to the auction, long term participants are bullish to neutral.  Intermediate term players have been neutral-to-bearish since the end of July.  Last Monday we traded back up above 3900 and were unable to find sustained buyers.  Then several times last week, a responsive seller was found just above MCVPOC at 3886.  We are set to open above the 3886 responsive seller near 3900.   The intermediate term timeframe is in balance over 30 sessions after pulling back off the highs.  You can see the intermediate term commentary on the following composite profile:

08112014_IntTerm_NQ

Risk of a drive higher is elevated today give the gap up and away from a 4 day range.  The drive force becomes even more likely if we sustain trade above 3907, the nearest composite LVN to current prices.

On the contrary, if we open for trade and the market goes on SALE, with a large rejection seller who starts fading the gap, we are returning to a very ugly auction from Friday.  Caution if we sustain trade below 3882 it opens the door to an overnight gap fill down to 3873.75 which puts us on the mouth of a slide zone down to 3867 and Friday’s session had a poor low which too would be vulnerable.  It is context to keep in mind today, this poor structure, especially if we see an aggressive fade.

I have noted the short term levels I will be observing on the following market profile chart:
marketprofile_08112014


Comments »

One Ugly Auction

Friday’s Nasdaq auction took on an odd formation which in part was news driven.  The profile itself does not provide much short term signal, but it does provide many juicy opportunities if we auction through it early next week.

First off, both price extremes, the high and low, were poorly formed.  Thus if we open for trade inside this range Monday and price action begins pushing toward one the extremes, it is likely to break.  Second, when news of the Russians withdrawing troops they had postured along the Ukrainian border hit the wires price lurched higher leaving a series of single prints on the tape.  This thin area received no auction.  If you look to the left you can see we already spent a significant amount of time deliberating these prices, thus we may not need to auction them again.  However, if price pushes into this slider range from above or below, we are likely to sweep right through it fast.  Finally, all of the action took place inside of Thursday’s range, an inside day.

An inside day is often used to signal indecision because neither the buyers nor the sellers are able to push the price beyond the prior day range.  It may suggest the recent index weakness is coming to an end.

Be sure to tune in Monday morning, when we have more updated prices to template against this profile.

marketprofile_08102014

Comments »

A Fresh Look at Multiple Timeframe Volume Profile

Nasdaq futures were very illiquid last night and with only slightly above average volume we managed to print over 40 points of range.  It started yesterday evening when a wave of sell flow pushed the market lower.  The timing of the selling loosely correlated with US President Obama approving the use of strategic air strike in Iraq.  There were also so big moves occurring across the Forex complex including the Aussie dollar.  Around 4:30am prices reversed course and quickly auctioned higher and the push managed to take prices up above yesterday’s midpoint.  As we approach US trade we are set to gap a bit higher however prices are on the move, and where we are in a half hour could materially change.

One of the questions we constantly ask ourselves as speculators is, “who is participating in this tape?”  There are day-timeframe and other short term participants or “locals”, intermediate term investors, and long term players, and believe it or not, longer term participants.  Think of locals like car dealers—they only hold inventory for a very short time with the intention of facilitating trade between the long term seller (the auto manufacturer) and the long term buyer (the consumer).  Locals do not have strong drive or commitment to prices, and do not drive directional moves.  Intermediate term participants may extend prices a bit with their position entry because they have a longer term horizon and do not observe short term price levels.  The long term participant will drive through many price levels, moved to act perhaps by a geopolitical event or macroeconomic theory.  When they act, our job as smaller players is to stay out of their way or join their order flow.

This is the essence of timeframe analysis.  The challenge is keeping it all straight in the heat of the trading day which is why I create these morning reports.  However there is always a possibility of a better looking glass or tool for observing the action.  I have been building this new volume profile chart for a few weeks, have a look.  You will notice three sets of volume profiles.  The black outline is the long term composite, the red and blue on the far right is the past six days of trade (the stalemate between a big buyer and a big seller), and finally each daily volume profile.  I have noted the key prices which likely determine the victor of this intermediate term battle, as well as other interesting short term levels:

08082014_IntTerm_NQ
I have noted short term observations and levels on the following market profile chart:

0808.2014_marketprofile_NQ


Comments »

Conviction Seller North of 3900

The buyers got a bit ahead of themselves early yesterday afternoon when they pressed prices up through the highs. Once doing so, they uncovered a strong responsive seller who patiently let price come to her and then erased over 20 points of progress in the final 30 minutes of trade lasting from 3:45-4:15pm.  That pulse of selling carried over into the overnight session where the brief pop in prices after weaker-than-expected Chinese PMI data was faded and prices continued drifting lower.  On our economic radar for today’s trade is ISM Non-manufacturing composite at 10am as well as Factory orders at the same time.

The intermediate timeframe is spreading out like discovery is taking place, but as a pile of volume-at-price it still resembles balance.  The balance we can observe dates back to the start of July, has a low slung VPOC just below our current prices, and we are currently muddling through the thick value zone.  I have highlighted the key price levels below which will serve as sign posts as the story unfolds:

08052014_IntTerm_NQ

You can see the intense indecision on yesterday’s market profile which has long tails on both sides of value.  This is the nature of a neutral day which has a real lack of directional conviction.  I have noted the price levels I will be watching early on below:

08052014_marketprofile_NQ

Comments »

Is The Nasdaq Done Finding Buyers?

The economic calendar is quiet to start the week and many of the headline companies have already reported earnings.  Thus much of what has been made known is public to the market and the market is tasked with establishing value according to these facts.

The Nasdaq has gone lower for two sessions after balancing out near annual highs.  It carried some major speed to the downside and the selling managed to recapture nearly all of the progress made in July.  Around lunchtime we saw our first signs of responsive buying significant enough to stick around for a few hours.  Futures continued drifting higher overnight and as we approach cash open we are set to gap higher by just about 9 points.

I carefully reviewed the current intermediate term balance and highlighted the key prices levels within this balance below:

08042014_IntTerm_NQ

Furthermore, I have highlighted the prices levels I consider in play early on using the following market profile chart:

08022014_marketprofile_NQ

See the below comments for hypothetical trading scenarios as well as intraday updates.

Comments »

Looking To The Left

Nasdaq futures were down over 40 points early this morning but are paring back some of their losses after a weaker than expected jobs report which seems to be easing the expectation of a rise in interest rates sooner by The Fed.  As we approach cash open Nasdaq futures are trading down about 20 points but are moving fast.

We have the final July read on manufacturing from data firm Markit at 9:45 a.m. and the final July read on consumer sentiment from the Thomson Reuters/University of Michigan Surveys of Consumers at 9:55 and we are expecting a rise to 82 from 81.3.  Most sensitive of the economic news comes at 10:00 a.m. when the Institute for Supply Management’s read on July manufacturing is due and is seen rising slightly, while June construction spending is seen rising 0.5 percent.

The market also is digesting a default from Argentina after they did so 12 years ago.  This country is not fiscally responsible, to say the least.  There are also rising tensions in the Gaza Strip, and Russia is in a tiff with Europe and the USA.

This is also the first of the month, typically today and the following three trading sessions have a bullish skew for equities.  It is also Friday meaning new longs would have to sit through the weekend which may create some hesitance.

The intermediate term profile is in many ways out of balance and very active.  Yesterday’s gap-and-go trend day down is seeing some continuation today.  The speed will be telling, and I have highlighted two low volume nodes below yesterday’s close which will be the tell for me.  I do not want to see the market rush to test these levels (3870.50 & 3865.25).  If we are testing these levels before lunchtime, that in and of itself says the velocity in the market has changed.  Remember, bears can take back a month of gains in one week.  I will be most keen on these intermediate term prices to dictate my actions today:

NQ_VolumeProfile_intermediateTerm_08012014

However, should pace shift and back to slow, I will be watching the following market profile levels intraday:

08012014_marketprofile_NQ

Comments »

Month End Pro Gap

Index futures are down quite a bit across the board as we approach the final day of US trade in the month of July.  The major news overnight came from Argentina, who in a few hour may default, an event which would “plunge the country into turmoil.”  Worsening tensions with Russia seem to be weighing in on the eurozone where some are speculating the external shock may be enough to push them into a deflation trap.  We are off the overnight lows a bit but saw a fresh wave of selling roll in after the 8:30am US Continuing Claims and Initial Jobless Claims.  We have Chicago Purchasing Manager at 9:45am, a Natural Gas Storage report at 10:30am, and Chinese Manufacturing PMI out after hours today at 9pm.  We are also in the thick of earnings season which has been mixed but positive for social media, a hot spot of discussion after being singled out by Fed Chair Yellen.

We can rack our minds with all of this macro economic news, or we can focus our energy and attention on the auction taking place, and use our objective eye to perceive who is participating in this market, what they are trying to do, how good of a job they are doing, and what they are likely to do from here.

It is the end of the month, equity inflows typically take place at the start of a new month, and we are wrapping up the first month of Q3. The first half of the year was a challenge for growth performance, especially after many of the marquee high beta stocks were cut in half.  Thus starting the second half of the year strong was important to many participants.  With that in mind, we know the intermediate term is very likely to be active in this environment.

On the month, we formed a rather balanced profile until launching higher.  The final footprint left a big volume pocket which we have slid through overnight.  There was a second volume pocket up higher, but we filled it in this week.  Now it appears we are backing and filling this region.  See below:

07312014_Monthly_NQ

If I bring our eyes in a bit closer we can see the key price levels on the intermediate term, the levels we are likely to see respected during today’s trade:

07312014_IntTerm_NQ

I will also be keying off the following market profile levels to start the morning:

07312014_marketprofile_NQ


Comments »

Who Run It?

Nasdaq futures extended their overnight gains this morning when US GDP came in better than expected for the second quarter.  The price action took us just above yesterday’s high on the session before finding some responsive selling.  As we roll into US trade keep in mind the FOMC Meeting Announcement at 2pm today.

The intermediate term auction is just a mess, and as we close out the first month of Q3 it is apparent the OTF is jockeying for position and performance.  What this means is moves possess more conviction, go further than you might expect, and will often times ignore “day-timeframe” or local price levels.  This is a huge concept to understand, and one that causes many system traders to struggle.  The conditions changed around 07/22 and have become even more pronounced as of 07/25.  With that in mind, these intermediate term price levels are more pertinent to our decision making process then our market profile levels:

07302014_IntTerm_NQ
However, just as we shifted to an intermediate term climate, we could just as easily shift back into a local controlled chop.  This is the essence of market profile analysis, to answer a few questions:

Who is likely participating in the market?

What are they attempting to do?

How good of a job are they doing?

What are they likely to do from here?

The interesting piece of market profile context from yesterday-to-today is derived from the day type we printed yesterday–a Neutral Extreme.  The Neutral Extreme day type is characterized as such for having range extension on both sides of the initial balance AND a close near one of the daily extremes.  This type of close has a strong directional conviction in the direction of the close, which was down.  Meaning, participants were VERY confident they would be waking up to lower prices this morning.  Thus today’s big gap up is likely to produce a squeeze if the sellers cannot hammer the tape early on.

Therefore, I have highlighted the short term levels I will be observing early on to gauge market conditions using the below market profile chart:

07302014_marketprofile_NQ

Comments »