Something to keep in mind whenever using a tool or indicator or data set to observe market behavior is the risk of confirmation bias. As objective as numbers and graphical representations of numbers are at first impression, as we shape them and select pieces from them we form our own data. The key is perception and whether it is guided by the logical mind or the more instinctive, yet emotional mind.
One of the essential tasks for any trader is knowing when conditions have changed as early as possible. Some strategies fare better in certain conditions, like balance. Other strategies would be better suited for the price discovery phase. If these concepts are a bit over your head, then I suggest taking a few hours to bring yourself up to speed with market profile. This however is not mandatory to interact with today’s post.
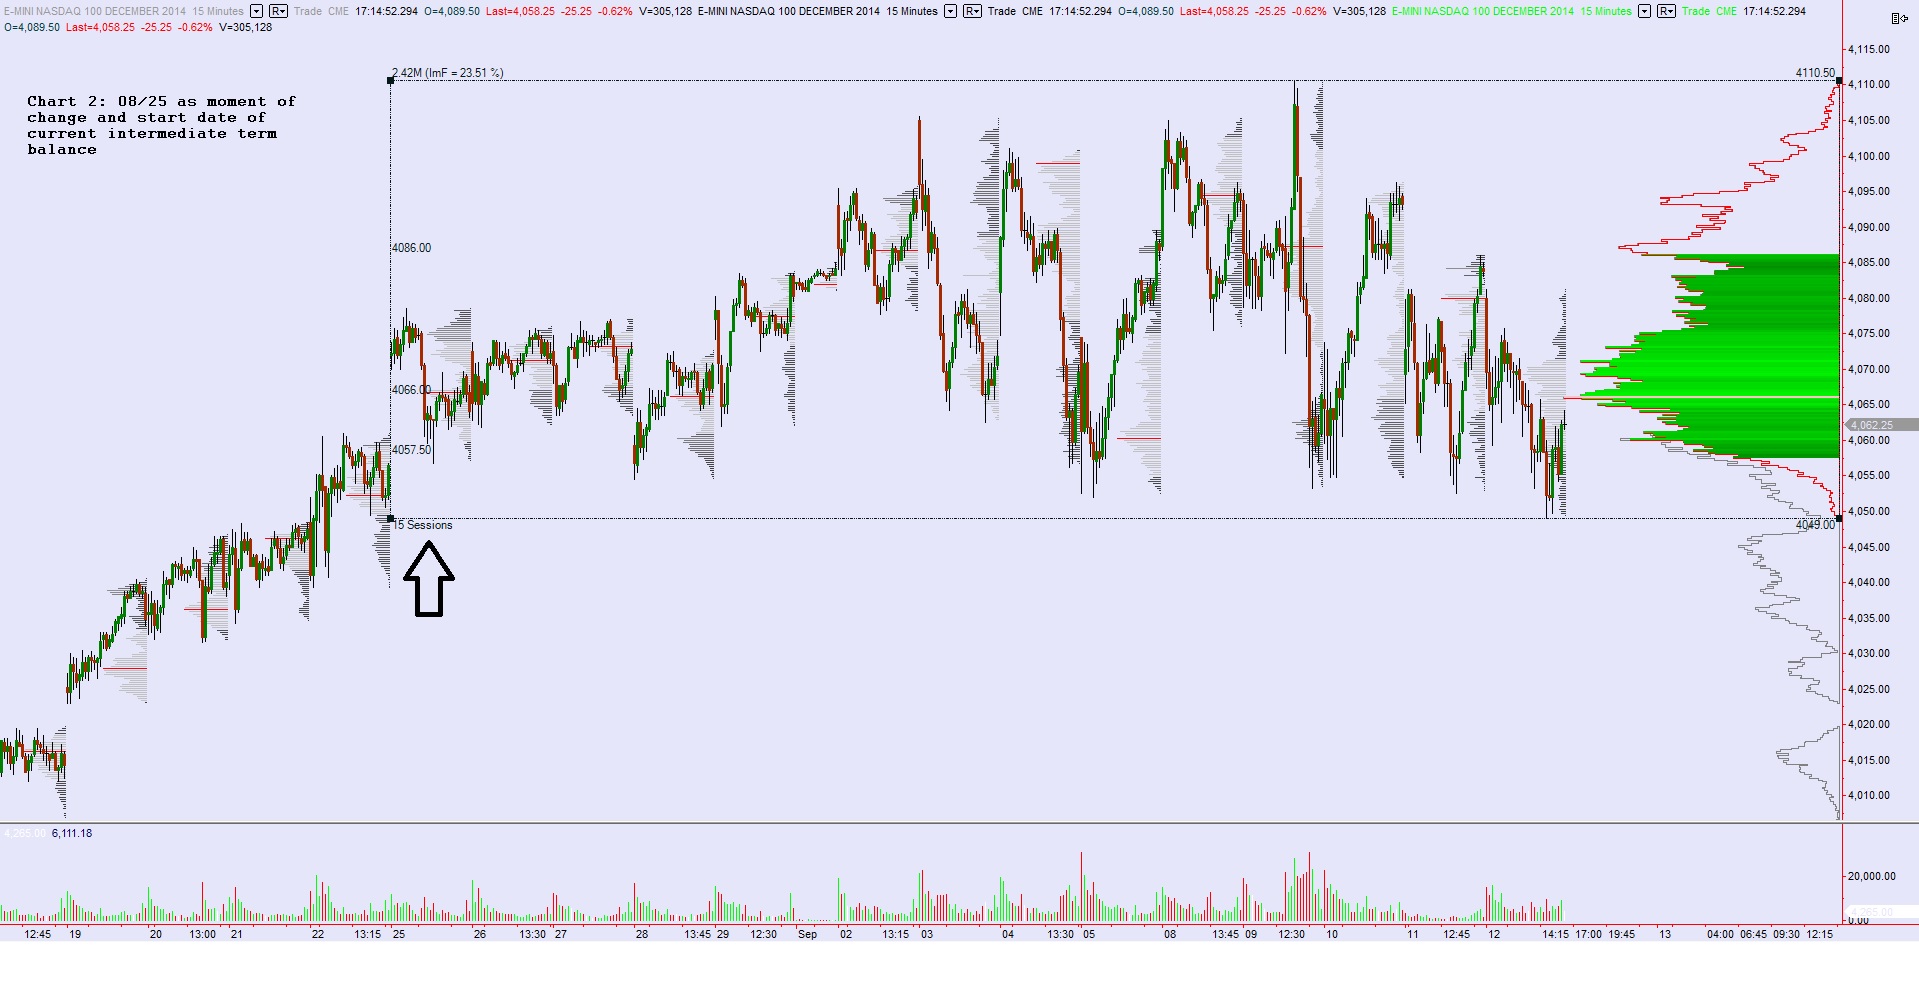
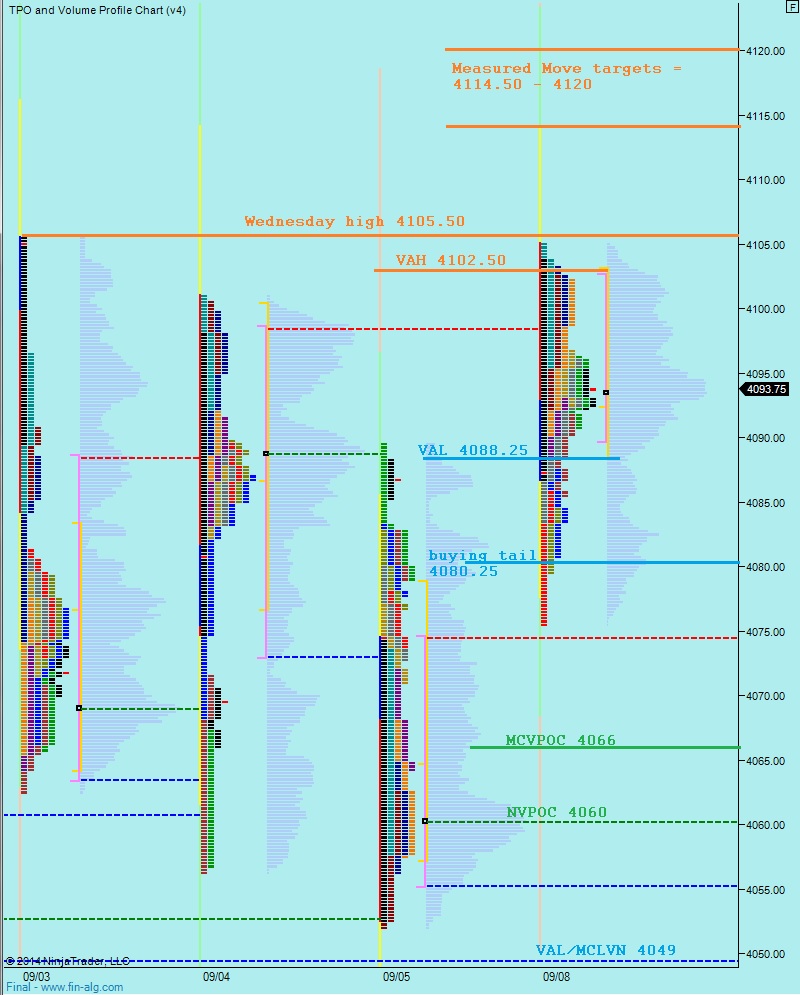
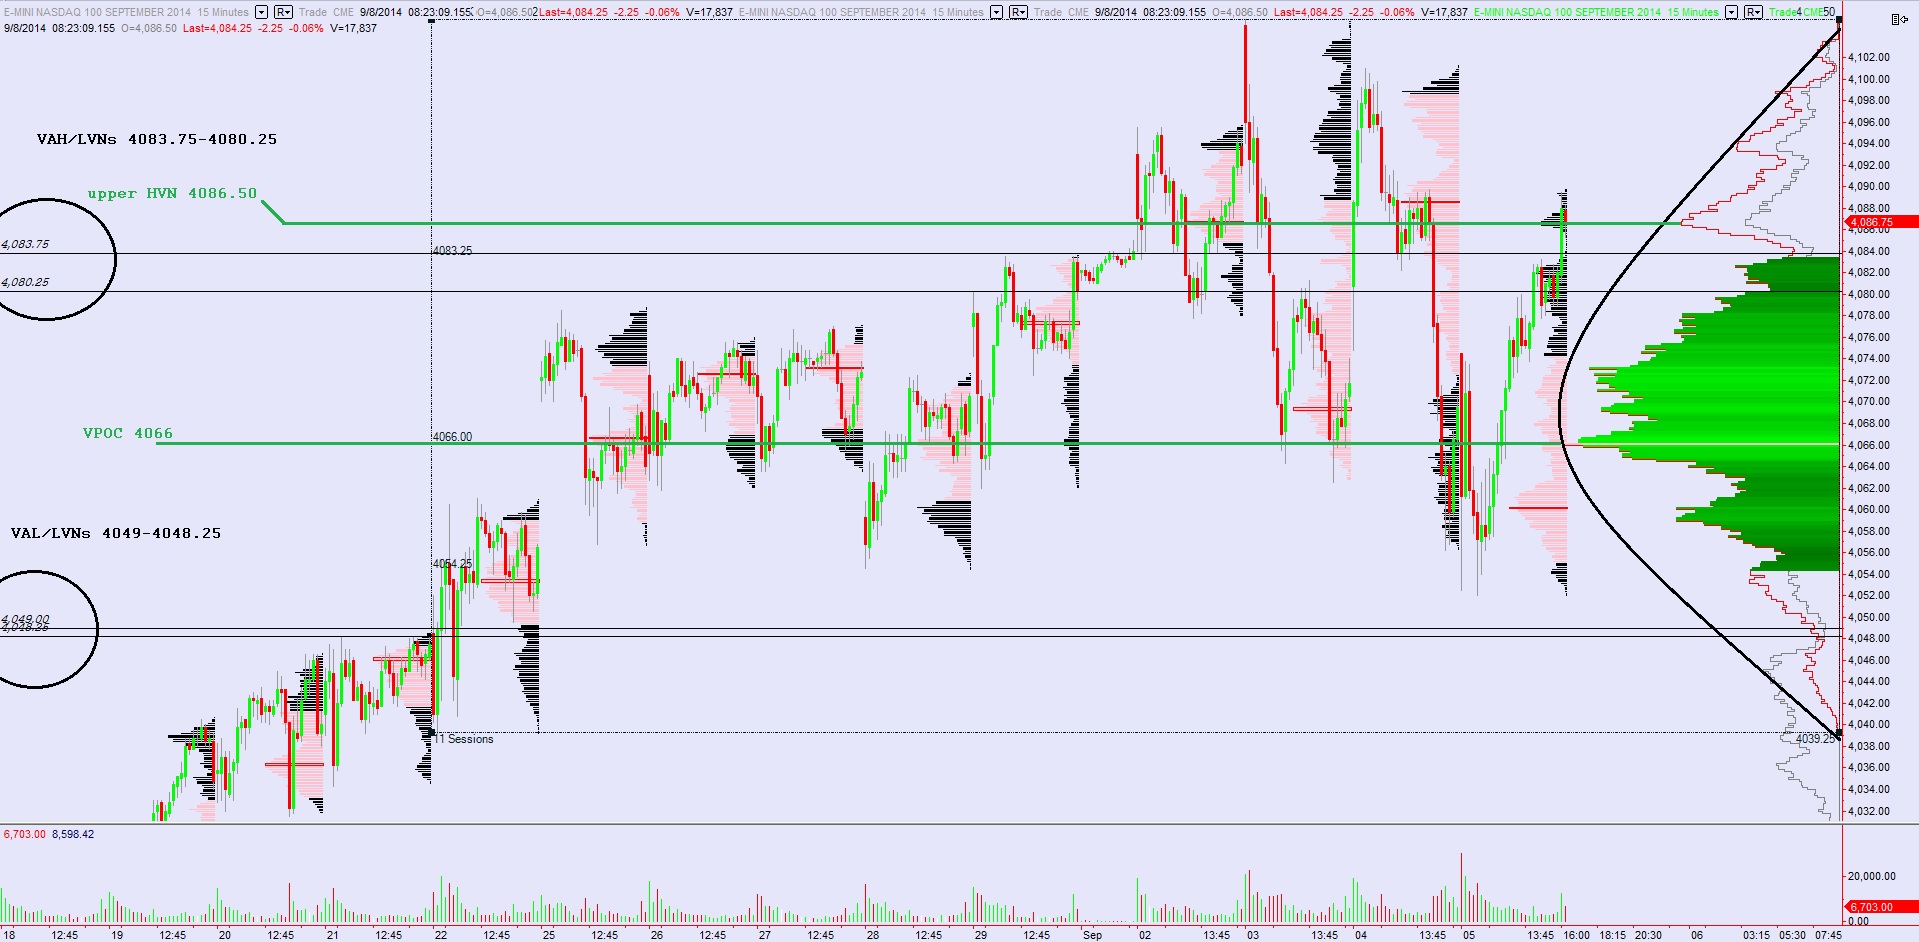
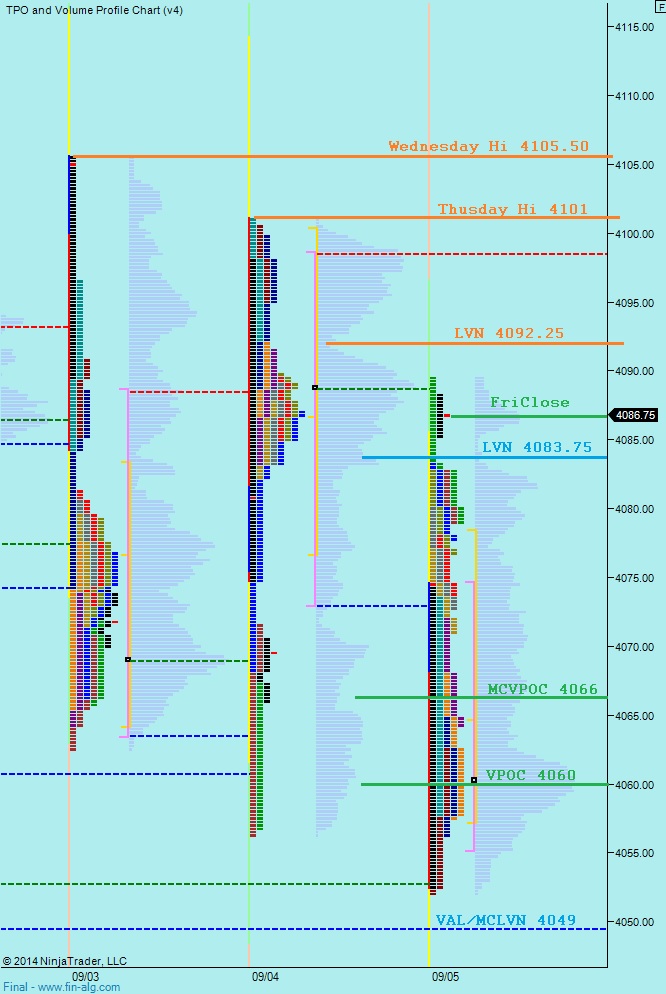
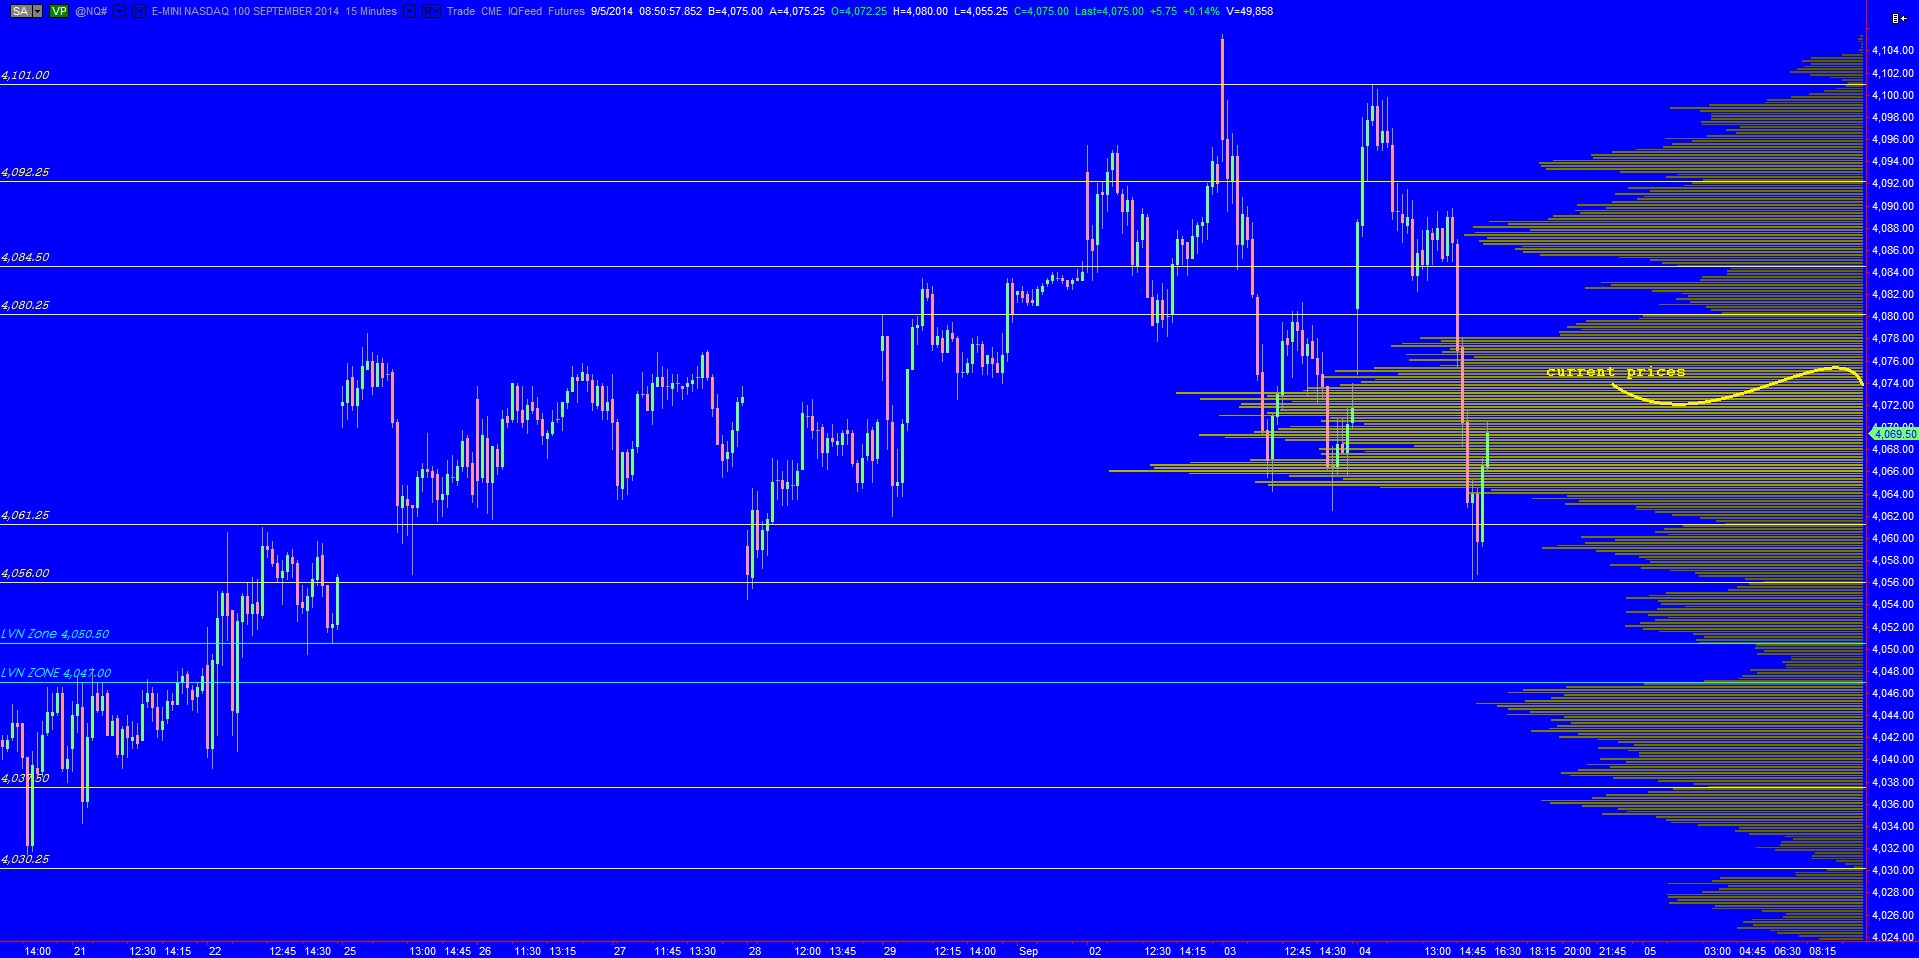
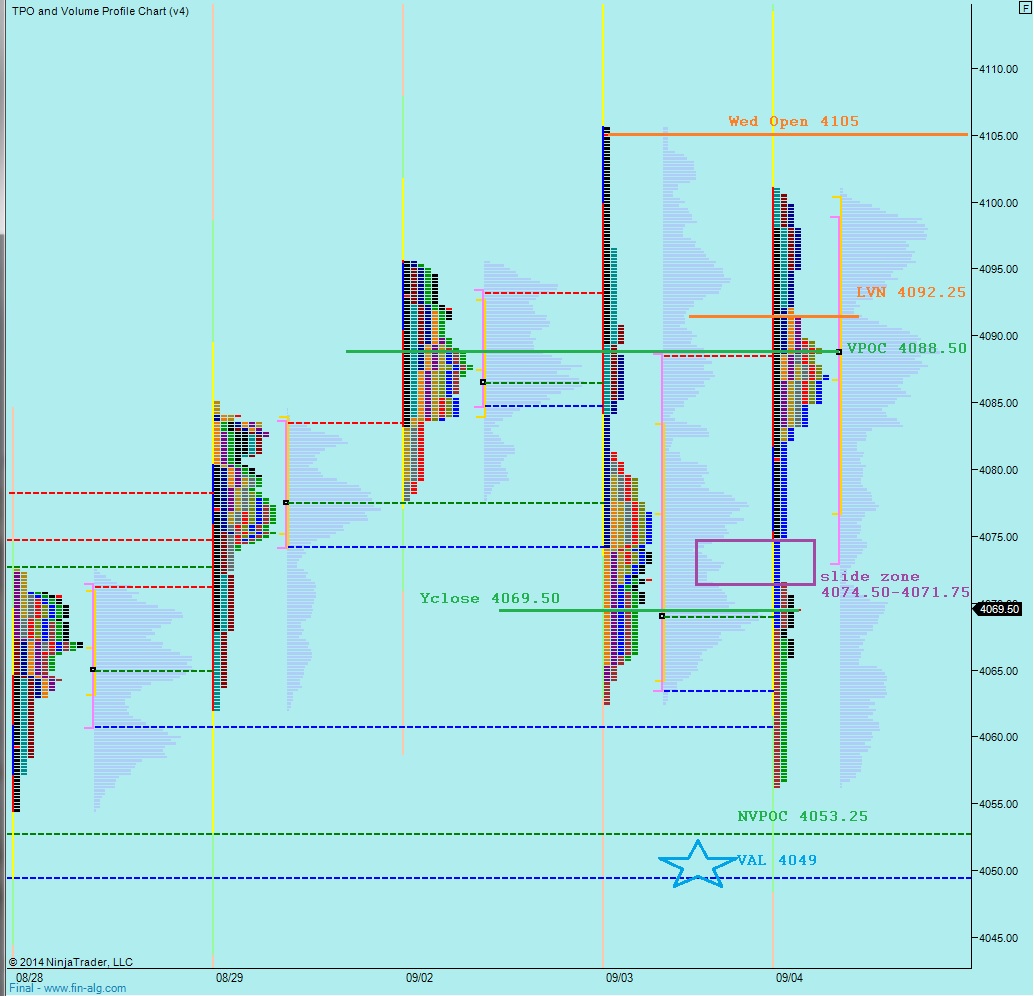
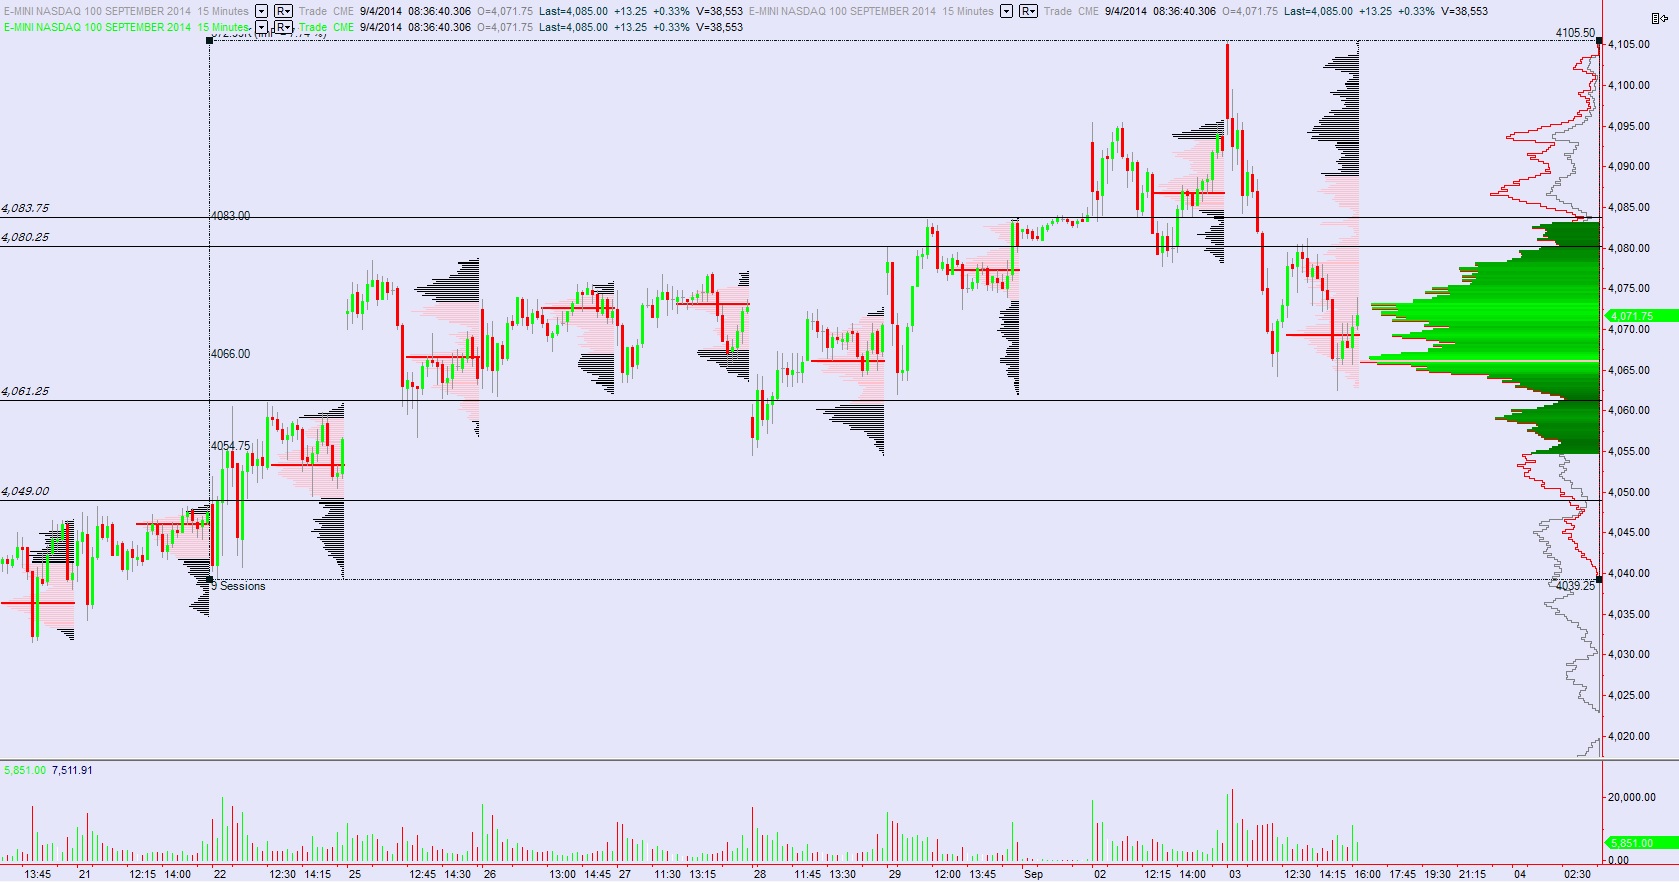
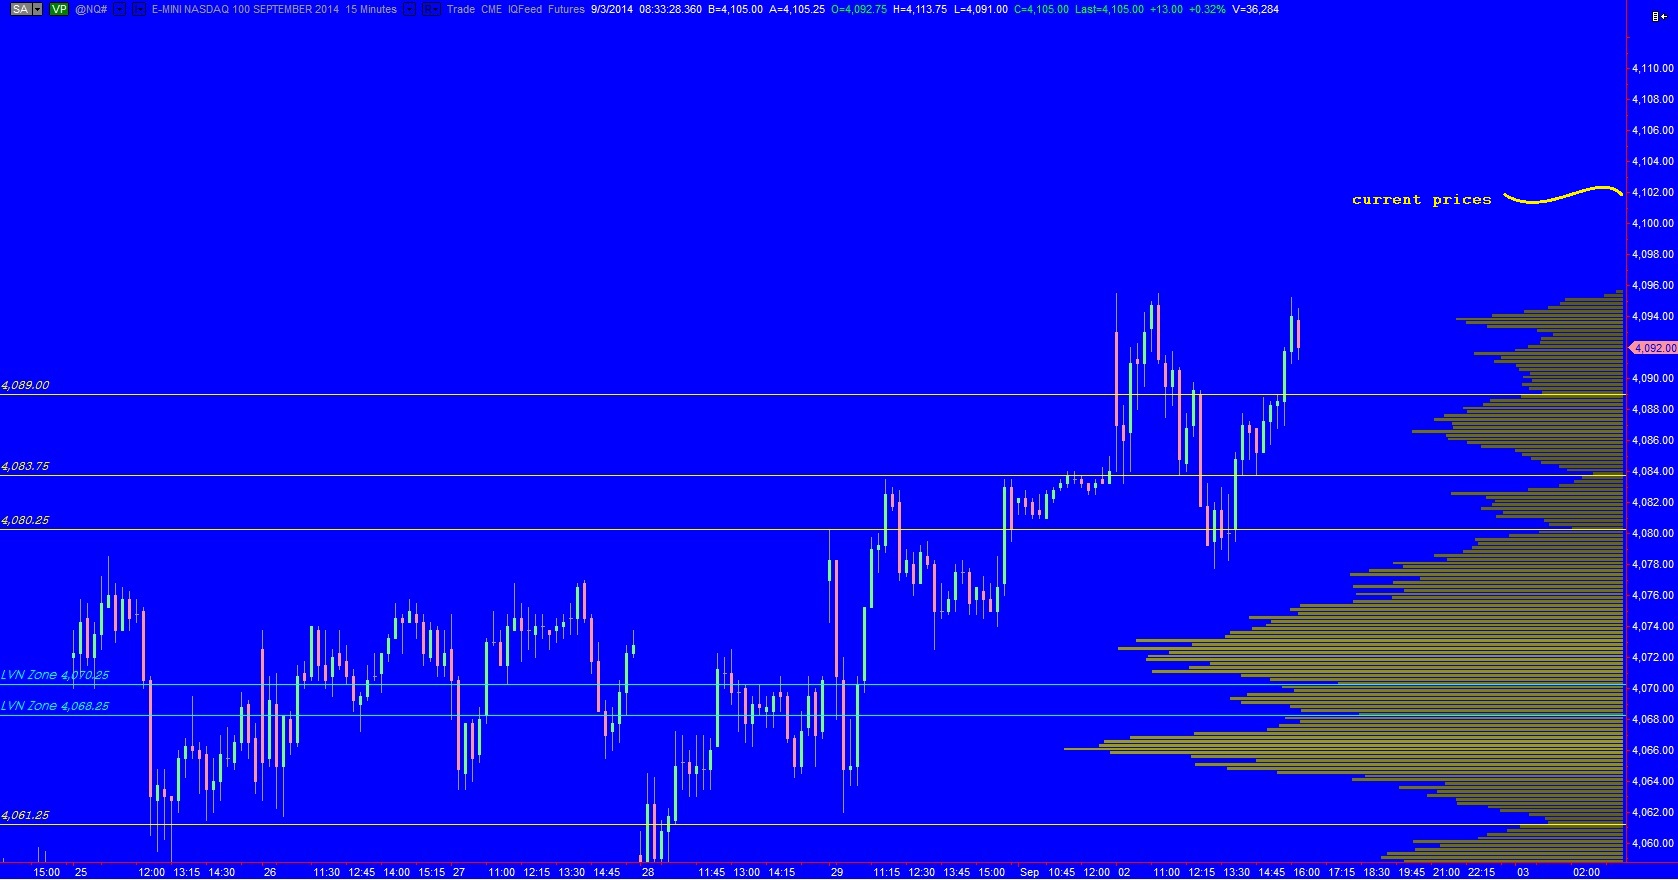
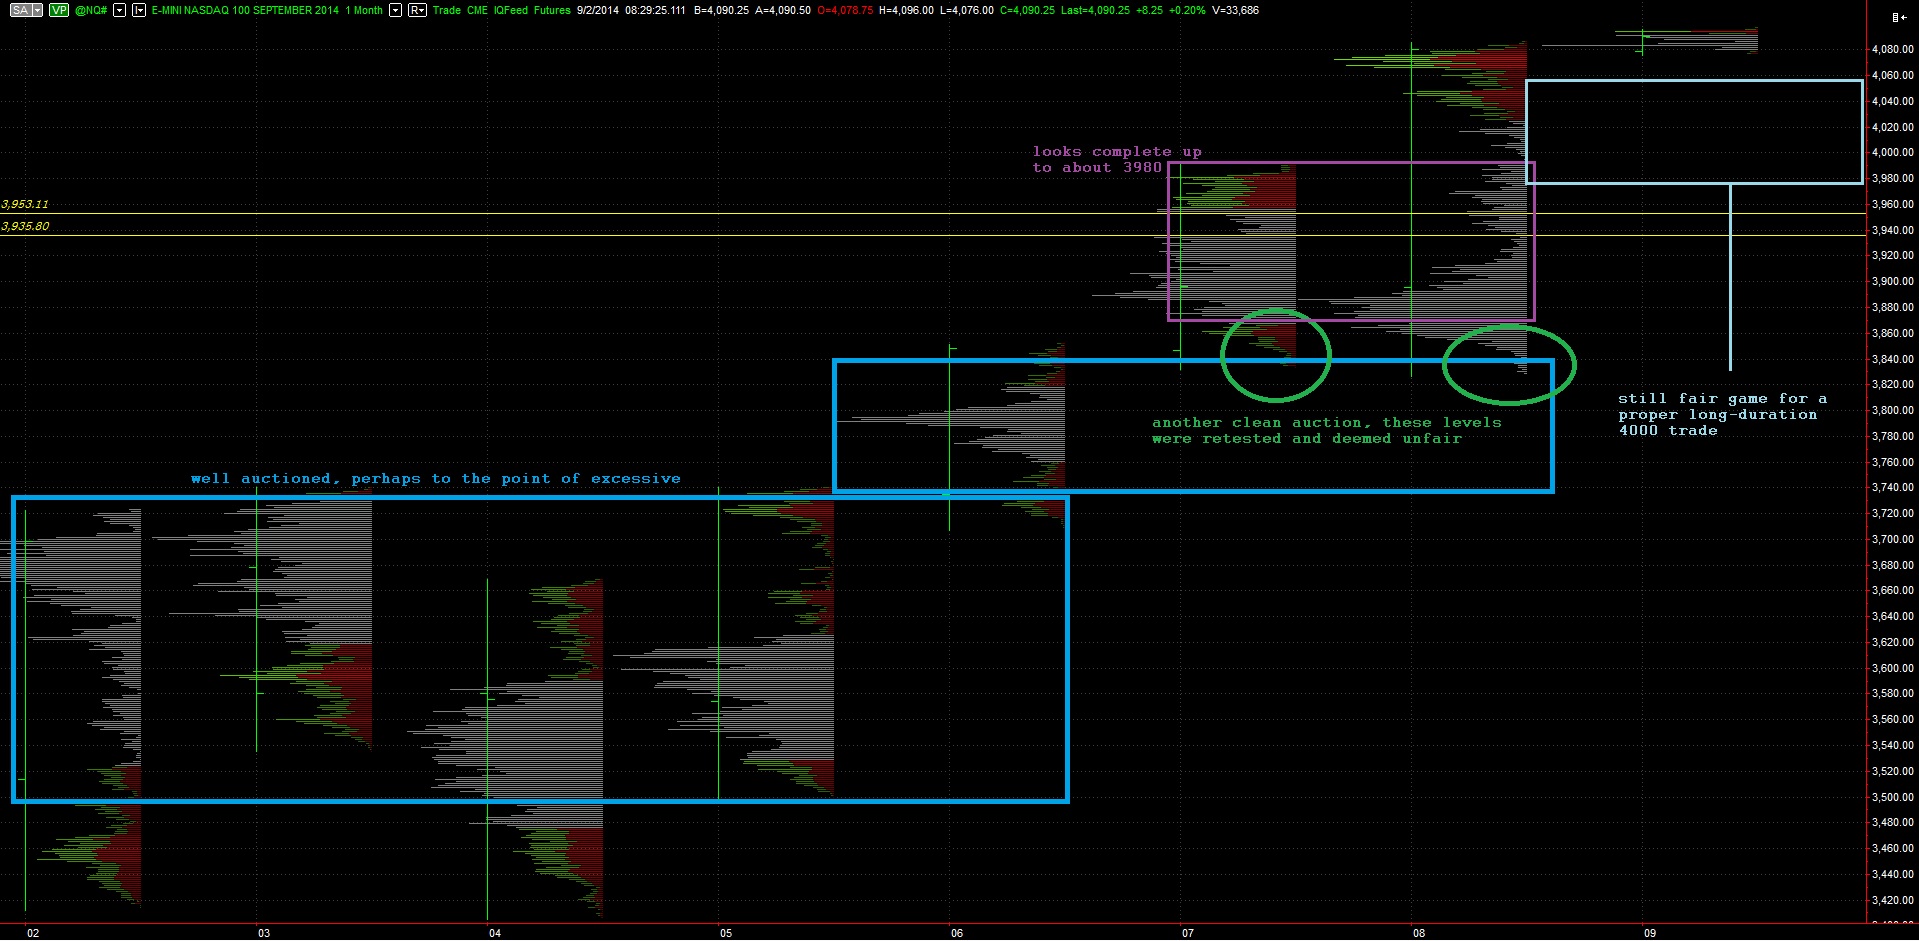
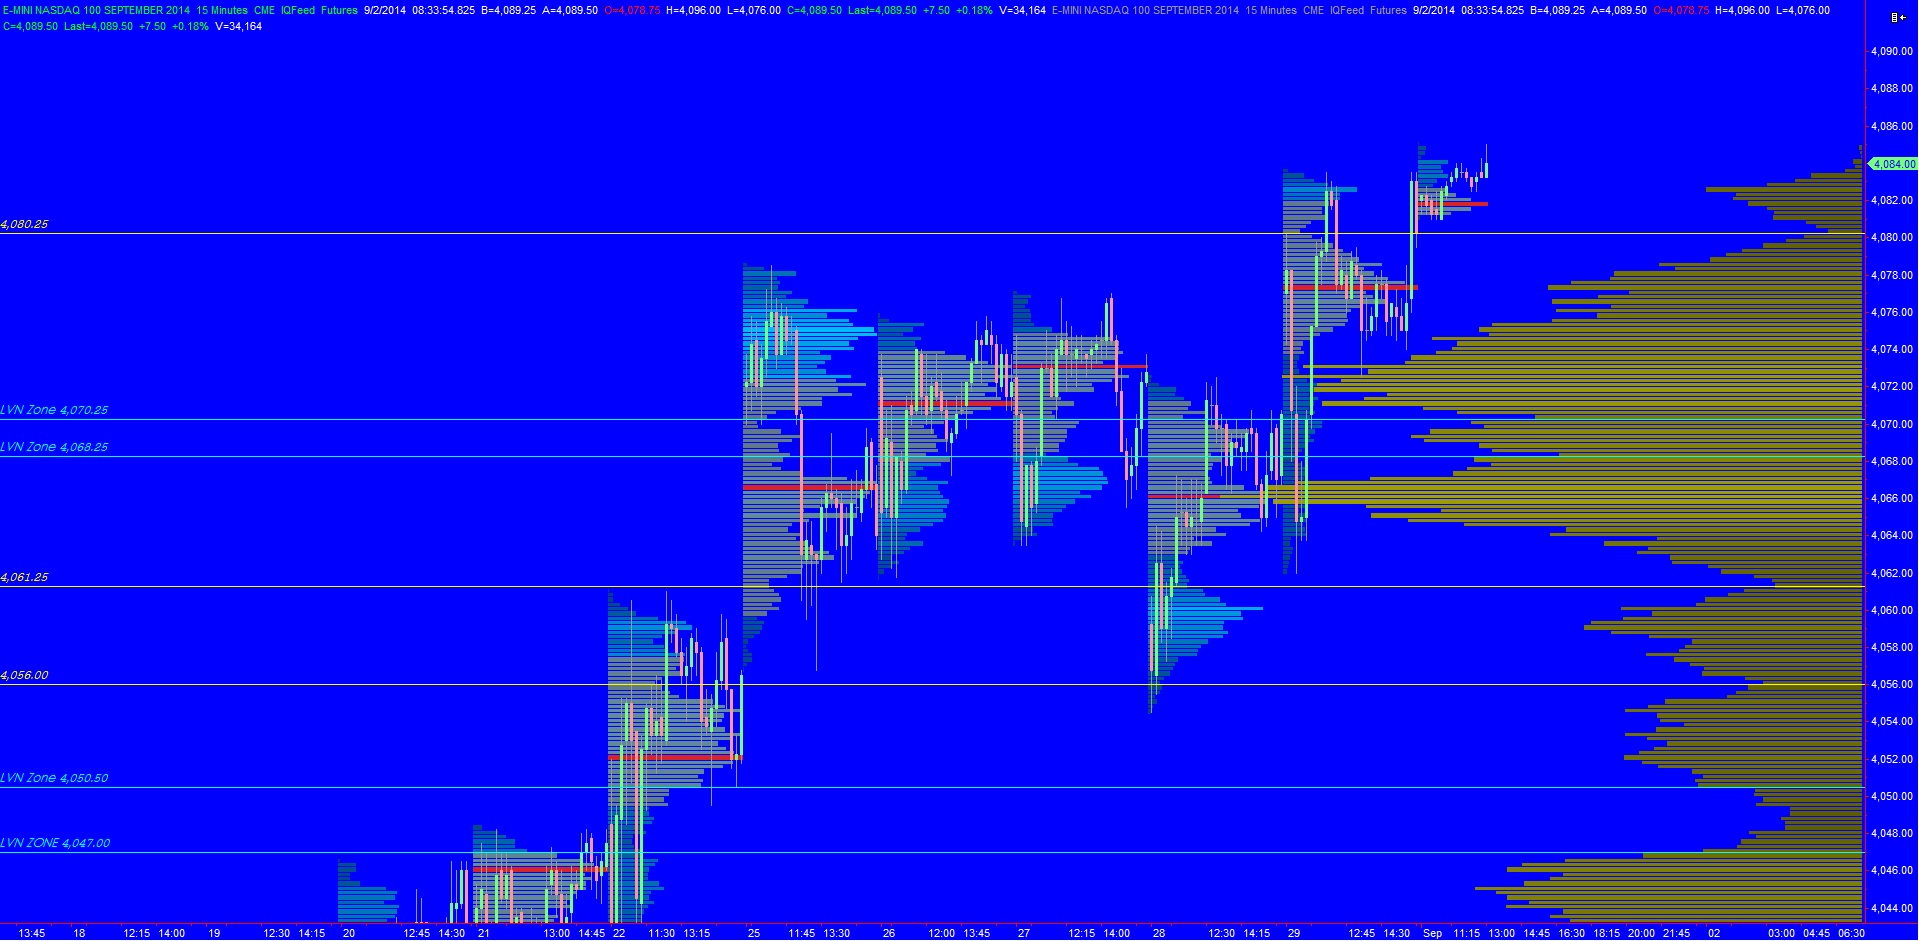
Below I present the same chart in every way except one—the first chart shows our developing balance as I have presented it for the last several sessions, with 08/22 being the point of change where our current balance initiated. The second chart instead uses 08/25, the following session. What I need your help with, traders, is determining when the CHANGE event occurred.
The implications are important for a few reasons. I will discuss these in detail if I have at least five votes. Observe the two charts below and simply leave a comment whether your think chart 1 (08/22) or chart 2 (08/25) marks the moment when a change occurred which led us into our current balance. If you feel like it, add a few notes about why you answered the way you did. See below: