iBankCoin
Home / Tag Archives: $ES_F (page 2)

Tag Archives: $ES_F

Clear Expectations for Today

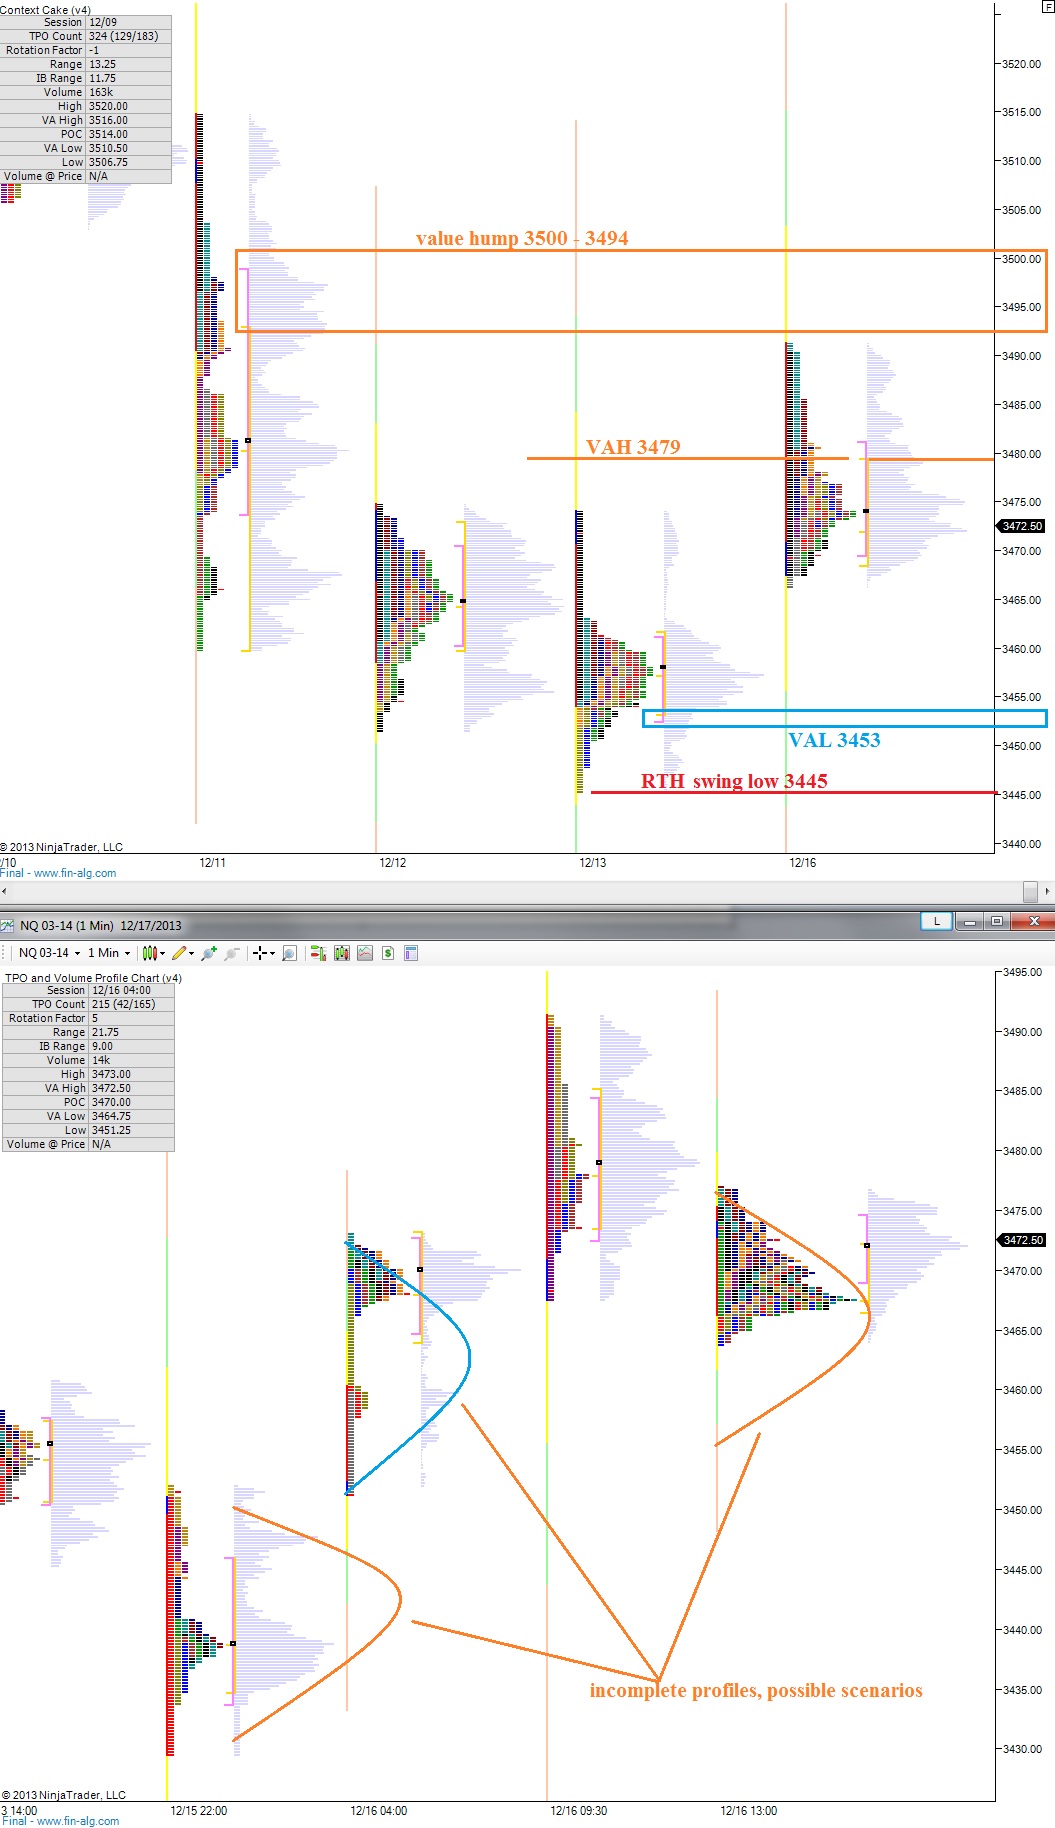
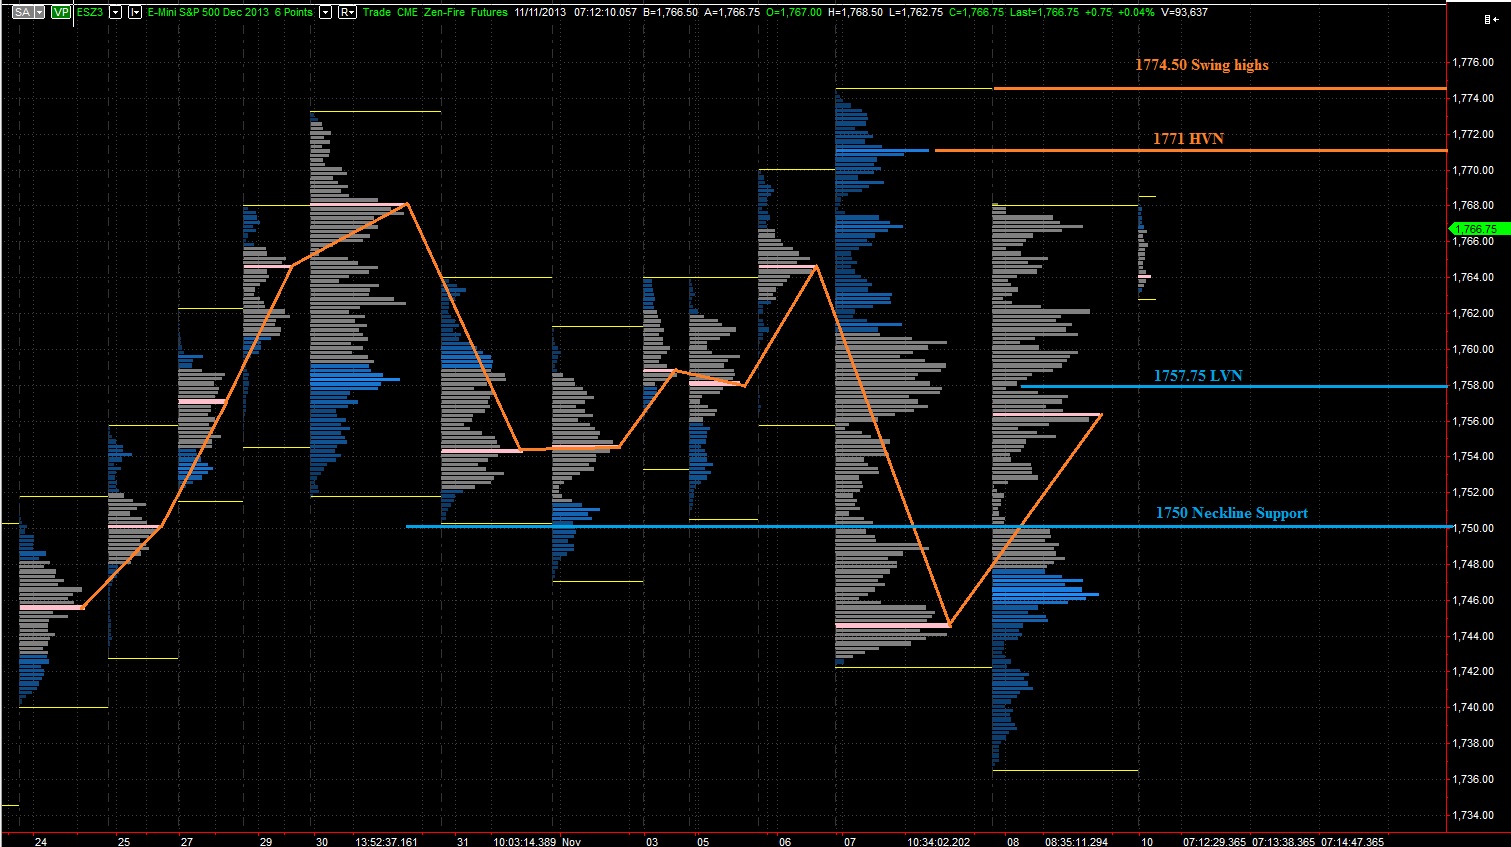
The NASDAQ futures market showed a bit of follow through on the behalf of the sellers, where price took out our Monday morning low.  However, the probe lower, likely algorithmic in nature, was met with a reactive buy force and price swiftly auctioned back into yesterday’s value range.

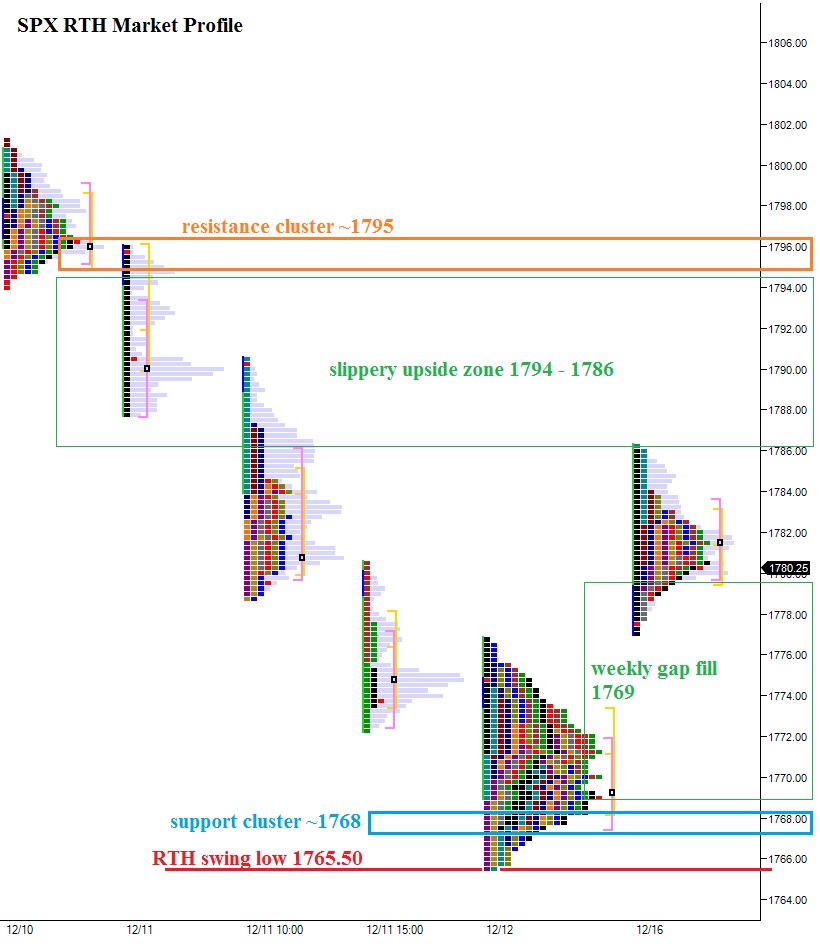
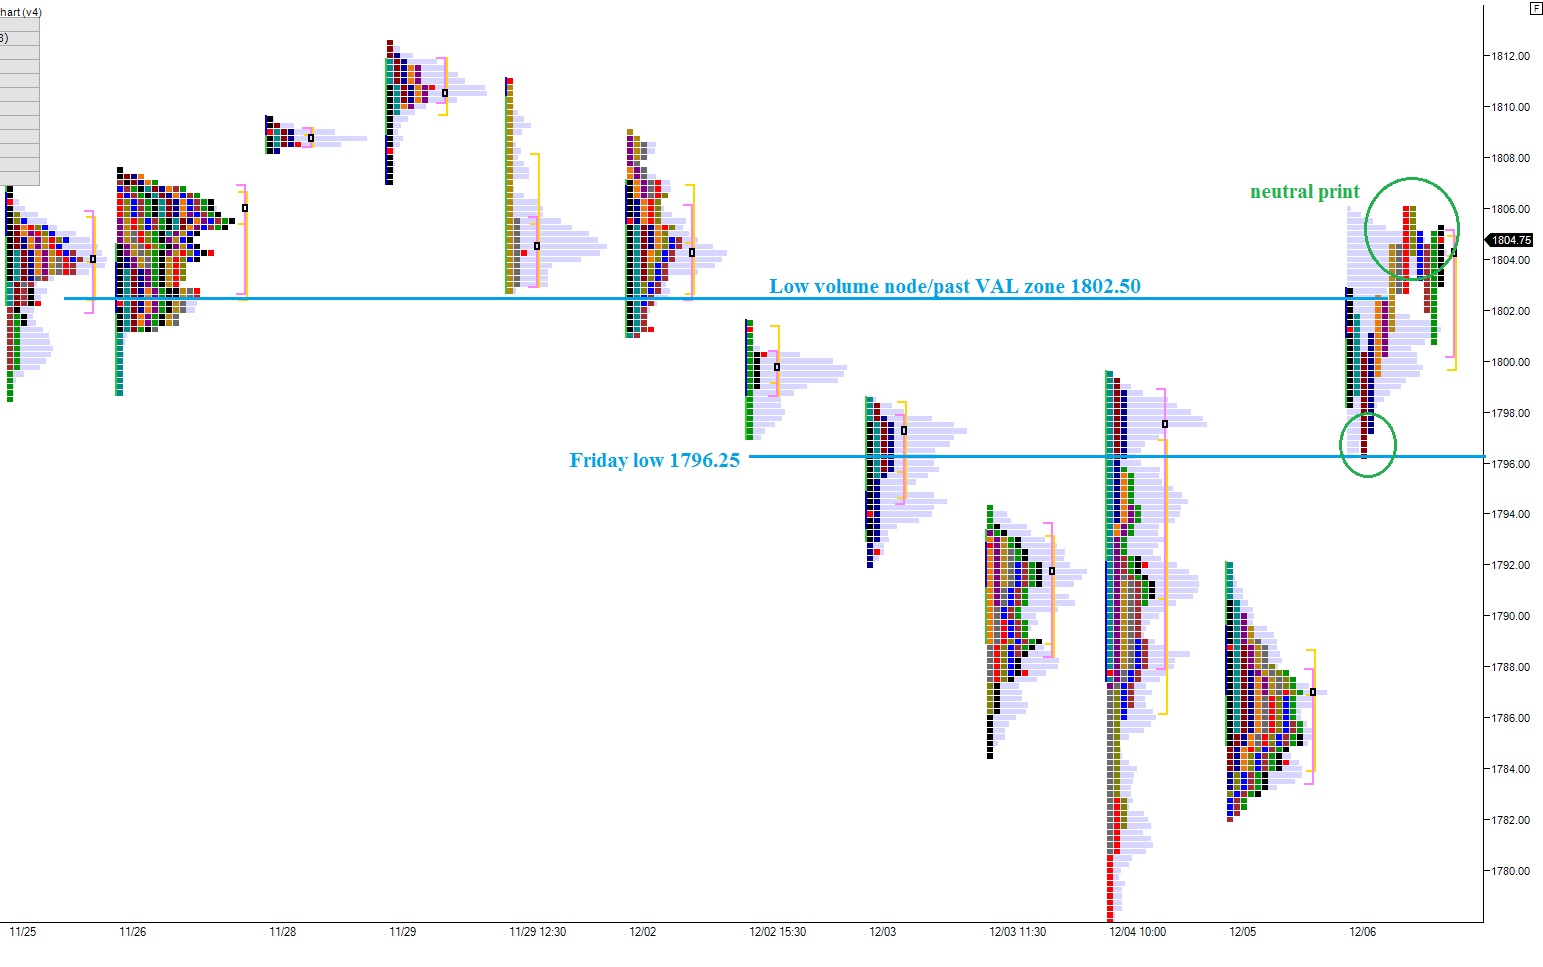
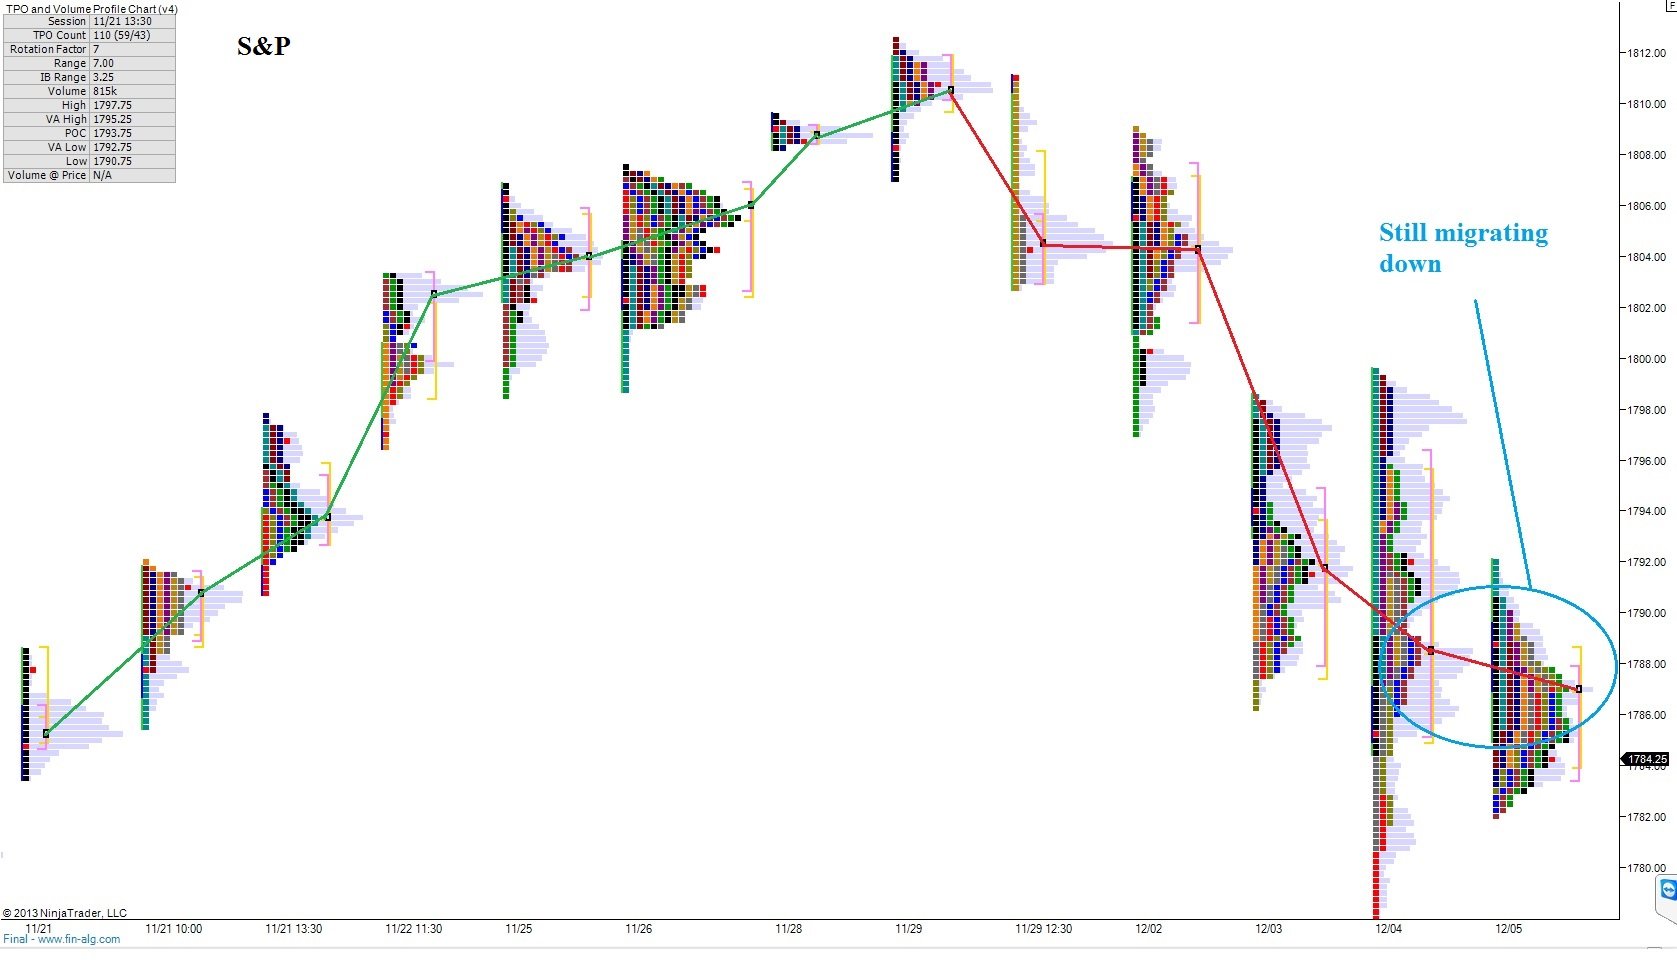
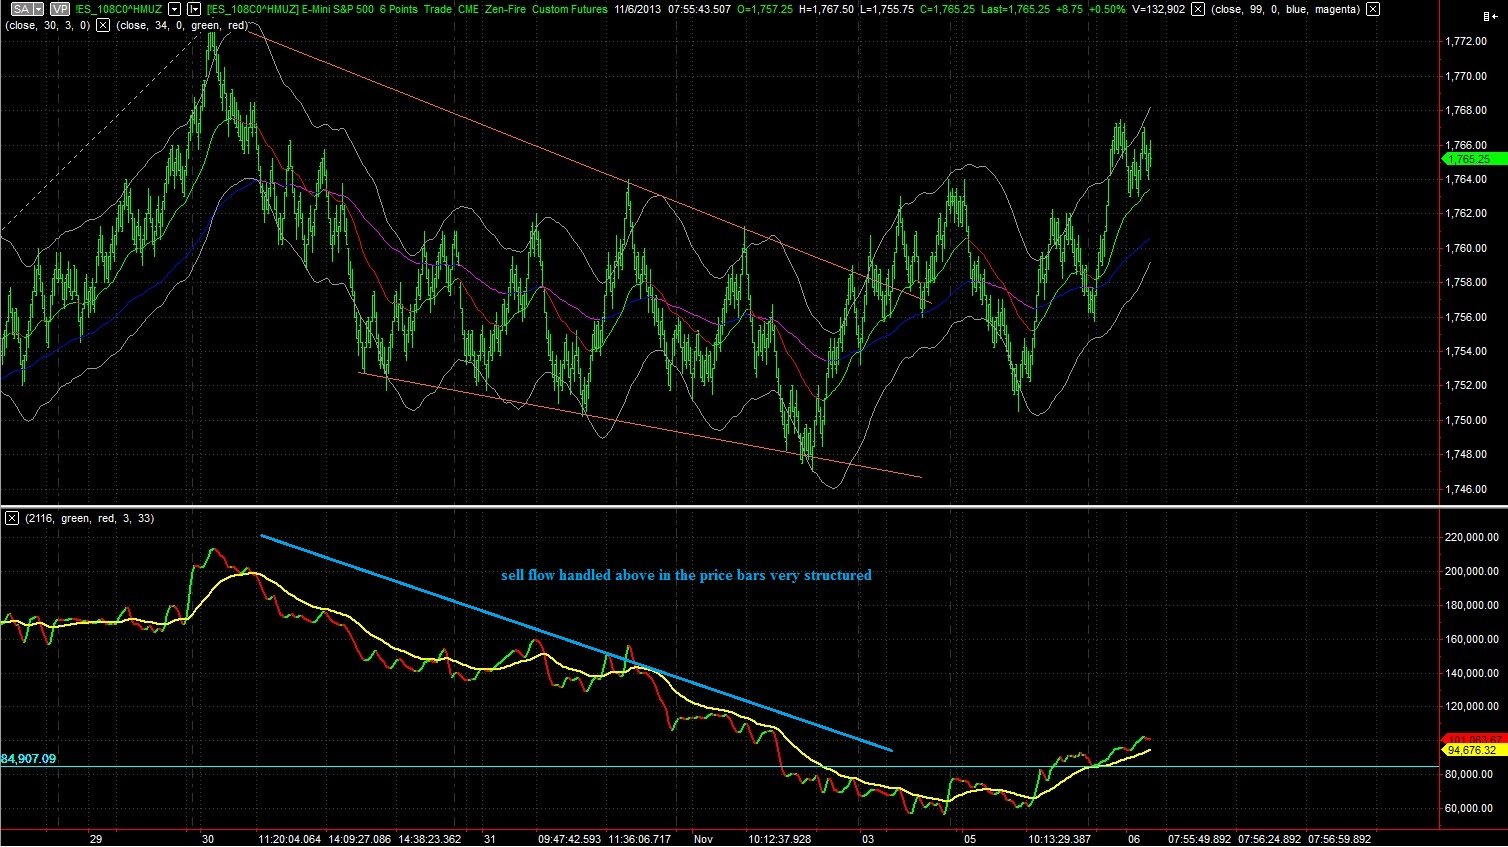
Conversely, the SPX futures made no new low overnight, instead continuing to coil.  There has been a subtle bit of relative strength exhibited by the SPX verses the NASDAQ composite these last few days including yesterday where we printed a normal dayIn market profile theory, a normal day features a dynamic open, likely driven by a longer timeframe trader entering the marketplace.  The range of the first hour is not breached for the rest of the session.  These are very rare, occurring in the SPX only five times in the last six years.  Oddly enough, we printed a normal day in the SPX on Friday and Monday.

The action suggests coiling and this uncertainty is suitable for our current situation.  We are nearing the close of a very strong year in the markets.  Many are likely closing their books early to lock in the gains, yet we have strong pockets of momentum in select industries.  The Fed, our current market moving exceptional, is experiencing a changing of the guards from Bernanke to Yellen and we have taper talks given the recent progress in the labor markets.

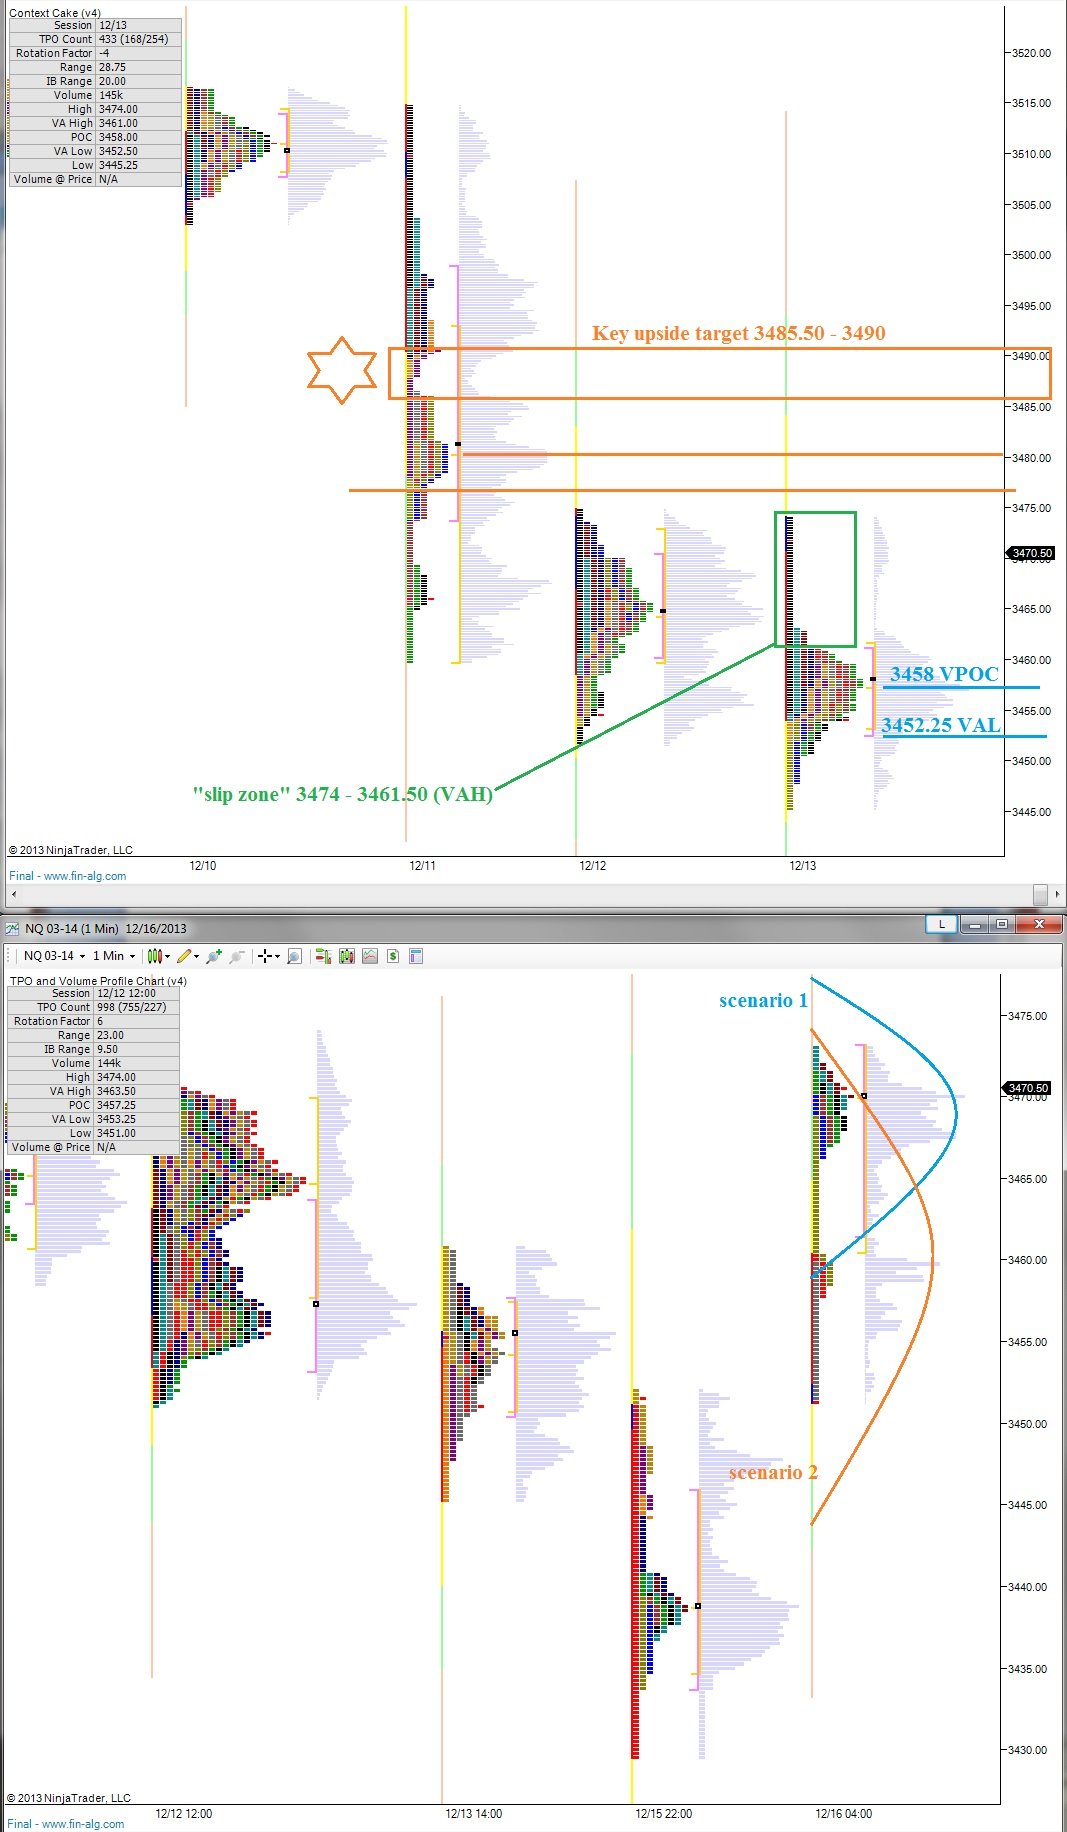
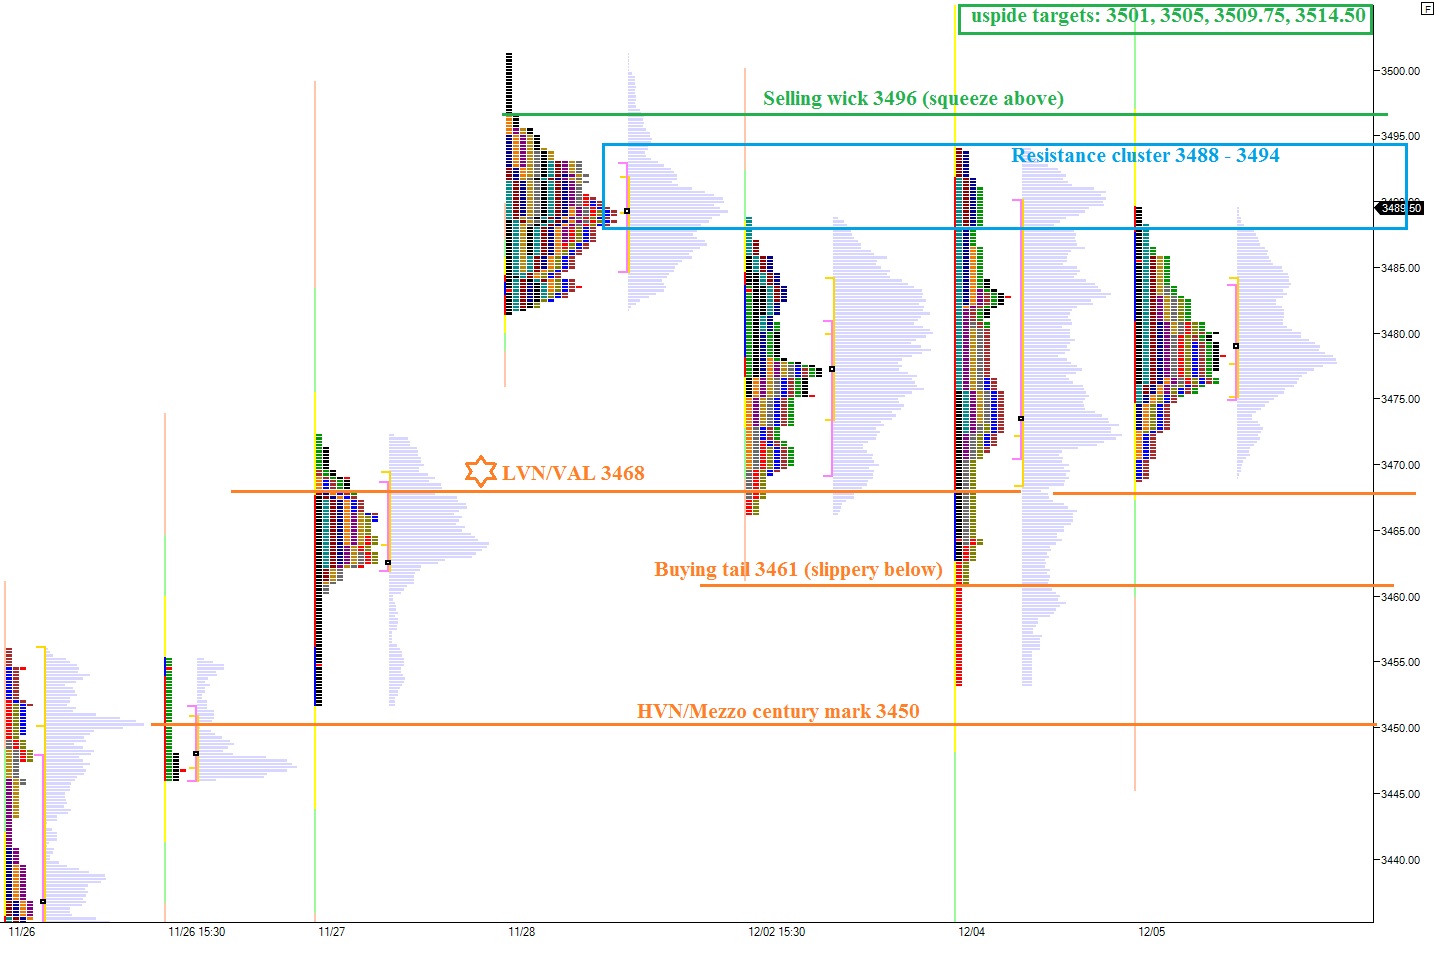
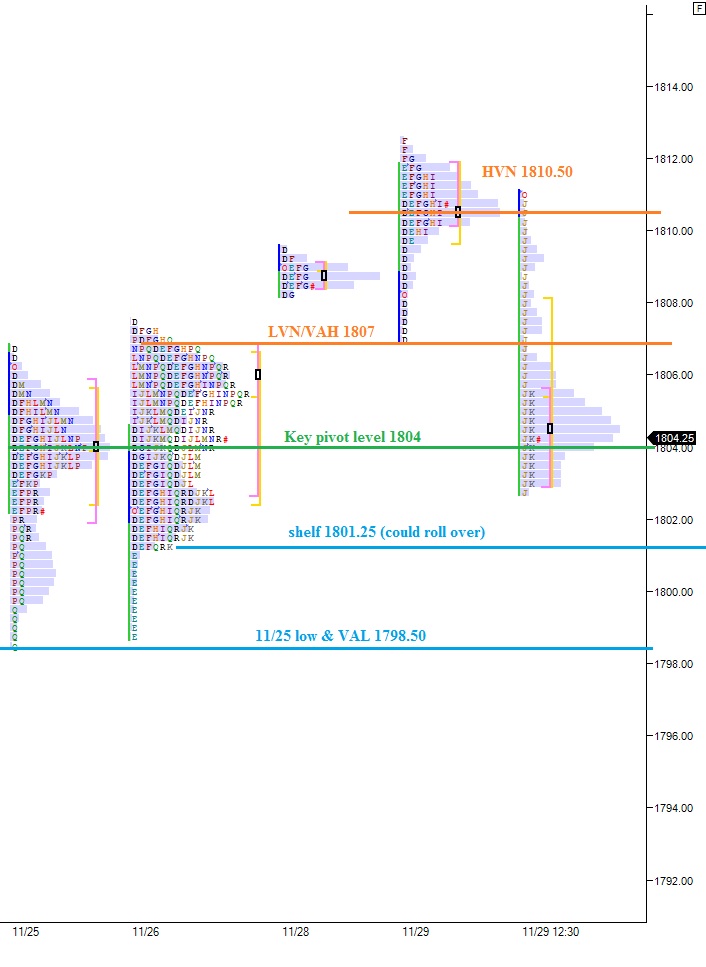
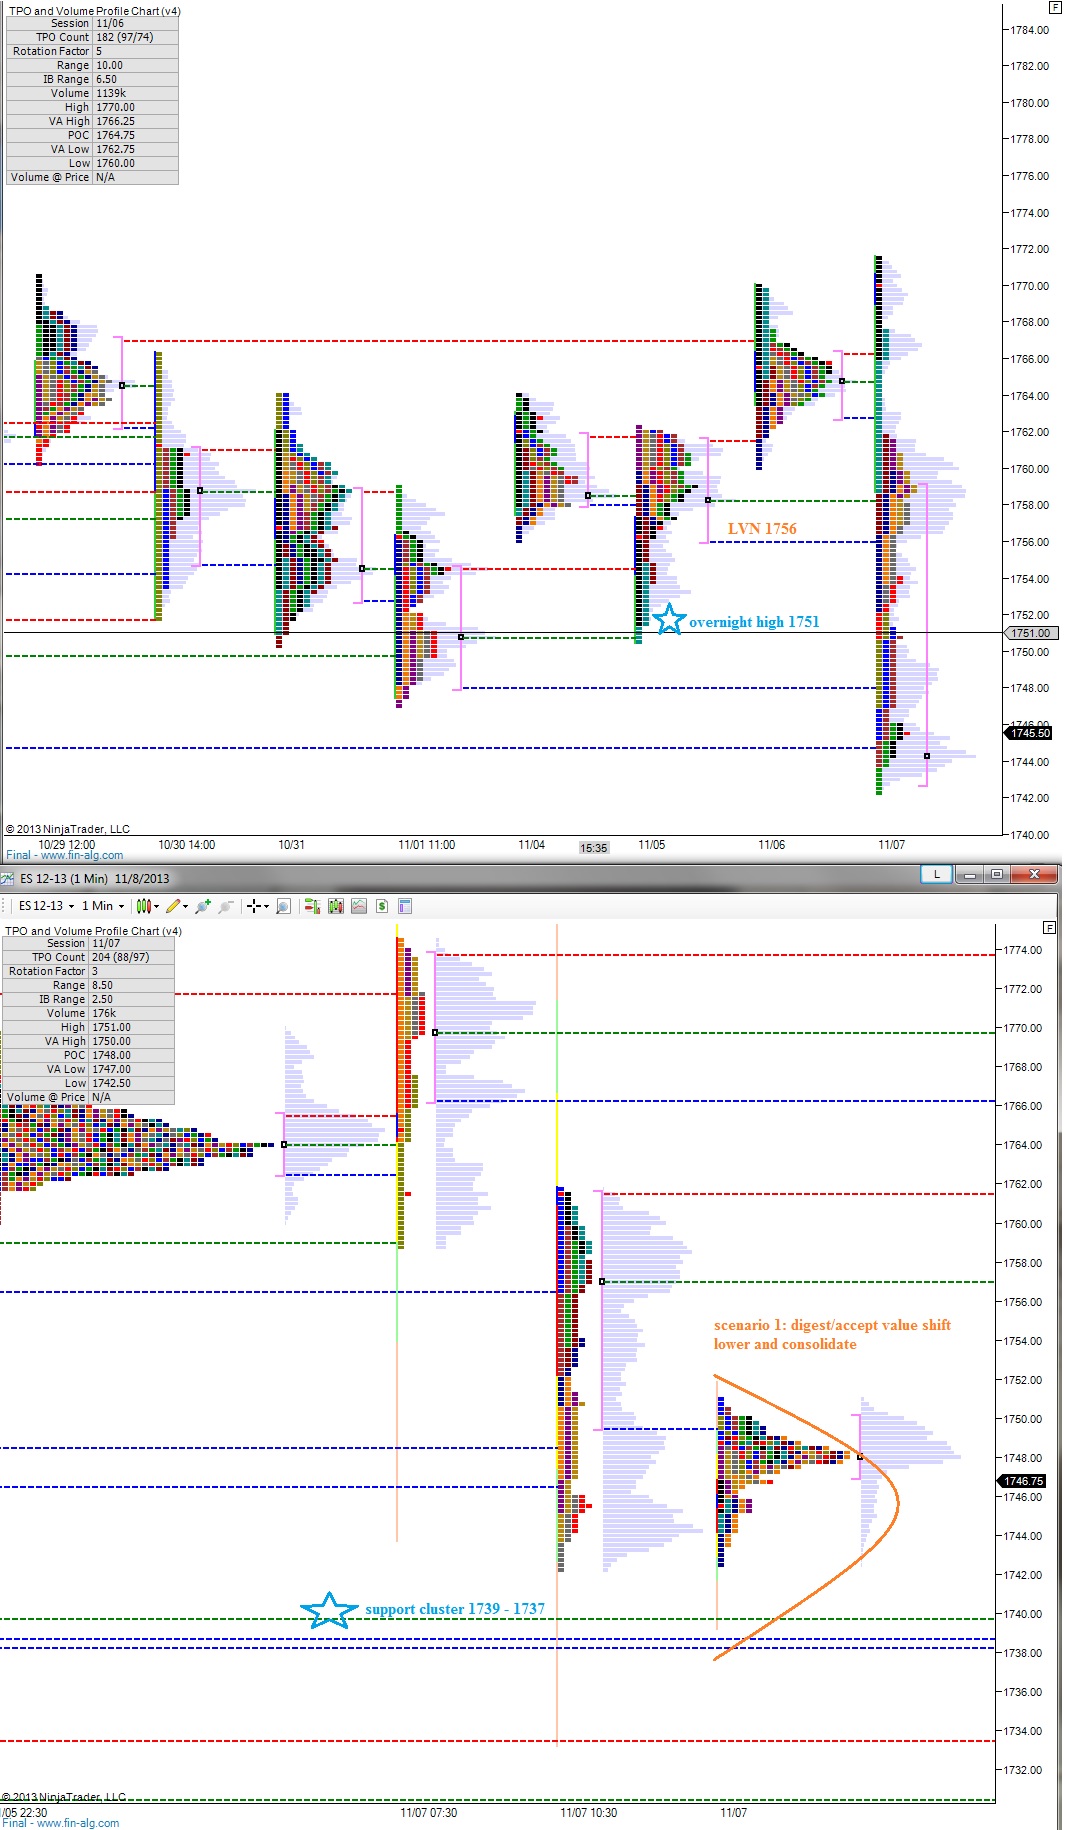
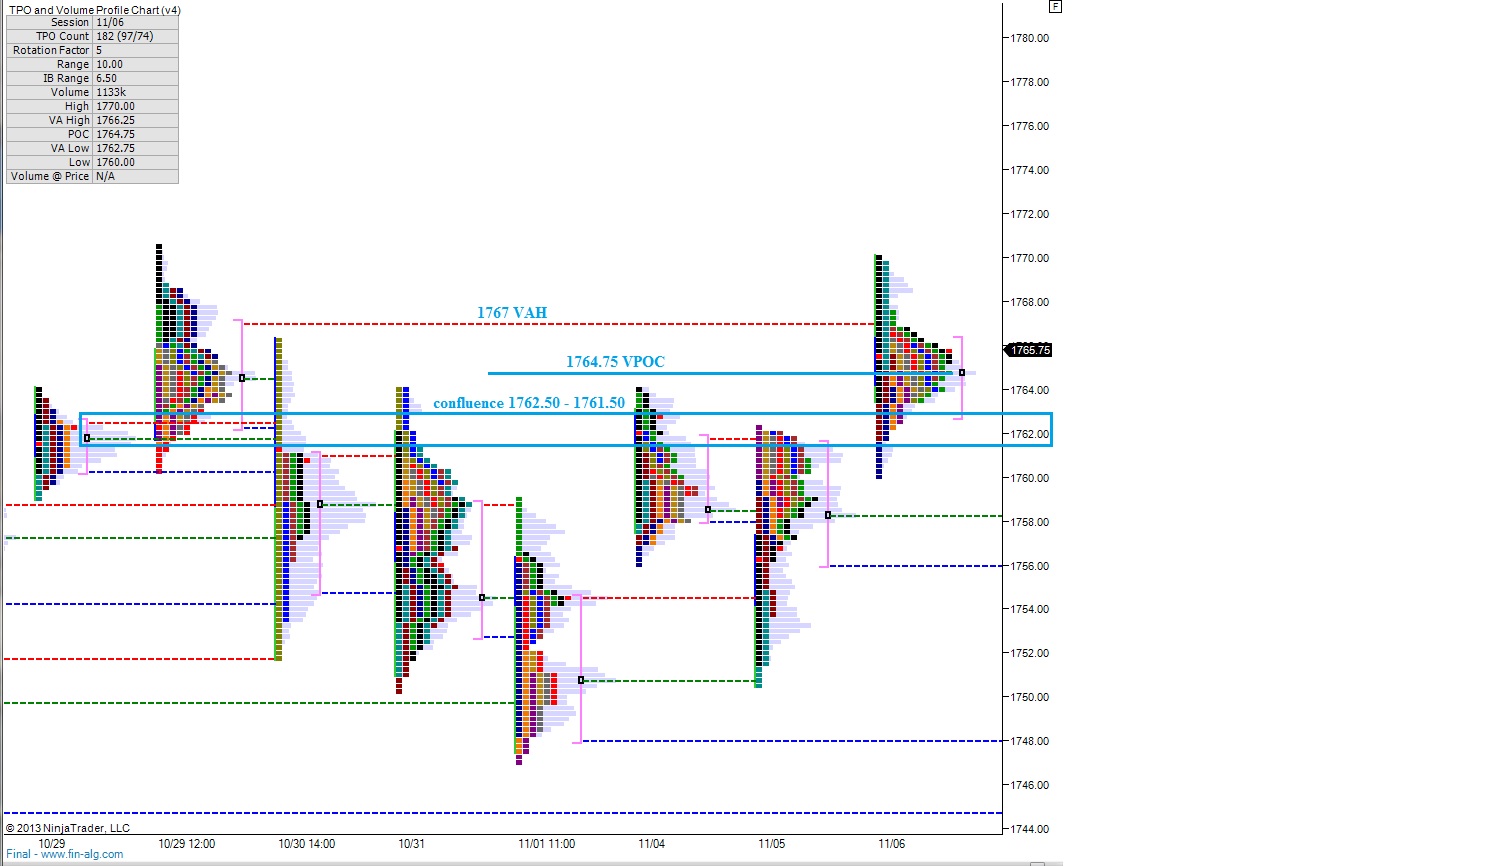
The markets have two choices today.  Either continue to coil ahead of Wednesday’s Fed announcement or move away from here.  I have bracketed both the NASDAQ and the SPX today as guideposts as the day progresses.  Keep these brackets, or support/resistance clusters, in mind today as the day progresses to measure any progress made by the buyers and sellers.

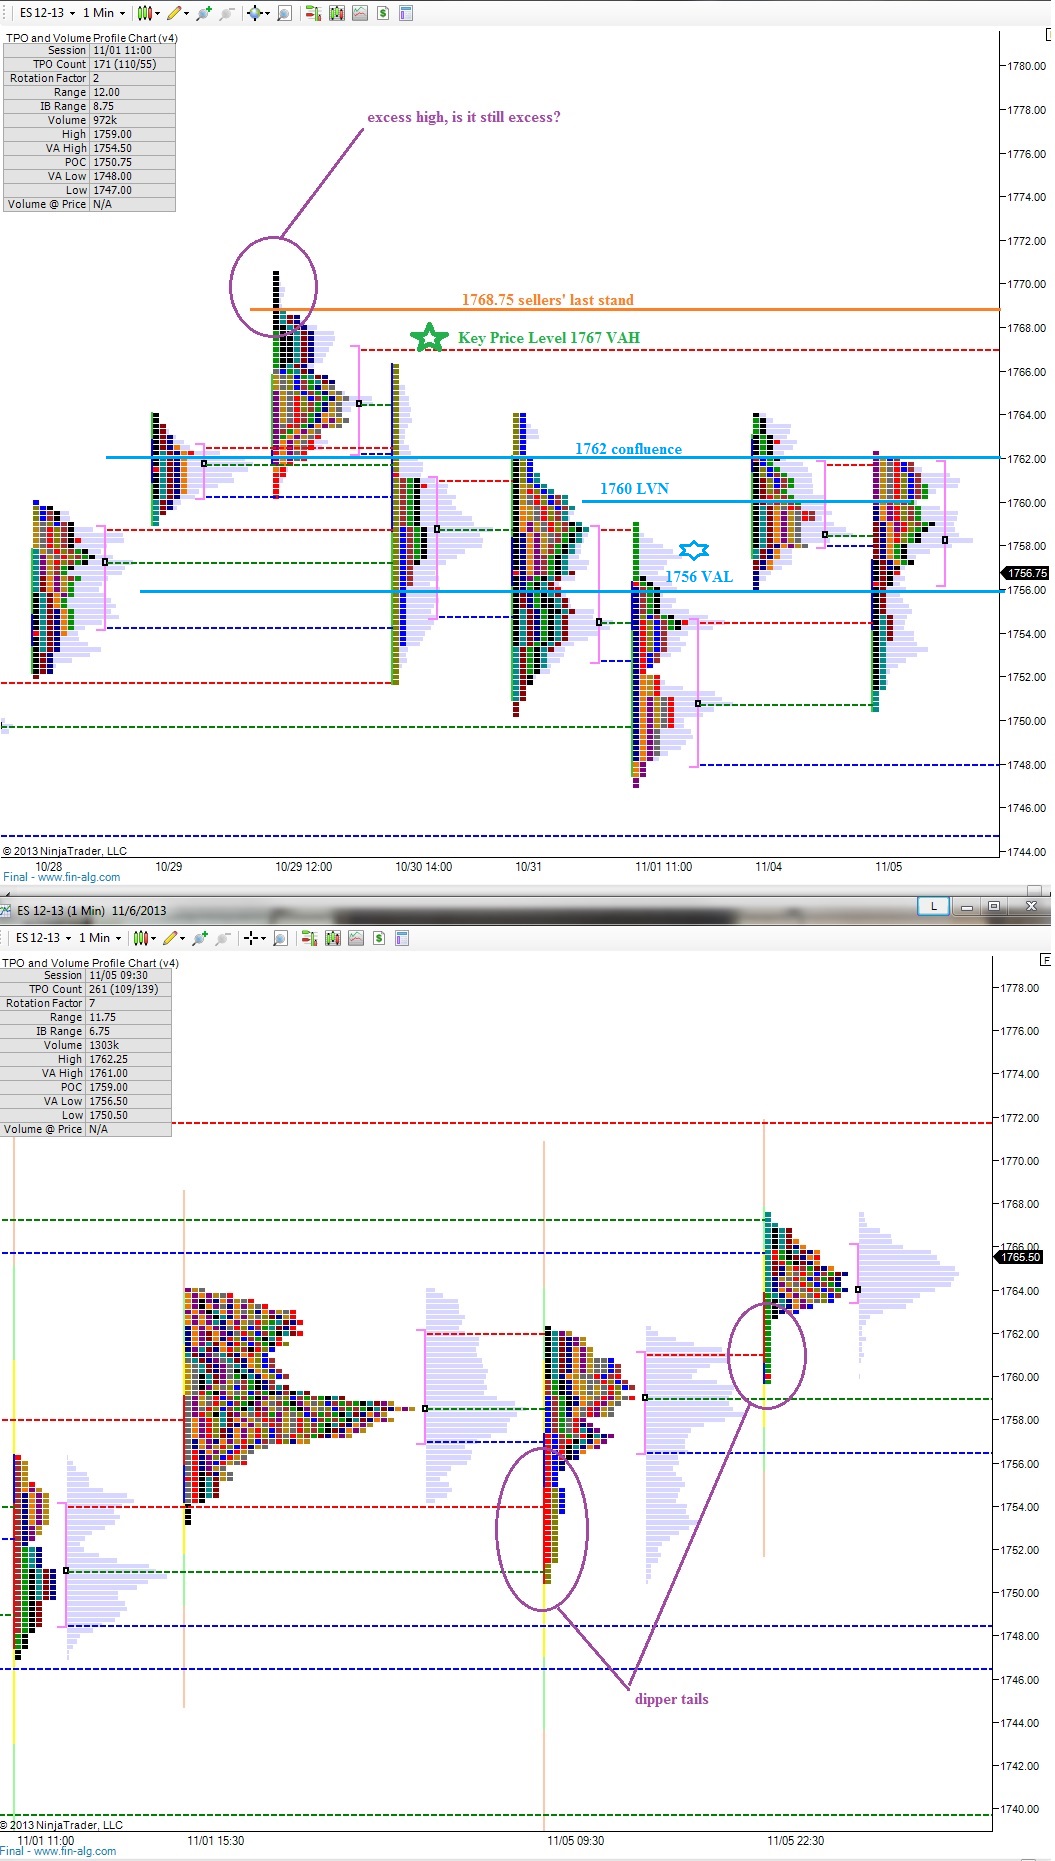
I have also highlighted a few scenarios for the NASDAQ using the 24 hour market profile chart:

ES_MarketProfile_12172013


NQ_MarketProfile_12172013

Comments »

Large Range Indecision Overnight

Note:  All price levels mentioned going forward will be in reference to the March contract. 

If you were just waking up to the market, you may be unaware of the wild ride index futures took overnight.  The S&P printed over a 20 point range in the overnight session after reversing early weakness.  The Nasdaq traded over 40 points in range.  In short, last night featured violent indecision of the overnight/low volume variety.

As of 8am, the S&P is set to open above Friday’s range which tells us we are in a high risk/reward environment.  The NASDAQ is not quite above Friday’s range, but is outside of Friday’s value which gives us a similar context to frame our day.

Early on it will be interesting to see if sellers can reject the overnight progress and press back into Friday’s value.  Turning our attention to the NASDAQ, we are opening in the slippery single prints from early Friday where sellers aggressively auctioned lower.  We may see a similar push from sellers early on and should monitor trade at 3461.50 which marks the value area high on Friday’s session.  Below there we have a VPOC at 3458 and a value area low at 3452.25.  Short sellers will be on the lookout for a rejection of this range as it may signal a bullish reversal is materializing.

I have noted these levels, as well as key resistance points and a few possible scenarios on the following market profile charts:


NQ_MarketProfile_12162013

Comments »

Powder Keg

The equity markets opened Sunday evening only to find buyers interested in increased exposure.  Since then price has behaved orderly, consolidating the overnight gains and positioning price outside of Friday’s price range and value.

Should prices on the NASDAQ composite sustain trade over 3511 into the opening bell, we are opening out of balance, and the risk of a violent move is high.  However, if I have correctly identified where were are currently trading within the sentiment cycle, we are deep in denial, which may produce muted trade.

The S&P is currently trading only two handles above Friday’s closing price which leaves the door open for a gap fill lower.  Early on, perhaps even pre-market, we may see sellers coming in to close the gap.  More important contextually than the gap however, is the low volume node we printed on Friday’s S&P volume profile at 1802.50.  This price level set value area low several times in November and on Friday the action from buyers was dynamic enough to leave a low volume, fast moving footprint.  Should the sellers quickly reject us back below this level and sustain trade for over an hour, we may be in store for further downside.

The NASDAQ is currently trading eight handles above its closing print showing greater strength early on.  I will be watching the overnight swing low at 3506.75 to measure bullish appetite early on.

Overall, the action looks ripe for a rally however it is paramount we stay objective in our analysis and accept and define price levels which may negate our thesis.  I have highlighted the low volume zone on the S&P on the following market profile chart:

ES_MarketProfile_12092013

Comments »

Focusing on The Auctions Only

The markets auctioned very methodical all week ahead of what is likely to be an interesting Friday.  We tracked the control of sellers which began on Monday and came into question Wednesday with a violent neutral session.  Thursday the market told us it accepted the current prices by balancing out inside of the large neutral day and is waiting for new information before exploring elsewhere.

Overnight the NASDAQ divided itself into three micro sessions by auctioning then breaking a bit higher, auctioning then breaking higher, and finally auctioning as the USA come online.  The action overnight suggests buyers have the early edge.  However they have also pressed us into very short term overbought conditions.

Taking a look at the longer term via value migration, you can see the relative strength of the NASDAQ verses the S&P:

ES_1205_migration NQ_1205_migration


Early on we have employment data which may better set the tone for our session, but the following reference points will still be relevant in determining whether the market is breaking out of balance to the upside or the downside:

NQ_MarketProfile_12062013


Comments »

Morning Index Glance

The NASDAQ continued displaying relative strength verses the S&P 500 overnight, albeit mildly.  The composite index was able to make new swing highs during the overnight session where sellers were quick to greet the move.

As we work into the early hours of USA time, prices have balanced out and are slightly higher than last week’s close.

During today’s session, I am interested to see whether or not the lagging S&P breaks recent lows or instead continues consolidating/grinding higher.  Put quite simply, I will be monitoring the 1800 price level.  Should we sustain trade below 1800 for a prolonged period of time, I may reduce select long exposure.

I do not want to see the NASDAQ (as represented by the /NQ contract) below 3488 for a prolonged period either.

I have highlighted the levels I will be observing on the S&P today on the following market profile chart:

ES_MarketProfile_12022013

Comments »

/ES Levels to Watch

The futures opened for trade Sunday evening mostly flat, and spent the overnight session basing sideways in a balanced manner.  The /NQ, our futures contract for tracking the NASDAQ, is currently trading 2 point below Friday’s close of 3361.25.

The sharp rally on Friday was effective at moving price higher and closing near the height of the session, but value failed to migrate to the uppermost distribution on the day.  Instead our VPOC printed at 1756.25, almost 10 handles below the closing print.  Early on this week, it will be interesting to see how this relationship plays out and whether price migrates back to value or conversely value migrates higher.

A key level to monitor while determining whether price will revert back to value is the low volume node at 1757.75.  Low volume nodes represent moments where prices moved rapidly and little volume was traded at a given price.  It suggests strong conviction transactions occurring by a longer-term timeframe trader.  If price were to cut through the low volume mode and then spend time trading below the level, it would suggest a sentiment shift.

Traders will be keenly observing the low price level on the S&P this week as we attempt to determine whether the market is in fact setting up for a performance chase into year end.  If we cannot hold the lows, we may roll over into year end.

1750 is another key level of support  to watch if the market begins heading lower and is one of the last defensive lines for the buyers.

I have highlighted the above price levels as well as two important resistance points on the following volume profile chart:


ES_MarketProfile_11112013

Comments »

Pre Announcement Morning View

The following morning view is presented prior to 8:30am employment information which may shift the outlook of the session.  Check the comments below for added commentary.

The market has been trying to go higher during the entire month of November and also during the final days of October.  Yet it hasn’t.  Yesterday the S&P rose to a new high marginally after a somewhat unexpected rate cut by the European Central Bank.  At that point we witnessed a failed auction where price was sharply rejected by sellers.

We spent the duration of the session pressing lower and even established value at the low of the session.  It now seems the market is trying to go lower, and the concept of sell flow or a large sellers’ presence in the market seems more reasonable.

Overnight we saw a bounce in the futures until the early US hours.  Since around 6am the sell flow has reemerged and we are well off the overnight highs.  The sellers continue to exhibit control on the tape overnight, they are exhibiting control of the intermediate term auction, and the long term auction is still dominated by buyers.  I use the following value migration chart to justify sellers controlling the intermediate term auction:

ES_MarketProfileMIGRATION_11082013

Paramount to the buyers regaining control would be for price to trade back above our overnight high at 1751.  There is a low volume node in yesterday’s profile at this level and also at 1756.  Climbing price back above these levels would suggest the elements that provided sellers with conviction have materially changed.

Below, I am keen on the support cluster from 1739 – 1737.  Should sellers blast through this zone with little recourse, we could be in for much lower pricing.

I have envisioned a scenario for today’s session, as well as highlighted the aforementioned price levels on the following market profile charts:

ES_MarketProfile_11082013

Comments »

ECB Ignites The Tape With a Suprise Rate Cut

Stock futures were mostly quiet with a bit of seller’s bias overnight until a brief moment ago when the ECB cut their benchmark interest rate.  The decision sent the /ES futures to new swing highs.  This development is interesting because it is very uncommon for swing highs to be established during the globex session.

Judging by the structure of the past rotations and the cumulative volume delta that has accompanied them, this move has the potential to continue much higher, with a current measured move target from 1777.751780.50.  Achieving these goals would represent a successful flush out of most short sellers over the last week.

It will be interesting early on to see if we get a fourth day of aggressive selling at the open, and if we do, it will be significant to see what the sellers are able to accomplish.  Because this overnight news/movement certainly puts an already exhausted seller base on their heels and if they flinch here we could see a major squeeze develop.

I have noted support reference levels on the following market profile chart, and my measured move target is above:

ES_MarketProfile_11072013

Comments »

Catch A Dipper By Their Tail

Early last week we were hot on the trail of a suspected whale on the tape: a large seller who perhaps was much more privy to future knowledge then us, directing massive AUM, and quietly entering the market.  It was a contextual concept that framed our decision making process.

Every morning I would delve a bit deeper into this idea by drilling into the market profiles and determining where this potential bear-whale could show her claws.  She never really succeeded.

As more information becomes available, it now appears what we were observing was not a large individual, but instead a collective profit taking by global money managers.  And coming into today’s gap higher, it appears the market absorbed the profit taking exceptionally.  One of the components of this distribution, or rotation, which kept me constructive on my swing long positions was the structure of the market as we encountered heavy selling.  Have a look:

ES_BARCHART_1106013

The key to determining a successful entry into the year-end performance change in my view is establishing value above 1767.  We would then be told that value is migrating to all-time highs and being accepted.

Down below, the bulls don’t want to lose yesterday’s value area low at 1756 in short order because that would represent a swift rejection by the sellers.

I have highlighted the above levels and a few interesting foot (tail) prints on the following market profile charts:

ES_MarketProfile_11062013

Comments »