Mon Jul 1, 2013 8:04am ESTComments Off on July Kicks off With a Pump
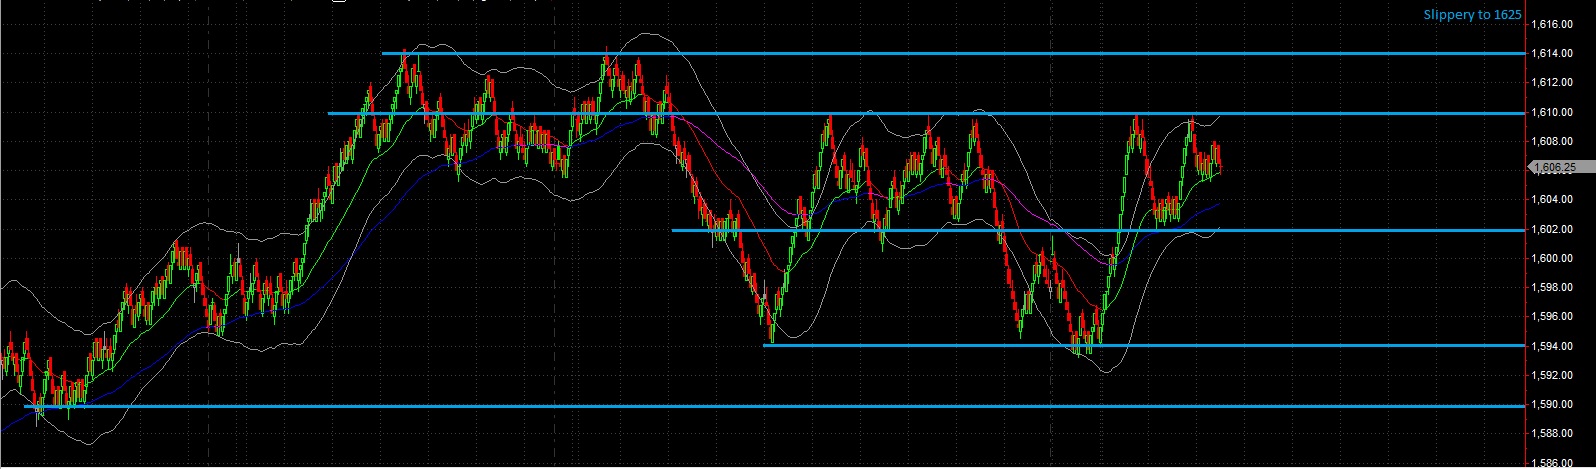
When the clock struck midnight and it officially became July, the market went on a pure, unadulterated 16 handle run off the lows of the globex session. The move tested the RTH highs from Friday at 1610 before retracing just above 1600. A second test of the 1610 level occurred, giving us five touches of this level.
Should it be tested again in RTH, I’ll be playing for a move though it and up to 1614.
I’ve noted other key levels for today’s trade on the following bar chart. I upgraded NinjaTrader over the weekend and haven’t managed to work all the bugs out. Therefore I will be trading without my profiles today, aka V.F.R.
Fri Jun 28, 2013 8:38am ESTComments Off on After a Strong Week These Levels Are Key
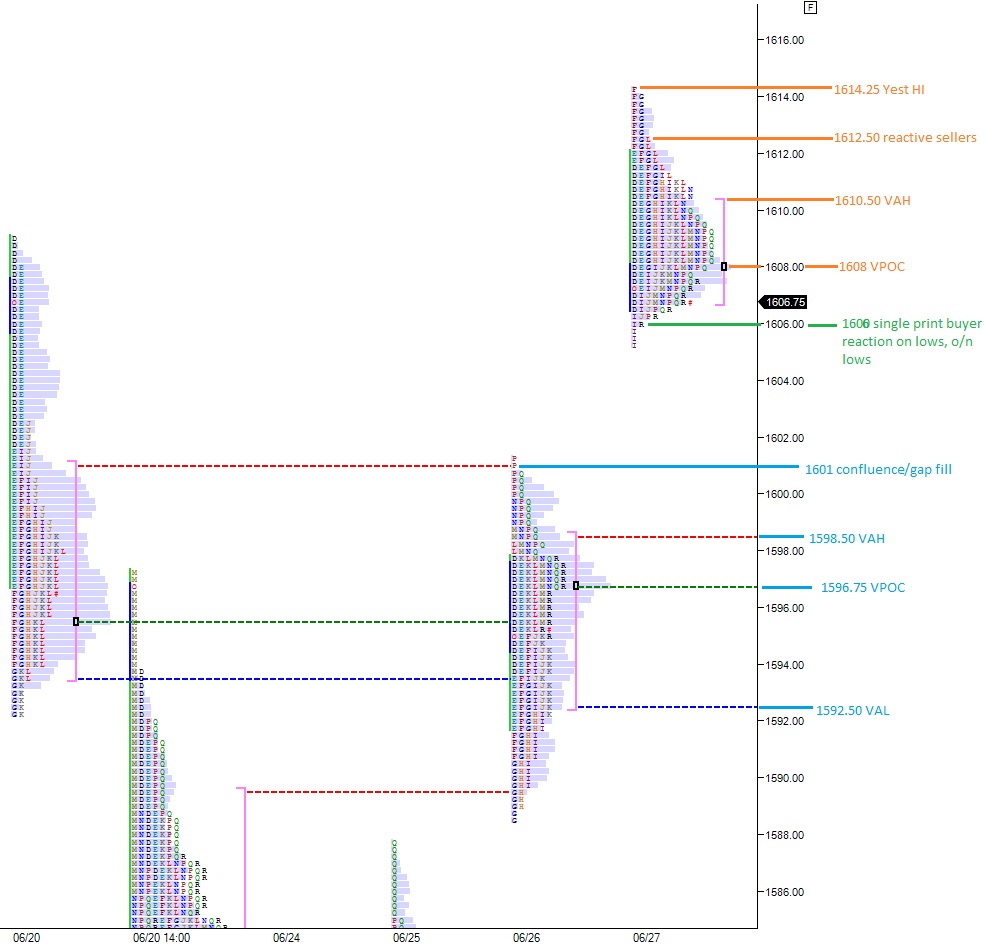
The overnight market made upside progress throughout most of the session only to give up five handles over the last hour. The swoosh lower brings us to an interesting price level, 1606, which coincides with the single prints on yesterday’s profile.
After two days of the market printing neutral sessions, probing the large gap above and finding sellers, and the overall corrective nature of the market, it shouldn’t come as a surprise to see some chop/lower prices. The clear question is whether sellers are again able to dictate lower prices in the effective manner we’ve seen since earlier this month.
I’ve highlighted a few levels of support I’ll be monitoring to gauge any progress made by the sellers and other key levels in the following profile chart:
Thu Jun 27, 2013 8:10am ESTComments Off on Futures Turn from Neutral-to-Bullish Ahead of The Bell
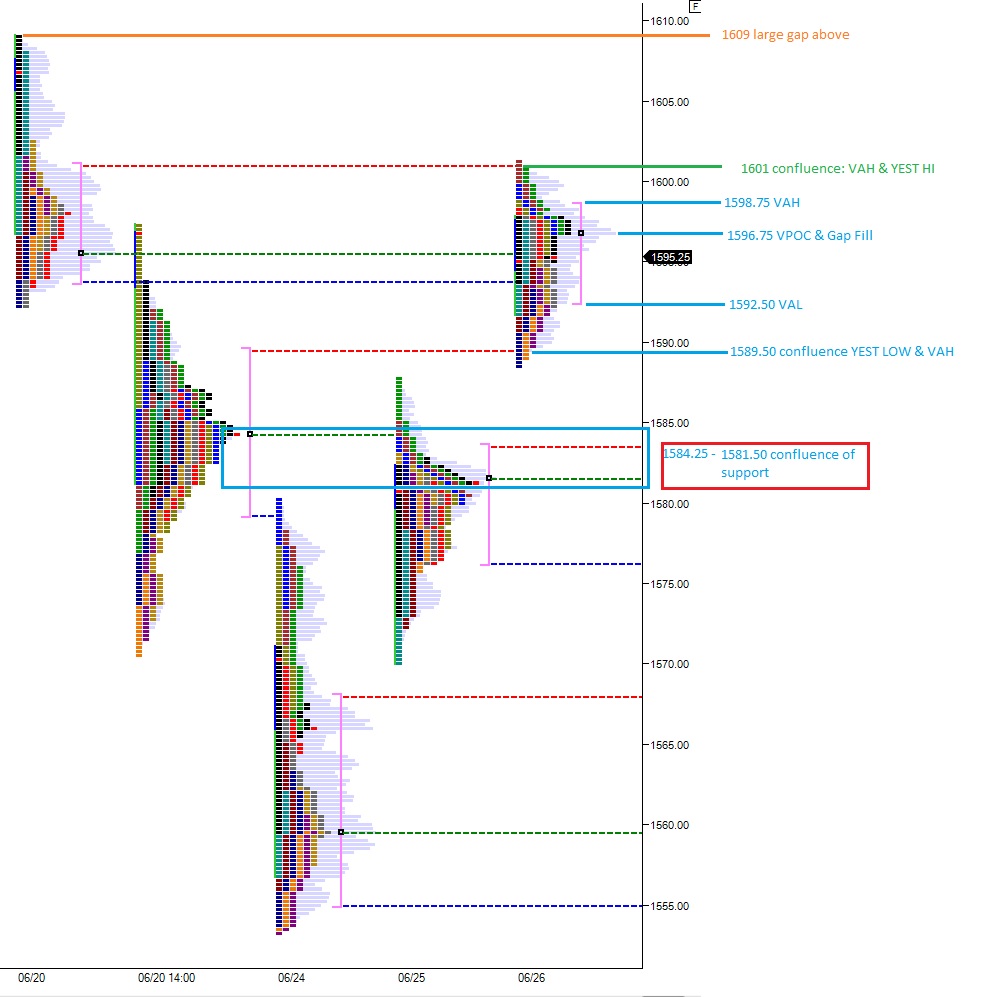
The first profile characteristic of note is yesterday’s neutral session, where we saw range extension on both sides of the initial balance (first hour of trade) and how this type of profile often shows up near inflection points.
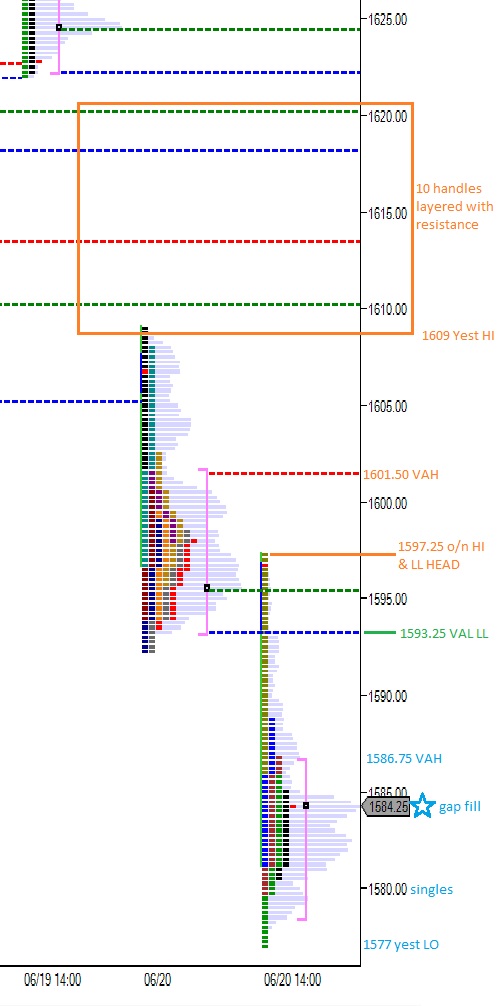
The overnight market was balanced out up until 7:45am when a burst of buy orders pressed the market over yesterday’s high of 1601.25. On the upside, the only profile I’m displaying is from 06/20, above which a large gap exists.
This week continues to bring a series of higher highs and lows giving us upside momentum, this is occurring amidst a corrective market so we want to keep in mind where the buy side action may fizzle out. The initial probe into the above gap starting at 1609, the high from 06/20, should be monitored closely for signs of an aggressive sell reaction.
I’ve noted this level and other important levels on the following profile chart:
Wed Jun 26, 2013 7:53am ESTComments Off on Big Strength Overnight Starts at European Open
The S&P spent the overnight session first wrapping up unsettled business below yesterday’s close then taking a one directional move for over 10 handles higher. The move started around the opening of the European markets, and only just now offered a pullback for eager entrants. Thus far they’ve all snapped up the opportunity, driving price from 1587 – 1591 in a matter of minutes.
My greatest concern today is early weakness once the US cash market opens. If a dynamic move lower takes hold, it could press us through the large and important value zone buyers have diligently progressed through. However, the thrust that just occurred as I type accomplished the important matter of setting a higher high which gives bulls some momentum to work with.
The angle of ascent overnight is very steep and may be prone to sharp dip. Should that occur we need levels in mind to gauge the overall sentiment of market participants. I’ve highlighted some levels of support and resistance I’ll be using today to provide insight into the overall context of today’s price action in the following profile chart:
Tue Jun 25, 2013 7:55am ESTComments Off on Huge Move Overnight – Important Levels to Gauge Sentiment
The overnight market continues to be corrective and volatile, swinging the S&P futures around 20 handles.
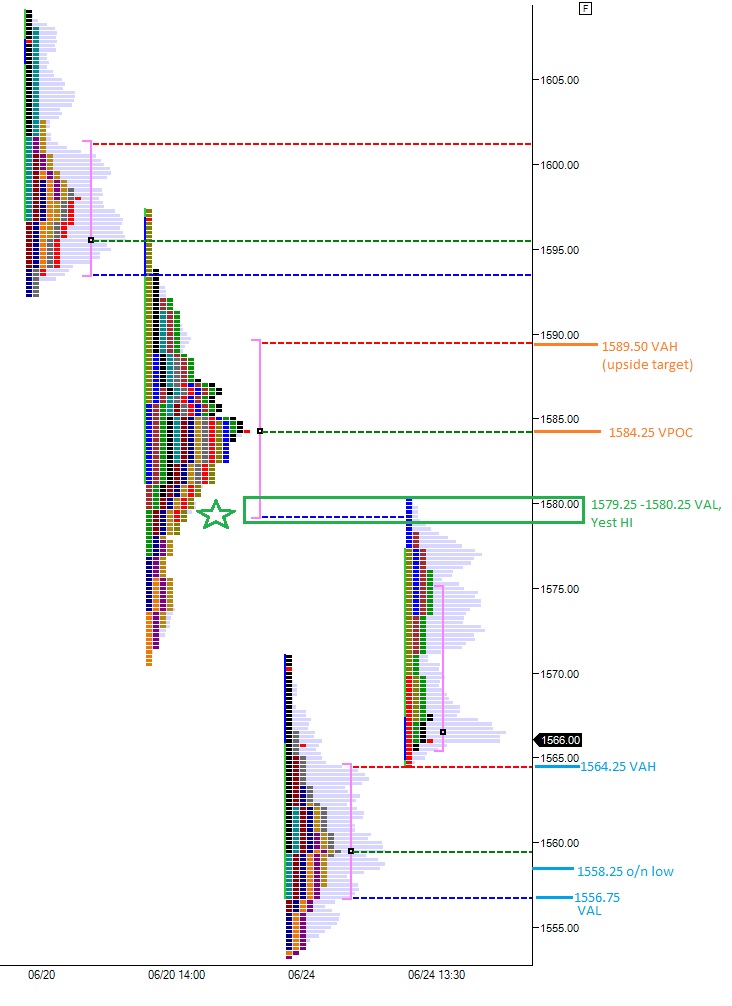
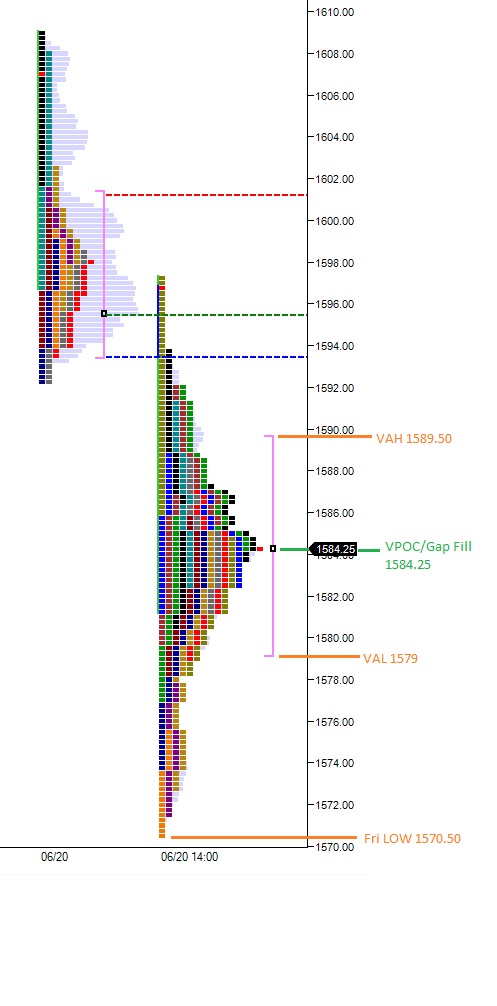
The key price zone above today is 1579.25 – 1580.25 which marks yesterday’s high and the value area low of the major distribution printed last week. If price gains acceptance above this level, the probability increases of us working our way through to the other side of value, up to 1589.50. In between these prices we have a thick VPOC at 1584.25 which will may slow the market.
I’ve split yesterday’s profile into the two occurring events, first the early long liquidation, printing a b-shape, then the short covering rally. The sellers were finally met by a force greater than their own at this point and an auction higher began. Price gave up the progress late afternoon but still held above the VAH at 1564.25. This level as well as other levels I’ll be judging sentiment from are noted in the following profile chart:
Mon Jun 24, 2013 7:50am ESTComments Off on All Selling Overnight-Could Abate Right Here
The S&P futures have been under significant selling pressure since opening Sunday evening, producing five significant rotations lower. The sellers are exerting their control on vertical development as the market continues to go down easier than up.
As I type, it appears the market is running stops on Friday dip buyers, pressing into their positions. I strongly suspect we’ll see stabilization take hold in this 1566.75 – 1564.50 region. If not, we could be in for much lower prices.
My profile data is being buggy this morning, so I’m only able to present you Thursday and Friday’s profile. We balanced out Friday afternoon, but only to the extent of printing a D-shaped profile. Although the resulting curve resembles a Gaussian bell-shape, it lacks the same significance. Mainly, it lacks any directional conviction, so we should respect the intermediate direction, which is corrective and lower.
I’ve highlighted some levels (resistance only) that I’ll be keying off of today:
Fri Jun 21, 2013 8:02am ESTComments Off on Overnight Session Recaptures Long Liquidation
The overnight session featured three clean rotations higher, propelling the S&P futures as much as 20 handles off yesterday’s low and over 15 handles above yesterday’s close.
The key take away from the dynamic action is it erased the large liquidation break we spoke about yesterday afternoon, erasing all the progress it made. This adds to the likely hood that the move lower seen yesterday afternoon was in fact long liquidation and not new shorts being initiated. However, anyone overconfidently starting shorts into the move lower now finds themselves in the hole for a quad witching op ex.
Both of yesterday’s profiles are b-shaped, added additional visual confirmation to the move being long liquidation more than short initiating.
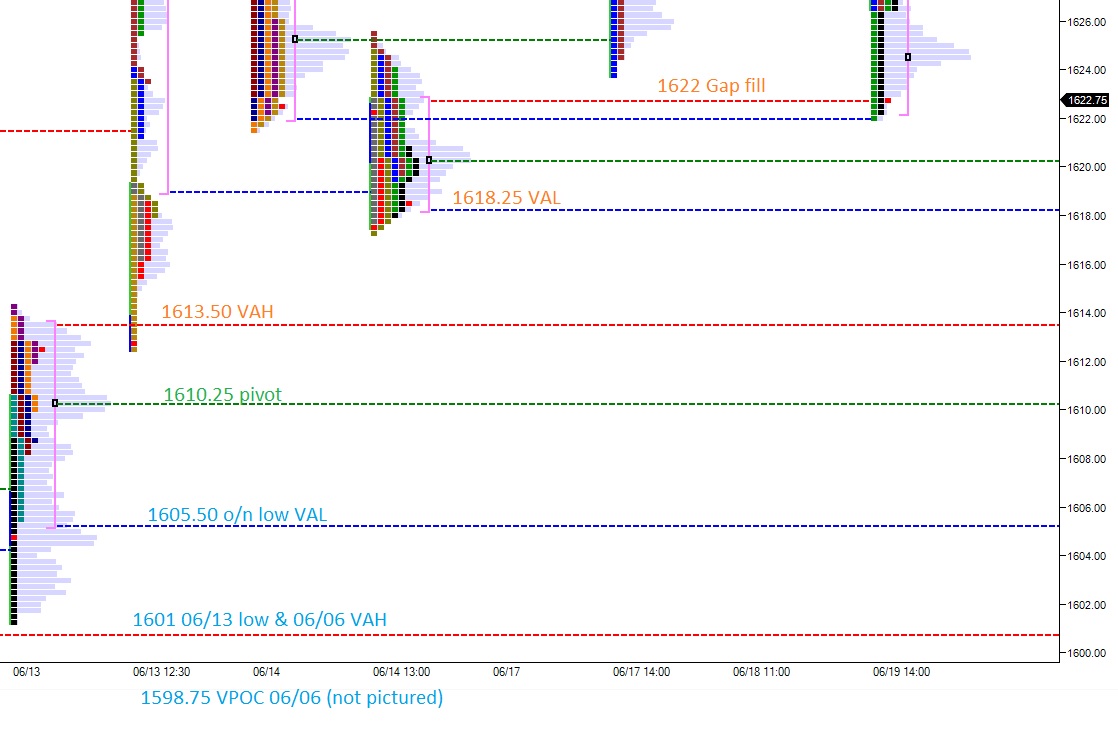
We’re currently priced right at the mouth of the liquidation which features a VAL price mark for us to gauge sentiment with. The VAL from yesterday’s first distribution sits at 1593.25.
I’ve highlighted the above price level and other key reference points in the following profile:
Thu Jun 20, 2013 8:02am ESTComments Off on Grade USA Bunker Busting Power
The sellers brought the force yesterday and overnight.
S&P futures continued lower after the cash close yesterday rotating as low as 1612.75 before stabilizing. Around 4am the sell orders began flowing into the markets again pressing the globex session to new lows at 1605.50. Since then we’ve stabilized again as we approach RTH.
The current size of the gap (over 10 handles) is often referred to as a pro gap, and often goes unfilled. However, given the overall choppy conditions of the market, I suspect a slightly higher probability exists than the typical low 40 percent odds.
Most important today however, is defining levels of potential support. I won’t be performing any knife catching feats in the futures today, but it’s important to keep these reference points in mind while gauging the sentiment of the market.
I expect some attempt early on by the buyers to press higher. Here’s the levels I’ll be keying off of in today’s trade:
The overnight session featured a seven and a half handle chop which already sets the tone that the market is building energy. Up above, yesterday’s high of 1648.75 was tested twice and both times rejected. It now resembles a triple top. Any sustained trade above this level gets us moving fast. If we see price accepted above these levels only to fail, that would be a nasty bull trap.
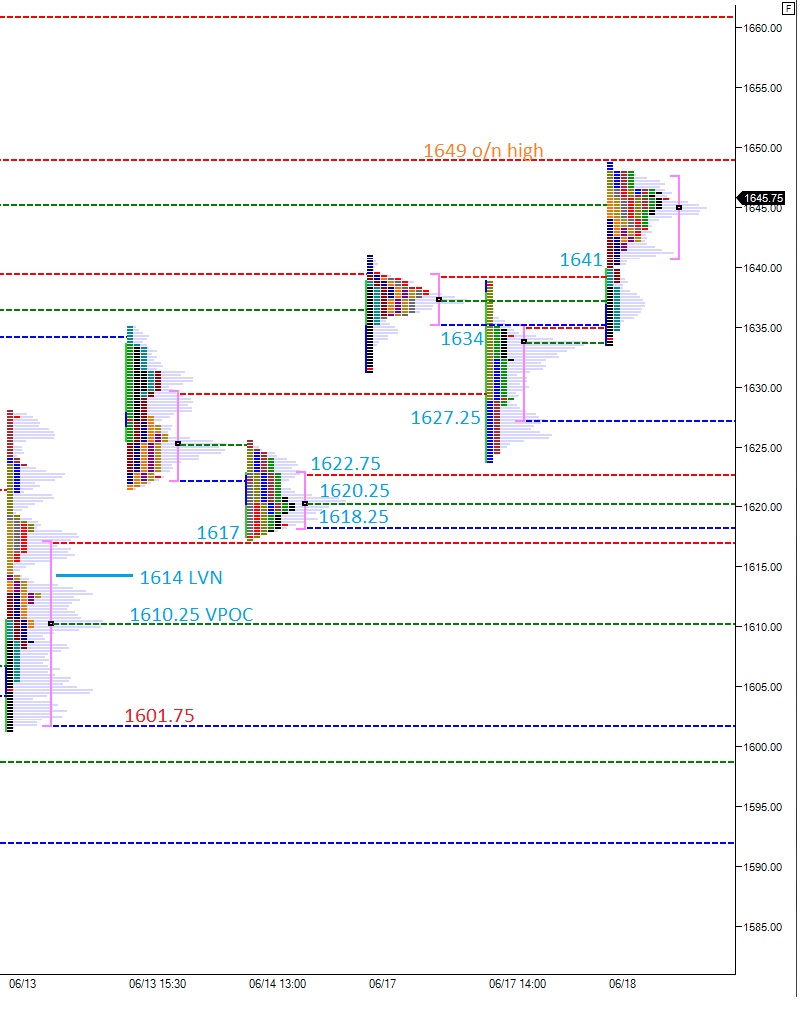
Below the overnight chop is 1641 which aligns with yesterday’s value area low. Sustained trade below this level will quickly take us to yesterday’s low (and open) at 1634. If the lows don’t hold, the sellers will likely target 1627.25 then the sold foundations from 1622.75 – 1620.25 – 1618.25 – 1617. This cluster of support is vital to the long case in the short/intermediate term. Below there, price gets slippery down to a 1614 LVN then 1610.25 06/13 VPOC.
I’ve noted the above levels in the following chart:
Tue Jun 18, 2013 9:49pm ESTComments Off on The Most Curious Footprint Encountered Yet
The weather in Michigan has reached the short stretch where it becomes sublime and you’re flooded with memories of what make the murder mitten a great place. I watered my new cement, one of the joys of home ownership. Imagine that, desert troglodytes. I’m surrounded by fresh water, splash.
Cement is a great foundation for building upon. For weeks after you pour it, the cement continues to cure underneath the hard surface. Cooling it off with water promotes a more solid cure and whiter concrete.
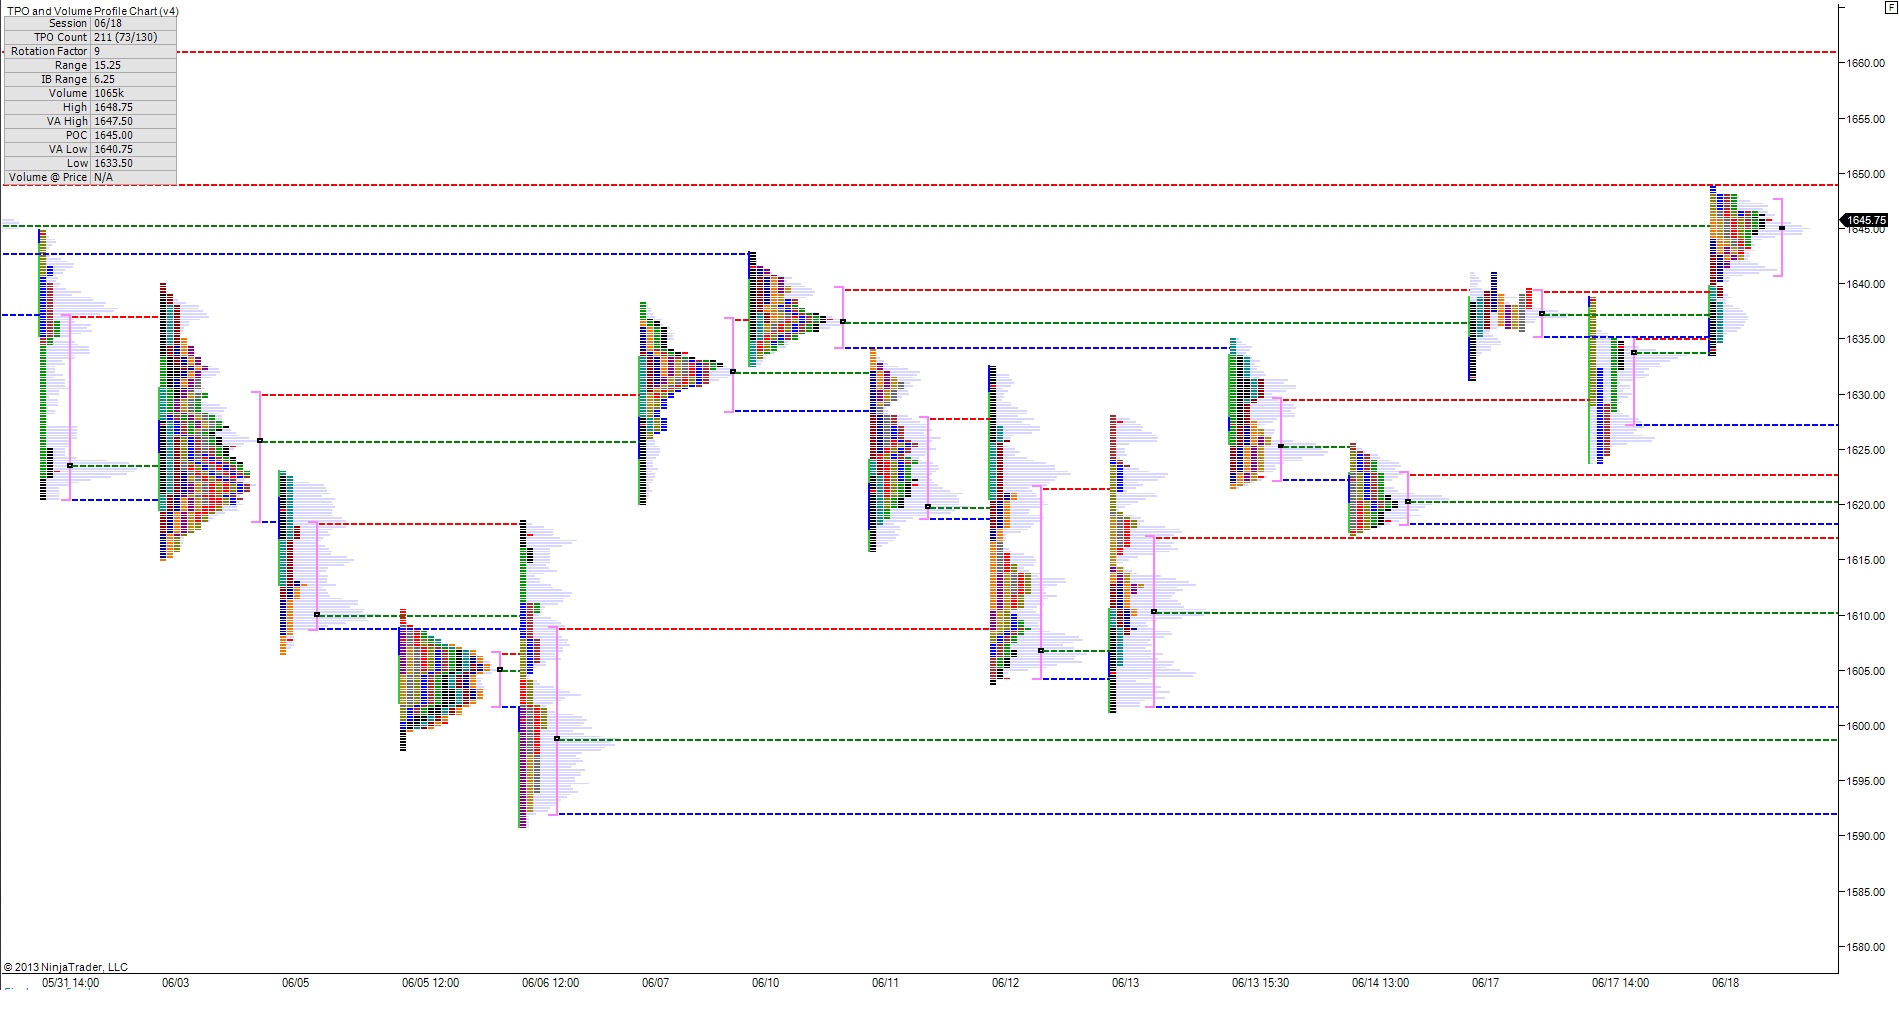
I could go on about fresh concrete for hours, I love infrastructure. But instead turn your attention to these profiles building up in the S&P. My game was thrown off over the weekend, and important work was neglected. The profiles needed to be chopped and screwed going back to late-May to give us an idea of what’s going on above and where we may expect to encounter resistance. There’s lots of really interesting stuff going on, but I want you to pay particularly close attention to the following features of the profile chart:
Look at the profile NAILING the RTH high today
Look at the layers of support properly formed and lain below, like good concrete
Look at the OPEN AIR from 1649 to 1661
You better click this one and keep it open on a new tab
The red dotted line at today’s high represents the value area high from the calm morning of 5/30, just before all hell broke loose and a one direction (no homo) move to our recent swing lows occurred. The green dotted line is the 05/30 VPOC. Curious, yes? That we’ve set value in near perfect alignment with this singular event?
Buy orders brought us back here this morning, that’s what today’s P-shape profile suggests. They came to market early to initiate new longs, or perhaps it was short covering. Either way the buy pressure abated and/or was met with enough selling pressure to end upside progress for the remainder of the session. But, not enough to press lower. You still with me? Because none of this matters too much. All that really matters is The Fed.
But we’re here, at a critical juncture, the market will tip its hand, but a tip higher has to simply levitate, as where a missile lower has to carry grade USA bunker-busting power. Place your bets…