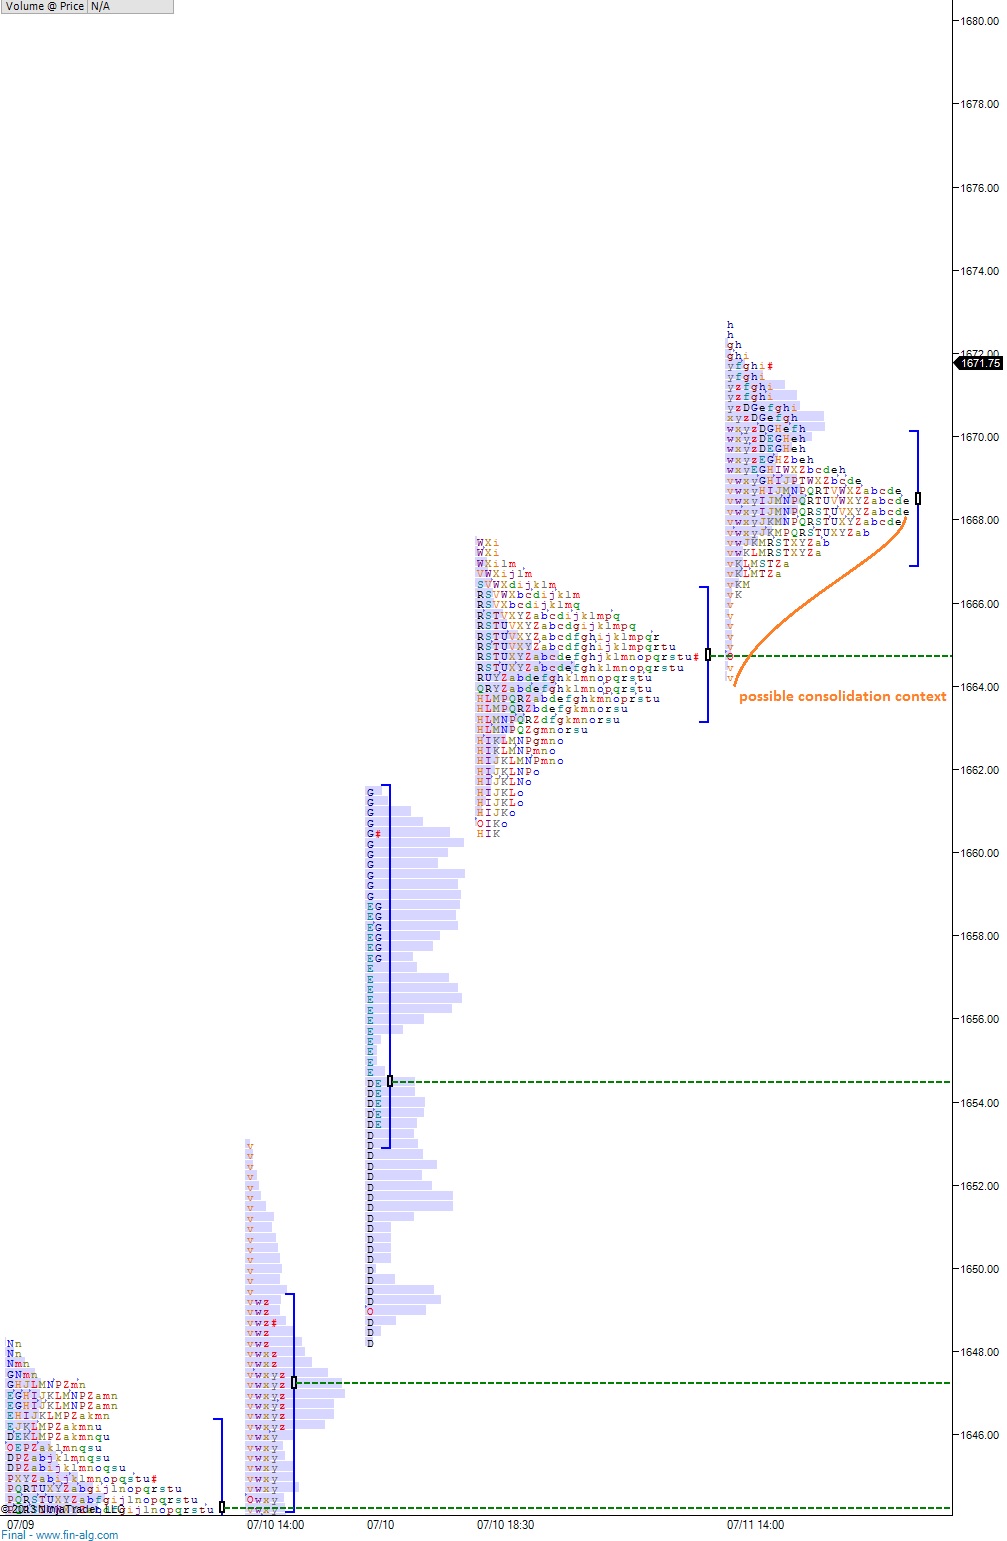
The /ES printed a balanced overnight session in a quiet manner. We have WFC and JPM earnings on tap here shortly which may get the market moving. The 24 hour profile suggests we may see some back-and-fill action, rounding out the bell-curve and taking us back down to around 1664. The order flow as we approach cash open however, suggests we could be setting up for another ramp higher.
I suppose we’ll have a better sense of the market’s early direction once we hear from these two large banks.
Two key levels of support today are 1667.50 and 1660.75. The latter level marks the upper bounds of the big after hour’s short squeeze that occurred when Chairman Ben said what needed to be said. Losing this level could result in a liquidation snap, at least 50 percent of the way, down to 1654.
Above on the S&P, we still have the high water mark, 1680 to shoot for.
After a strong week, how the market goes into the weekend will be interesting. Will we see profit taking and consolidation? Or will the market continue to press the accelerator into the floorboards?
I’ve attached the following 24-hour profile chart to give you an idea of the consolidation context I initially wrote about:
We’re approaching the cash open over 15 handles above yesterday’s close thus today’s gap is of the professional variety. Therefore, attempts to fade the gap intraday will be much more difficult than your typical gap. This also gives us a puzzle piece: if the gap were to fill that would be very unusual and could signal a peak in the recent move higher.
I’m not saying that’s what’s going to happen, let’s be clear about that.
The large gap does mean today brings higher opportunity as the market is out of balance and must now work the buyers and sellers to re-establish appropriate levels of auction.
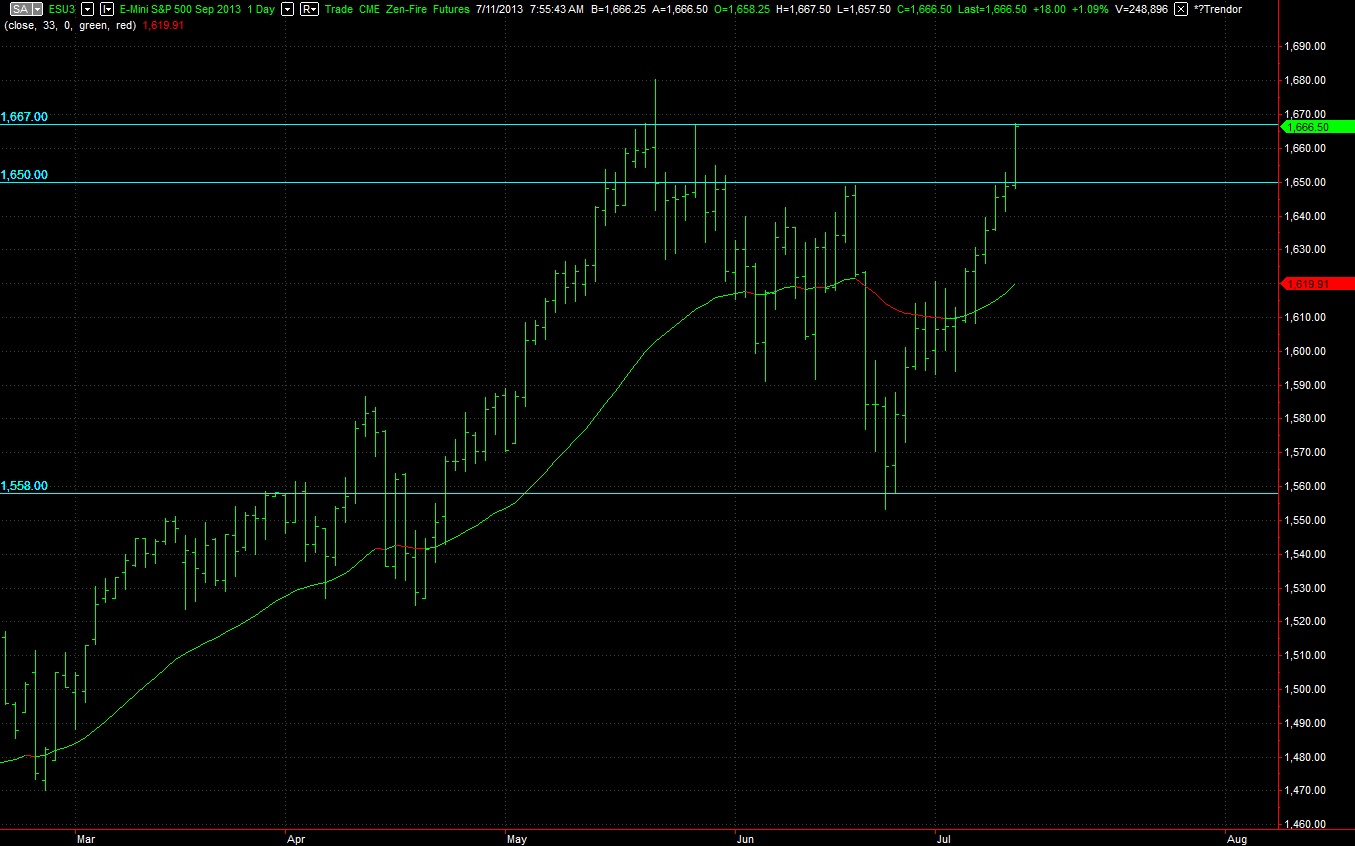
Today I’ve zoomed out to see where the S&P 500 is trading via the rolling e-mini future contract. As was suggested, we’re testing the very upper bounds of a potential range. With the exuberant reaction to Fed Chairman Benjamin’s commentary yesterday evening we’ve wasted no time with 1650 which was of huge significance during May and June. Instead we’re pinned up against the next major level 1667, which features many of the May peaks and marks the upper quadrant of the 05/22 peak event.
The highs are now just an earshot away at 1680.25 and the question becomes, did we get a level of padding as we enter a patchy earning season? Are we destined to be range bound this summer? Or will new highs be made, and met with a flood of initiating buying?
It’s a challenging environment, but in terms of intraday trades: when the overall trend is higher, you give your longs more room to run and allow support a fair chance to work.
It should be a challenge for mean revision to set in today. Again, I advise you pay close attention to the earnings out of WFC and JPM Friday morning, and then C, MS, and YHOO on Monday. They should provide direction at this interesting junction.
The S&P has done very little so far today, more or less marking time in a very non directional manner. The only play has been to fade the extremes. There has been a slow and steady pressure on the bid all session and we’ve traversed yesterday’s entire value area.
We’ve seen range extension lower which suggests we may have already marked the high of the day. However, we’ve seen a slew of neutral sessions these last few weeks which feature range extension in both directions. Keep in mind however, over years of daily data, these formations are very uncommon.
I’m from the school of thought that we’re in a summer range, and I believe we’re near the high end of it. Buying up here thus becomes a higher risk game. However, We’re yet to test the upper bounds of the range, upward of 1650 -1660, and it seems appropriate to touch those levels before traversing the range again given the “max pain” aspect of the markets.
We could certainly see activity pickup this afternoon after the 2pm FOMC minutes, and perhaps a tradable trend will develop.
In the meantime, individual names are still offering tradable opportunities, and my top pick in this environment remains TPX.
Wed Jul 10, 2013 7:52am ESTComments Off on Striping the Field as We Await FOMC
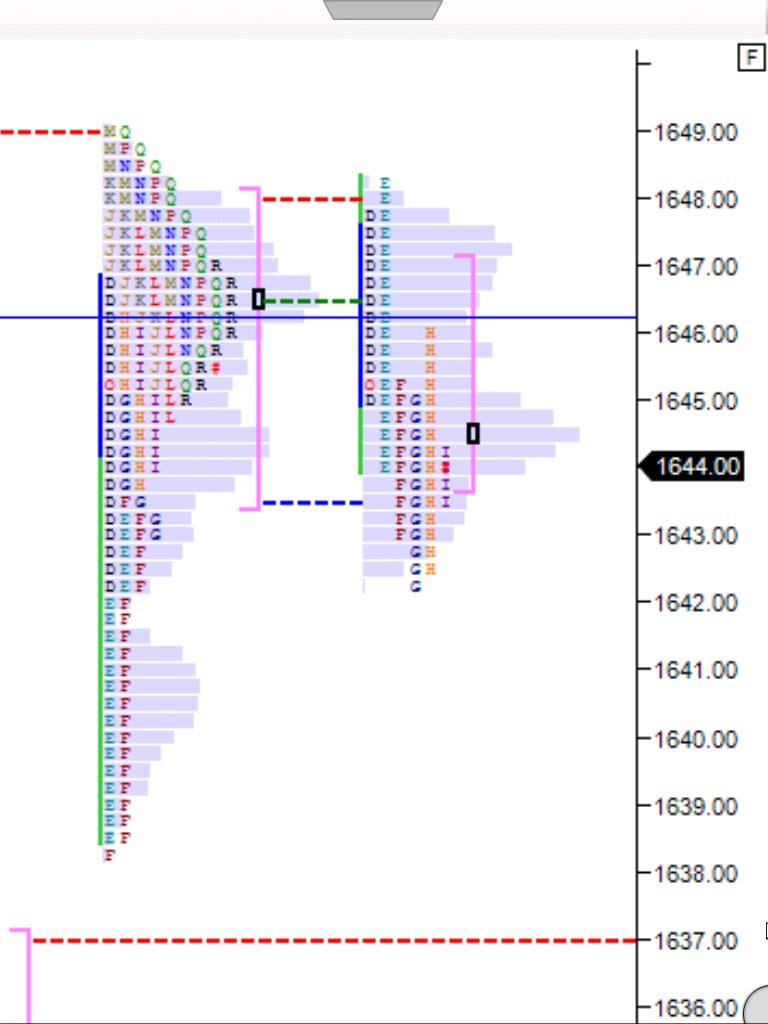
The overnight session printed two small rotations lower, taking us around three handles off the closing print. Should price sustain these levels into the opening bell, the placement suggests we may see a quiet morning auction.
The buyers may make an early attempt to fill the small gap, taking us back up to 1646.50 and perhaps press into yesterday’s value area high at 1648.25. I suspect we’ll find sellers here, at least initially, as the market awaits the FOMC Minutes at 2pm and the Ben Bernanke commentary after the bell.
It looks like sellers will have a hard time pressing into Monday’s value, but should the selling accelerate, I would look for the market to test down to 1632, which is effectively the launch point from early Monday.
I’ve highlighted these levels in the following profile chart:
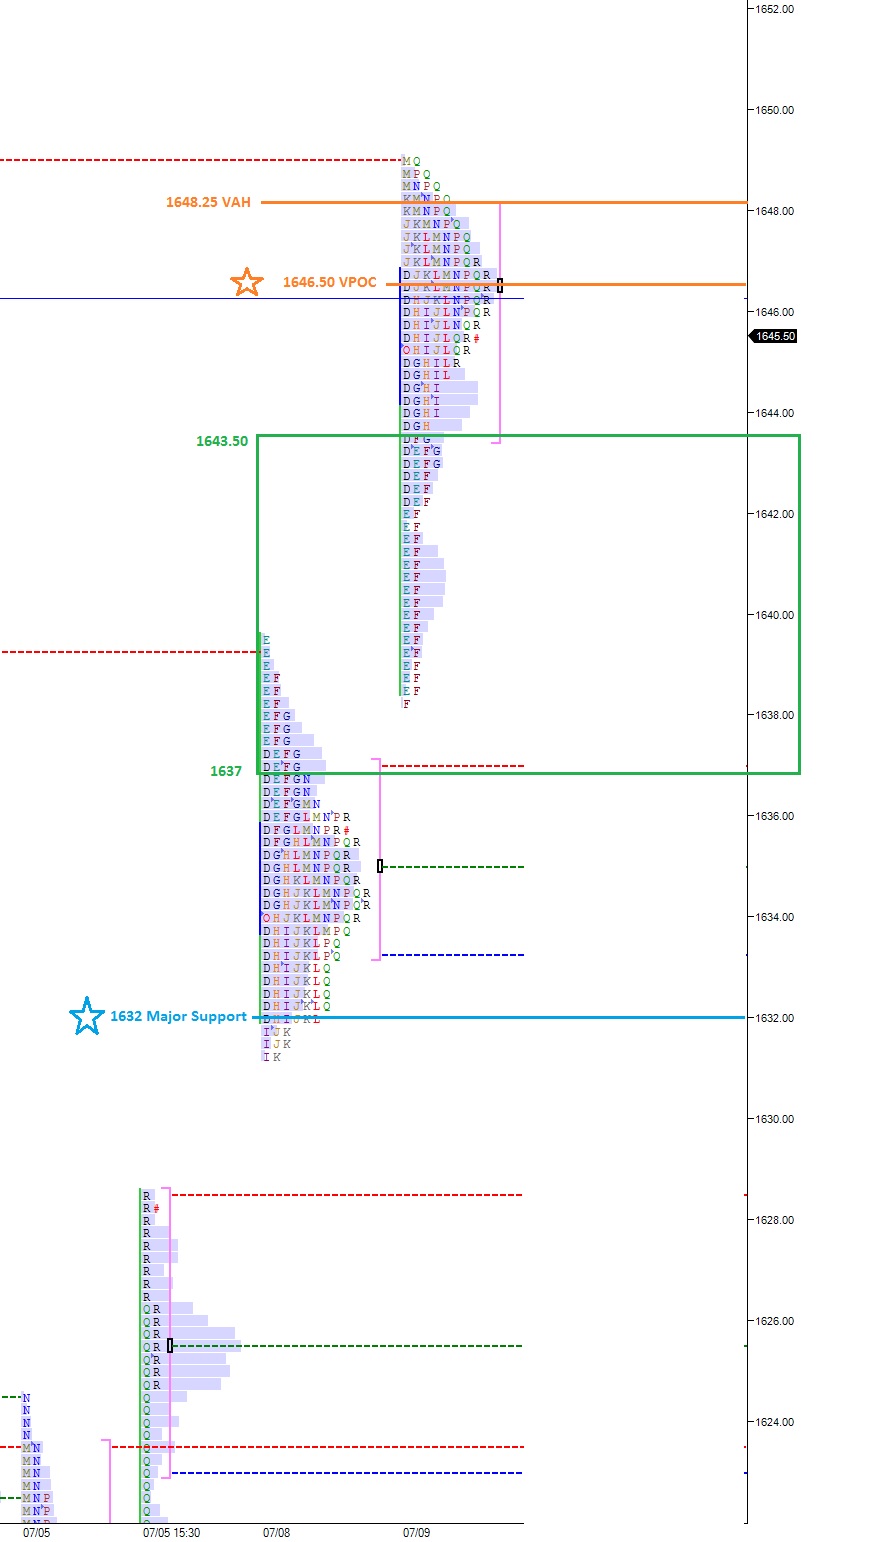
Big moves continue to be the norm in the overnight market, with the /ES_F seeing nearly 10 handles of upward rotation since the cash close. We’re off the high of the overnight session, clocked in at 1645, but not significantly and the market is still showing upward momentum.
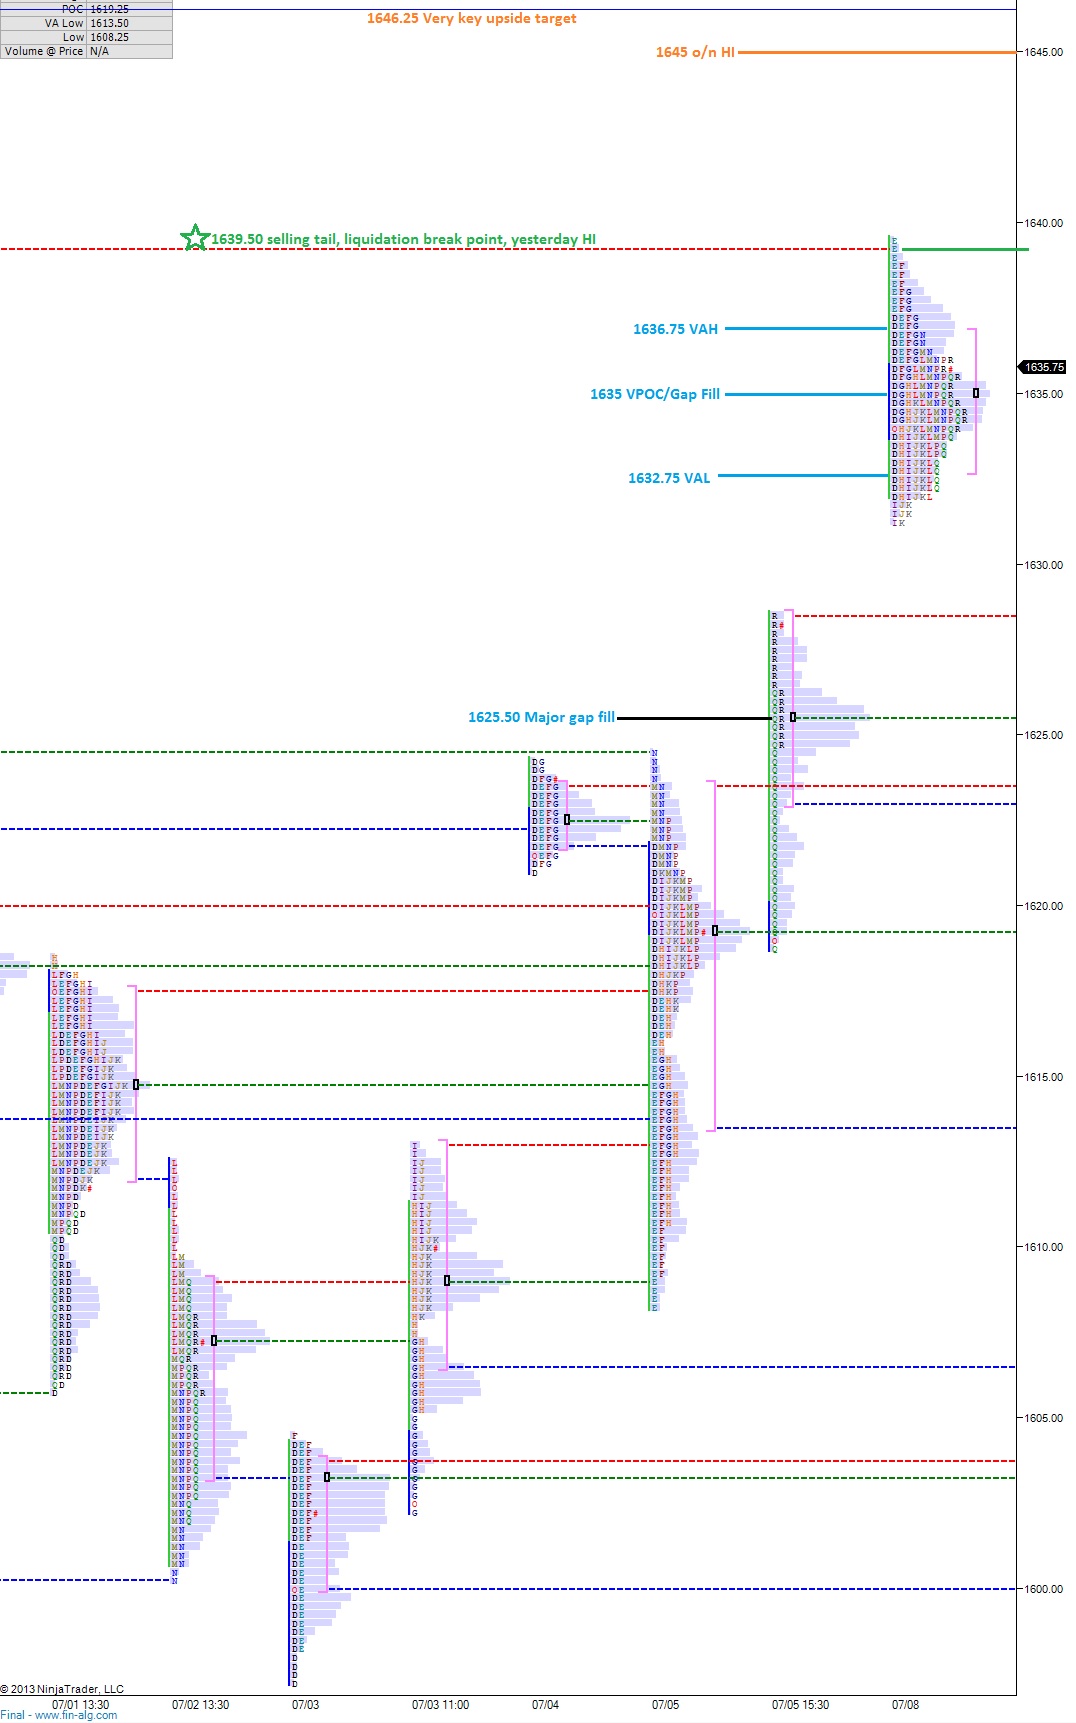
It appears we may work to accept value above our first key upside price level 1639.50. Keep this level in mind today as it coincides with yesterday’s high. How we trade relative to this price will give us a strong sense of market sentiment heading into earnings.
I’ve highlighted this key level and other potential prices of interest in the following profile chart:
I took extra care and time preparing my profile analysis this morning, savoring it like peppercorn duck paired with a well concentrated Chianti.
Enjoy,
Raul
There were major implications surrounding 1623.75 as it pertained to the proclivity of providing directional bias. I worked diligently to keep this level in your mind and more importantly mine to ensure appropriate steps were taken to adjust equity exposure according to the market’s treatment of the key level.
I’ve split Friday’s profile open so we can more clearly see and discuss the auction that took place. Before the open, the market traded just above 1623.75 and churned the level rabidly during the monthly Employment Data drop. The first two paragraphs featured here provide blow-by-blow commentary.
We lost 1623.75 before the cash market opened and experienced a subsequent drive lower fueled by a large burst of sell orders. After an hour of trade, buyers perceived the market’s current pricing as a discount, and swiftly auctioned price back into the opening range, then again rotating up to 1623.75. Their actions left footprints initially at 1609 where a single print buying tail printed, then at 1613.50 where they rejected the seller’s attempts to again rotate lower.
Overall, the day flashed of neutrality, mostly, when we saw the range extension higher get faded back to the mean at 1619.25. Only at this very moment, a very powerful move higher, nearly 10 handles occurred. I’ve separated said move away from the primary body of Friday’s profile and made it independent. That’s because at that very moment something changed and it needs to be treated as independent from the primary session. Independent like a good American, USA.
Overnight the ramifications of the above accomplishment played out, and now we’re coming into the week with a large gap up, over 10 handles above the cash close. Today may be particularly difficult to trade, especially if the market doesn’t establish a clear vertical trend in either direction.
Up above, you’ll notice large gaps between my reference points. That’s because we’re nearing the upper mouth of a huge long liquidation. However, these levels are all huge accomplishments for the bulls, and acceptance of any one of them should add conviction to the long trade.
Weekly upside targets in the S&P futures are:
1639.50
1646.25
1649.00
I’ve noted these levels, and other key reference points in the following profile chart. You should click to enlarge this image, and keep it open on a tab:
We traded up to this key level in globex while celebrating our country’s independence. Now all we have to do is hold this level while the cavemen in Africa volley motor shells and Molotov cocktails at one another.
Gentlemen, be patient, let the trading day progress, and above all, keep this level in the front of your mind for it is a launch pad. Lets see which side we close on. Godspeed America, god damned speed.
Wed Jul 3, 2013 8:27am ESTComments Off on Keep in Mind Tomorrow is the Fourth
Which means today is the third, you follow? Let me explain:
We had a rather pungent selloff overnight, taking us as much as 13 handles off Tuesday’s close. We continue to be operating in a gap prone environment so mentally you should be prepared to handle such occurrences if you choose to hold positions overnight.
The key support today, on this shortened trading session, is 1592 which is only two handles below the overnight low at 1594. When I present the market profile to you, and you see the succinct manner in which it has located highs and lows this week, you’ll understand the gravity of this level.
Below 1592, price could begin working toward 1584, however given the shortened session, it would take a great deal of fear to press into these levels.
We’re right on the cusp of considering today’s gap to be of the pro variety, so it carries a lower probability of filling, but also a much higher reward. Let’s see who enters the market early on, if at all.
I’ve noted the levels I’ll be trading around in the following profile chart:
UPDATE: ON $F strength, I’ve swapped the dirty Brit Beatles song for the USA #1 Beach Boys:
As much as I love software updates, I’m still having trouble getting my NinjaTrader platform to display profile charts. On top of that, most of my historical data was wiped out. I’m hoping I can recover the data.
Thus I will present the bar chart again today, and reference the key levels from the last two days of trade.
I had a profile running yesterday during the RTH, and the key take away from the action was the P-shape profile as we worked up into the long liquidation that occurred on 06/19. Buyers were able to squeeze the sellers early on with gap-and-go action, only to see the sellers overwhelm the tape after the morning’s dynamic move. The initiating sell orders (orders executed at the bid) began flowing in around 12pm, and pressed against a price “shelf” at 1616. For a moment it appeared they may not break the level and a second squeeze would ensue. However, they broke the level and were able to rotate us back down to the opening print.
I’ve noted where the shelf exists in orange on the following bar chart. I’ve noted other levels I’ll be keying off of as well. Note the light blue line at 1623.75, that is the origination of the big 06/29 long liquidation. I expect a test of this level soon, if not this week.
Just like that we’re thrown into the month of July, like a Christian catapulted into the Colosseum to feed the lions. The S&P futures via the E-minis have been all over the place, allowing traders to swing both ways intra-day with relative ease.
The main takeaway from the last 22 hours of S&P moves is we made new swing highs, taking us about half way up the big liquidation snap that started on 06/19. Even if today marks the high for the week, it’s a damn good one.
The important matter is how the market chooses to digest today’s action as we approach the kickass 4th of July. Ideally, volume tapers off and everything becomes rather boring. I would like boring as I sit 80 percent long, because really I only want to buy gigantic fyreworks (sic) and “blow shit up” to impress my relatives.
Imagine a scenario where we slowly print a higher low in-or-around 1600…wouldn’t that spook the bears?
Moving on to book talk, I sold ½ my YGE long for a 10 percent gain. My track record in trading the name is still negative, but it was nice to land a win. I still like the name even though it printed a nasty candle today. I’m keeping my little ¼ on a tight leash.
I added to my Z and GS longs, in that order. They’re about the same size now, which is about ¾ size. I see a similar pattern between the two daily charts which is yet to materialize, which means I’m early, which means the high probability hasn’t set in yet, which means I may lose money. I continue to jump the gun on my setups.
That’s all I did today, essentially pooling my wins from YGE into Z and GS.
I want to join the iBC crew on SHLD down here as I believe the price presents an opportunity to buy the name at a discount. However, I’m backing off in hopes of slightly lower prices. I may not see them.
Finally, remember when I bought RGLD sub $50 and then went on a dog and pony show, decreeing my greatness? Anyhow I only scaled a small bit off and a nasty gap lower made the trade a net loss, but that’s not what I want to turn your attention to. Instead, I want to discuss how I was offered sub $40 shares by the stock gods and not only did my spider senses fire off a buy signal, “The Fly” spoon fed us high probability statistics. And what did I do? NOT JUMP THE GUN! I stuck my head in the sand. It’s been a distraction to watch it rip 10 percent since then. Now that I’ve penned my frustration, I no longer care.