iBankCoin
Home / Tag Archives: $ES_F (page 10)

Tag Archives: $ES_F

More Selling Overnight: Will it Stick?

We’re seeing some follow through in the overnight hours of Tuesday’s weak trade.  The sell orders began rolling in again during the Asian session and stabilized into a chop along the lows during the European session.

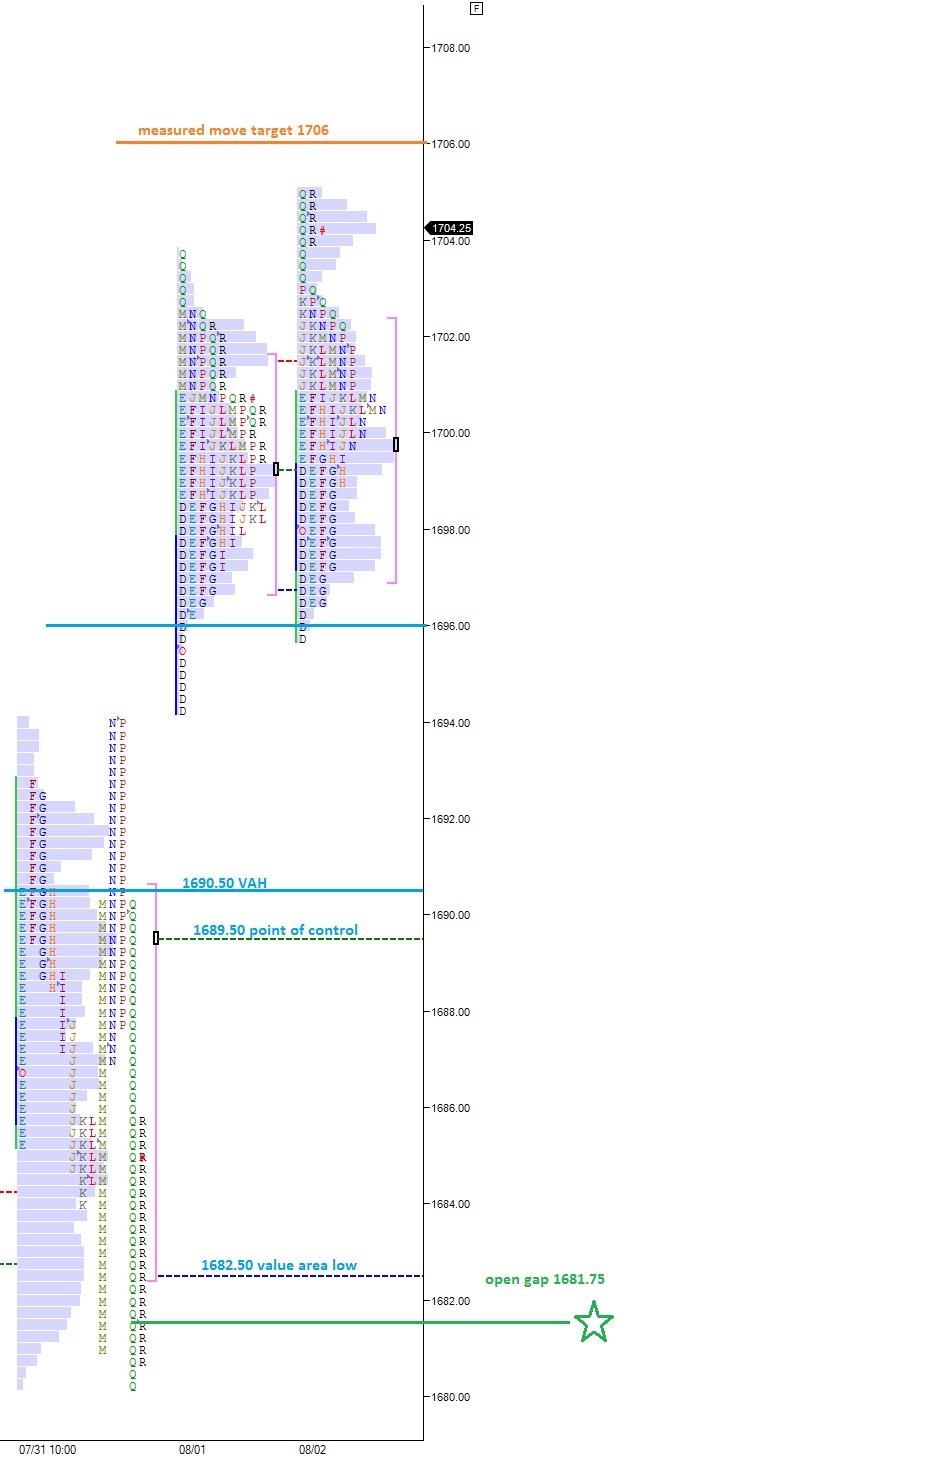
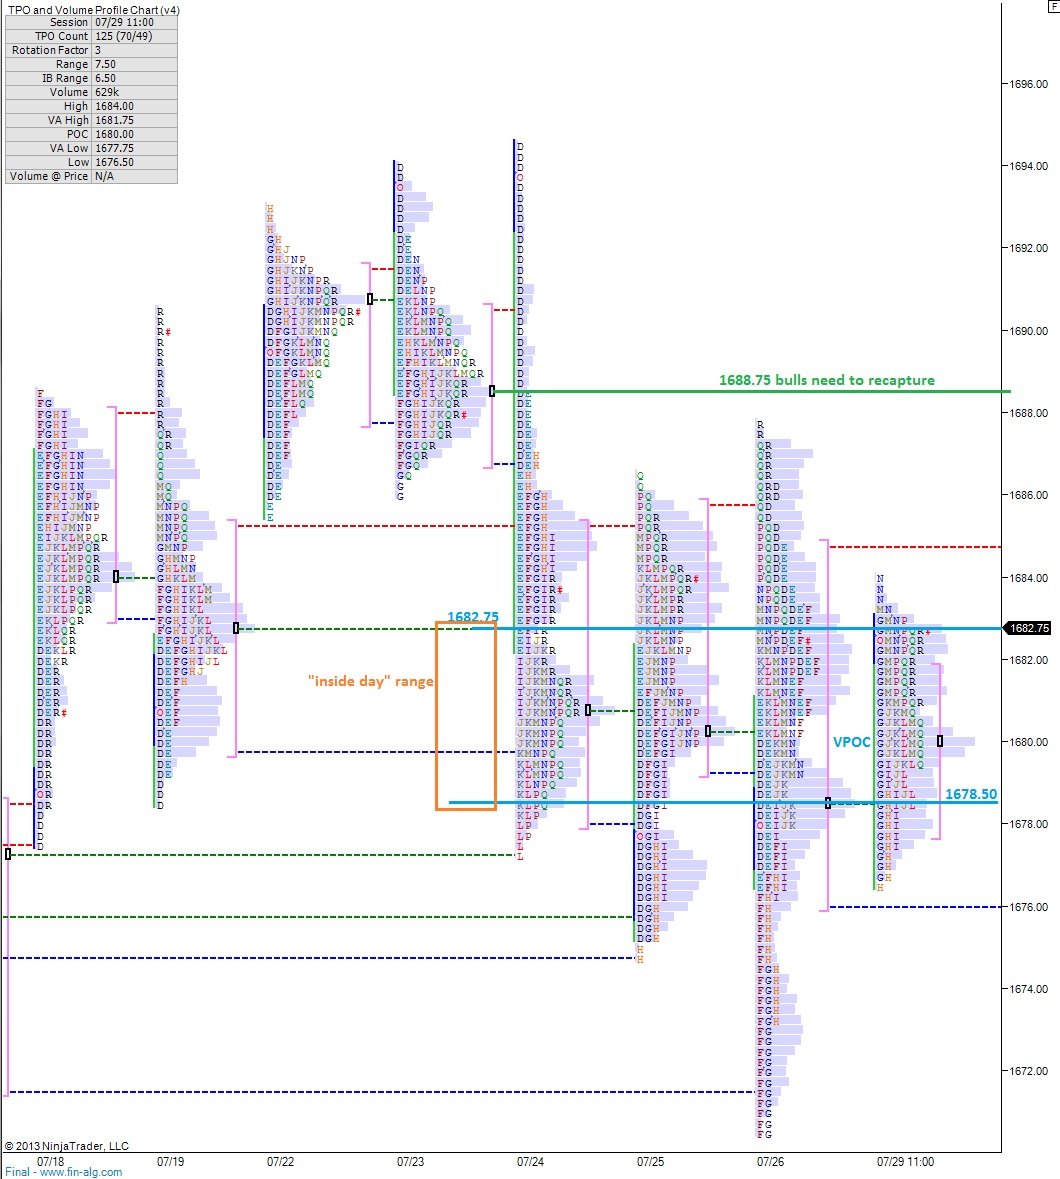
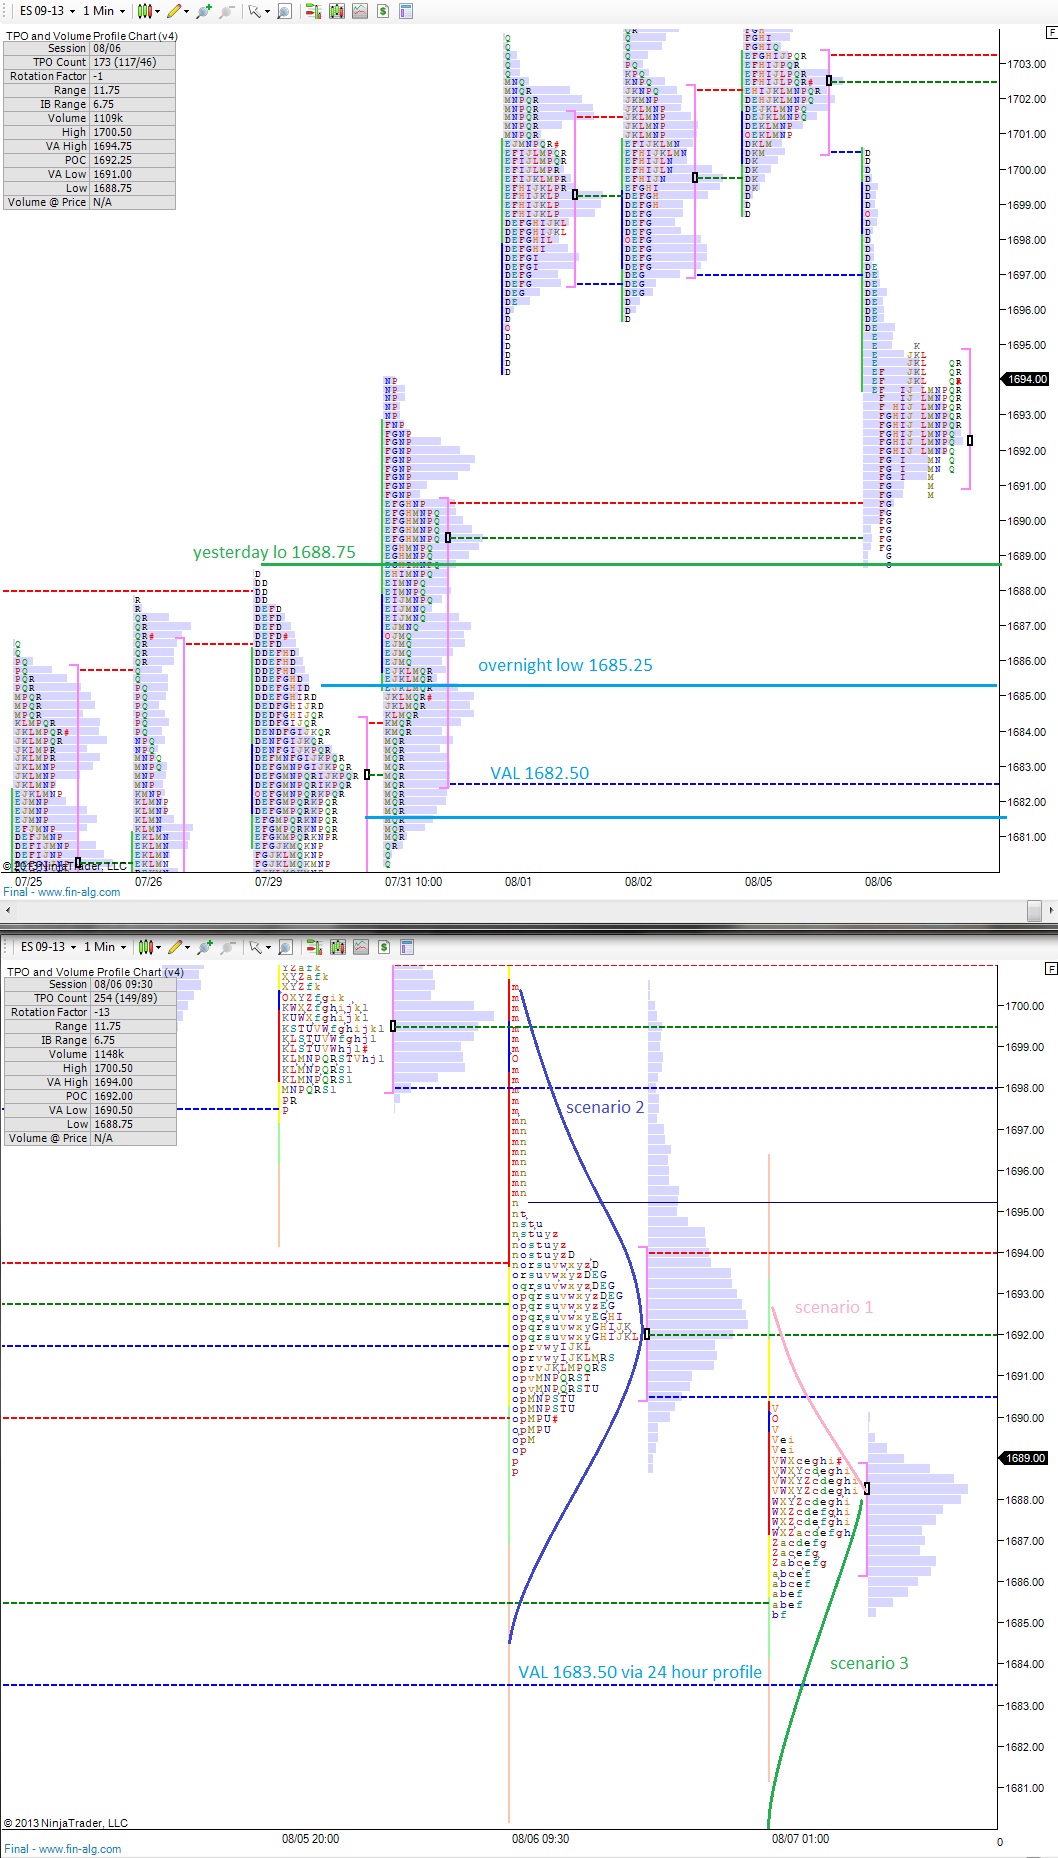
Yesterday’s cash session (RTH) shows characteristics of long liquidation, or risk off, with a long selling tail followed by the market balancing out.  The auction that took place was healthy, albeit downward, putting in a good looking low at 1688.75.  This level will be in play early on.

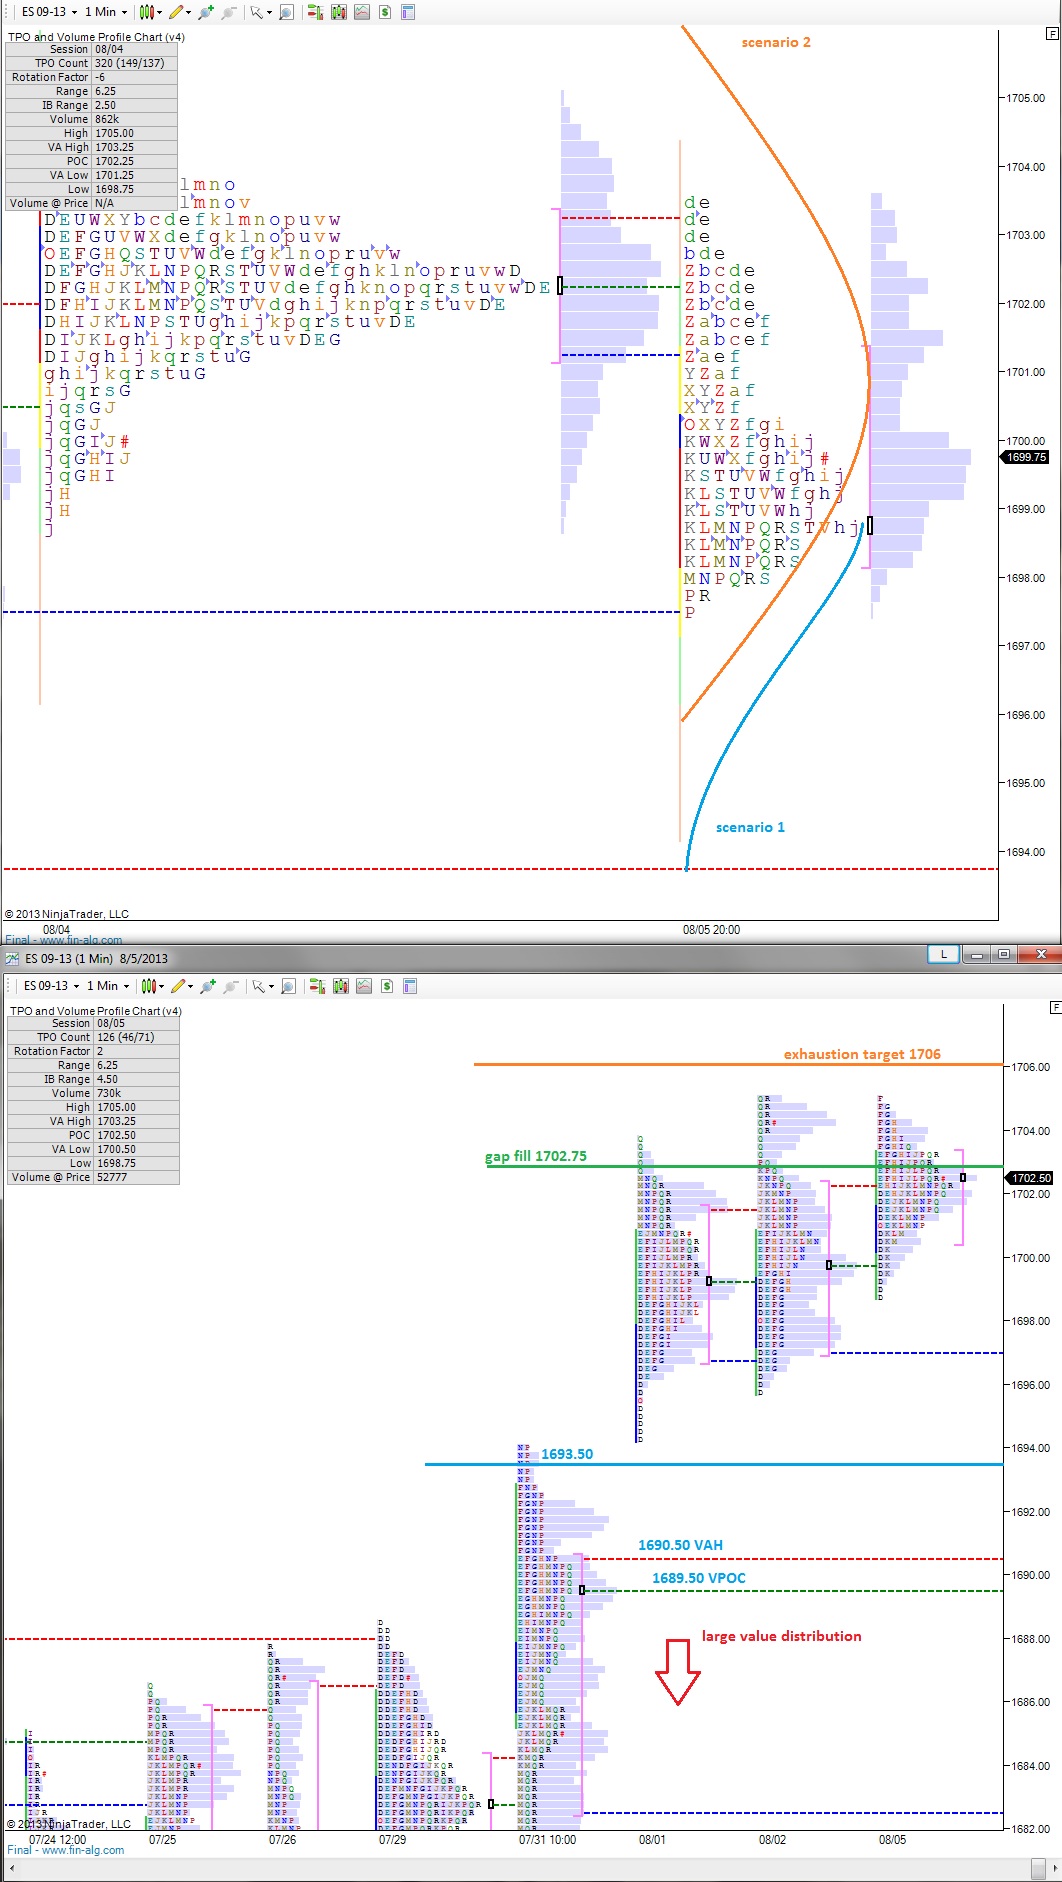
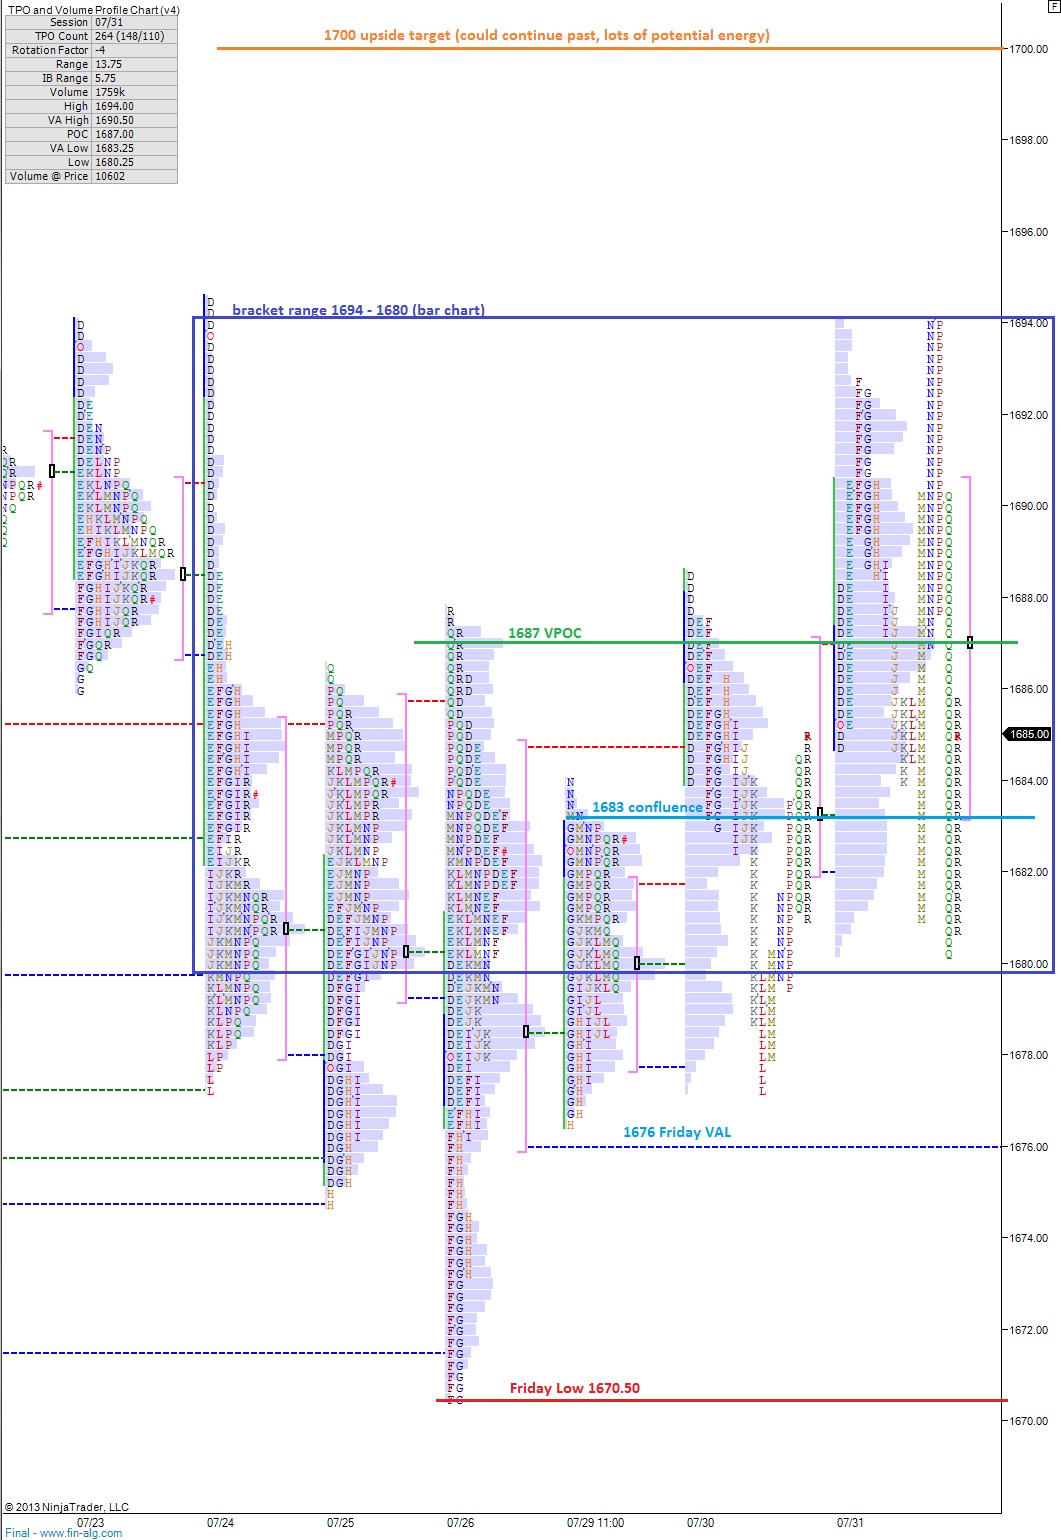
At risk to the buyers is a rotation down through the large balance area we built prior to launching to new highs.  There’s potential downside support at 1683.50 then 1682.50.

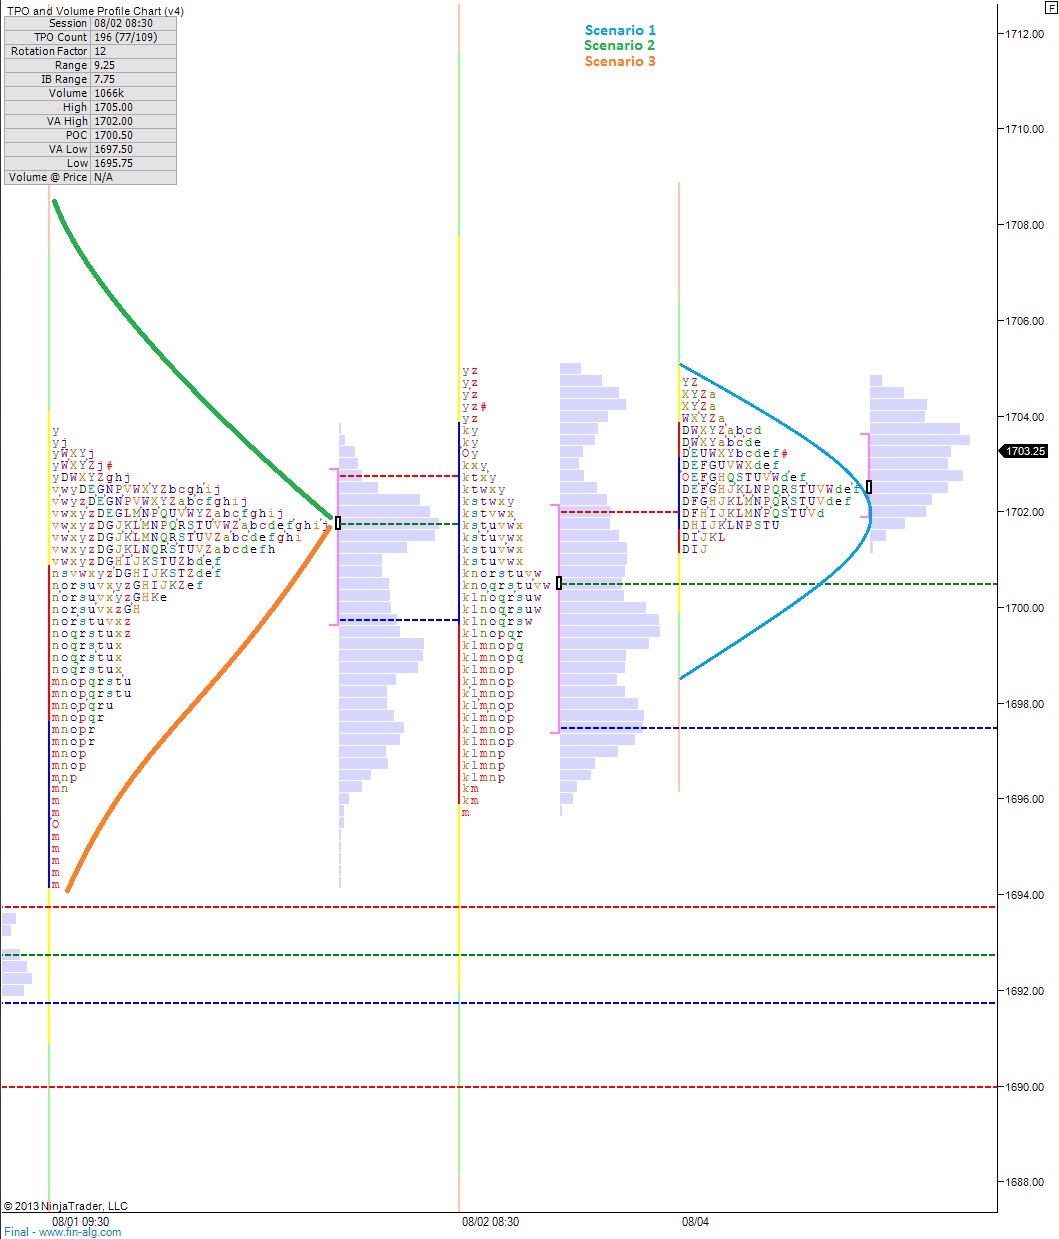
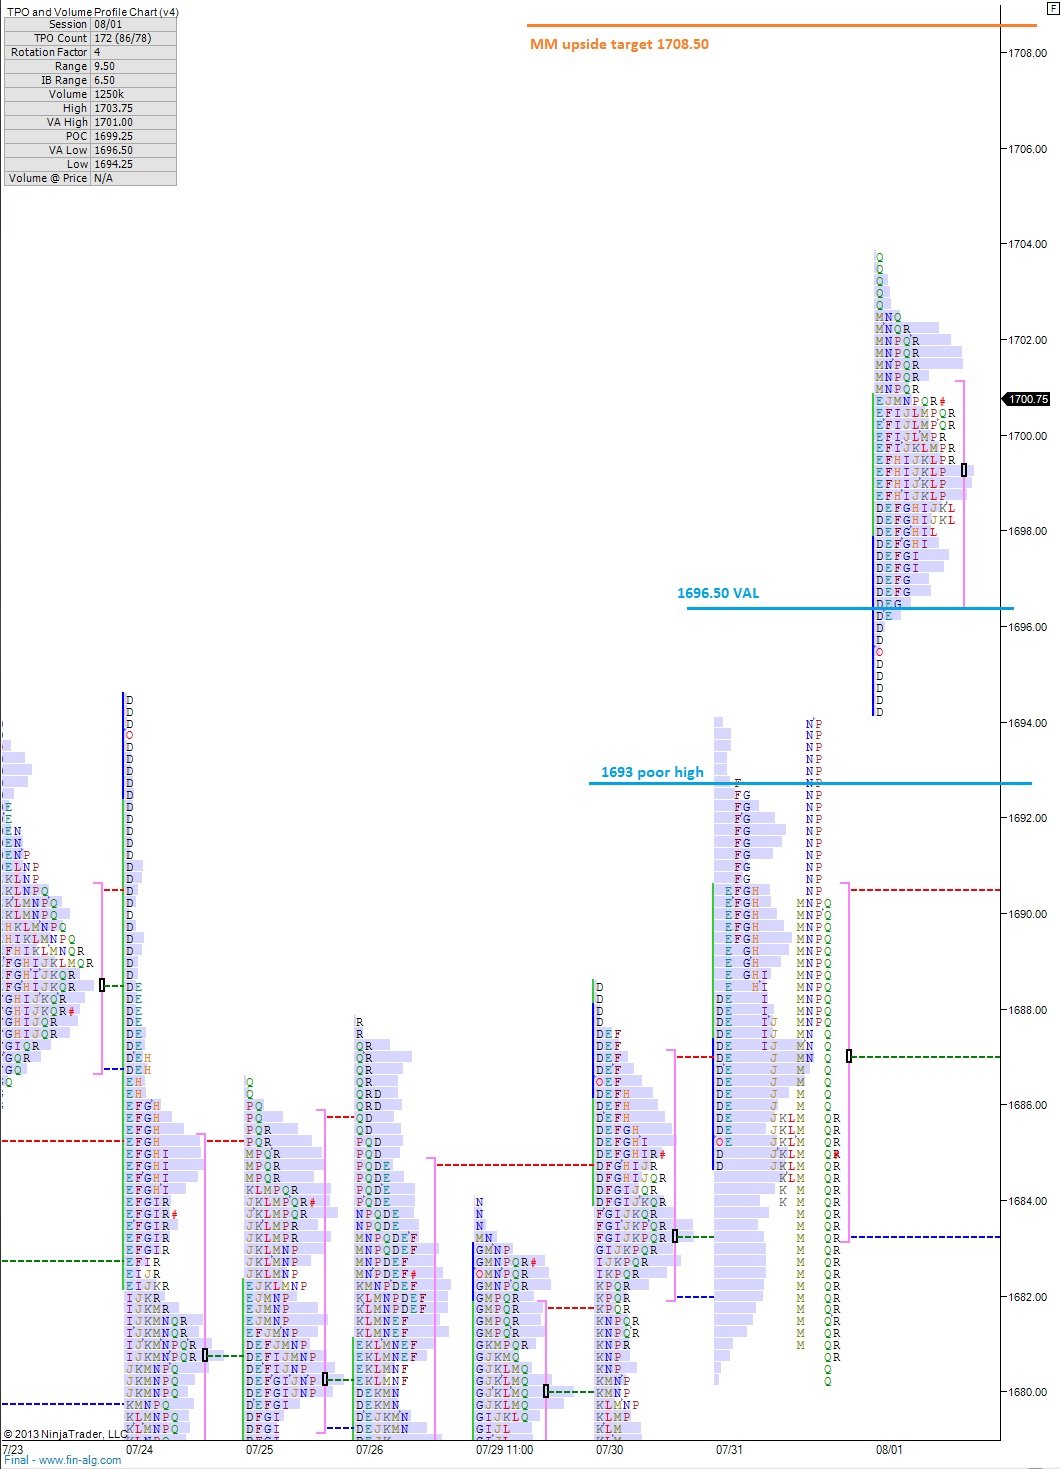
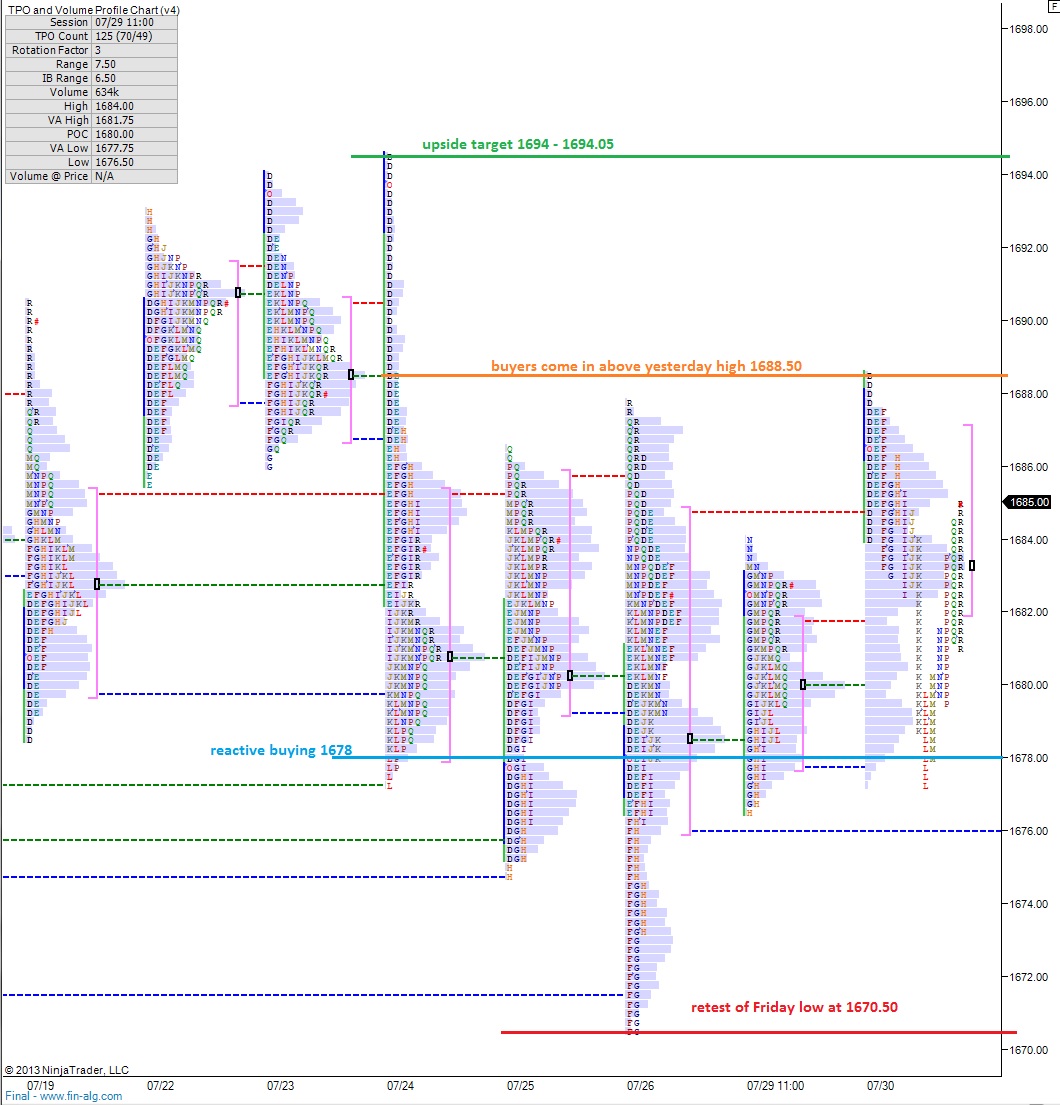
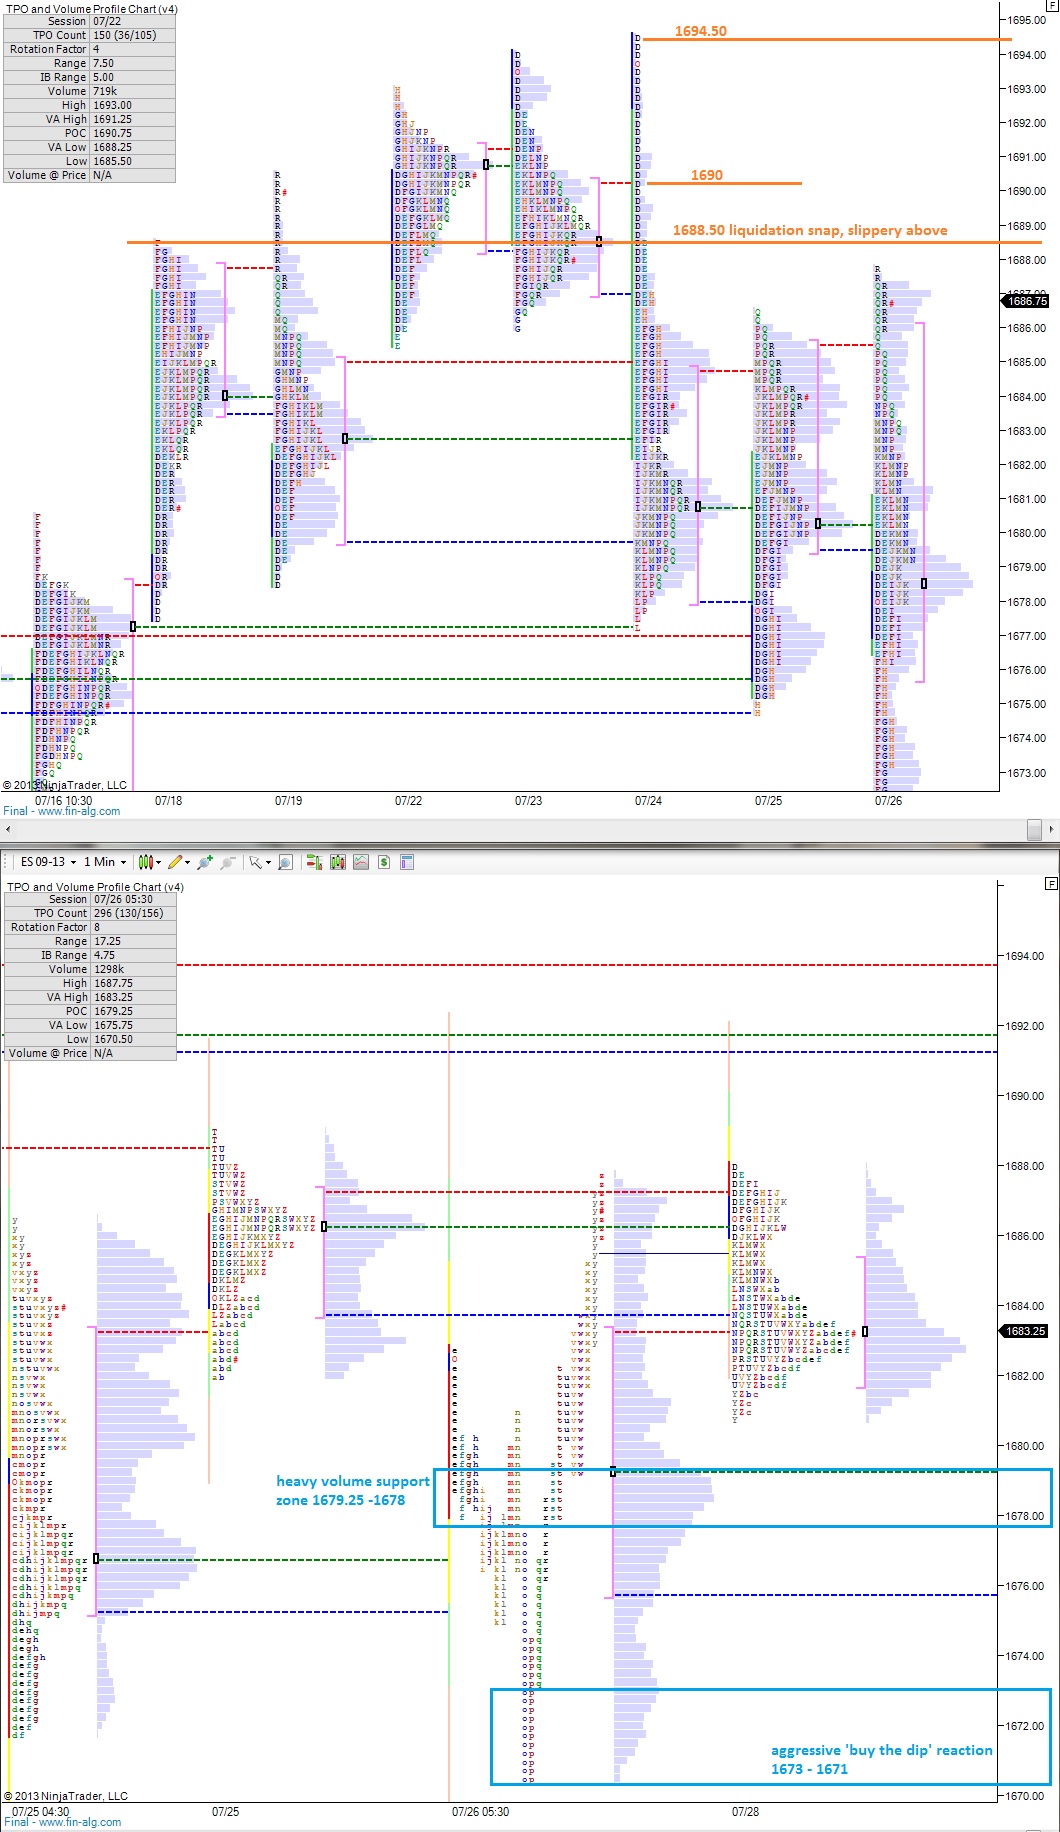
I’ve highlighted some upside observations of resistance in the following market profile charts:

ES_MarketProfile_08072013


Comments »

Tuesday Morning Sentiment Analysis

A little bit of softness in the overnight session as we continue to hover along at the all-time highs in the stock market. Overall however, we’re consolidating after more impressive progress higher by the bulls.  If we are indeed to see the market roll over and price correct lower, there are a several levels of support the sellers need to reclaim.

One piece of context to keep in mind early on is the gap above created by the overnight weakness.  I’ll certainly be on watch for buyers to trade us back up to 1702.75 early on considering its close proximity to our current trade price.

On the downside, I’ll be looking for signs of buyers at 1693.50, Thursday’s low, and also our current August low.  Actually, the August low is 1694, but my profiles tell me to watch two ticks lower.  I know it’s a bit granular but it matters.

Any sustained trade below 1693 could result in a larger rotation lower, taking us down to 1690.50 then 1689.50.  Failure at these levels puts us back inside the large value distribution we built prior to making fresh highs.

To the upside, I’m still very interested in 1706.  We’re starting to show signs of buyer exhaustion, and that levels represents the exhaustion point according to my data.  Should this be proven untrue by strong order flow, I’ll be impressed.

I’ve highlighted a few scenarios I could see playing out today and important price levels on the following market profile charts:

ES_MarketProfile_08062013

Comments »

Keeping Our Head Clear at the High Altitude

The overnight session was quiet and balanced, with a slight upward bias after gapping lower a bit.  As a result, we have a profile which suggests we may see a rotation lower early on.  The action overnight was very slow however, and didn’t produce much by the way of an auction.  Therefore, both the poor high (double TPO) and the low are susceptible to breakage.

I’ve drawn out three scenarios on the 24-hour profile chart (first chart below) none of which would surprise me much.

There’s still a gap present in the regular trading hour (RTH) profiles dating back to month-end.  Therefore, although it would seem abnormally weak and corrective for price to trade back down to 1681.75, it should still be in kept in the realm of possibility.  However, my view is that demand for equities is high, especially for the month of August (historically a weak month) and everyone is looking to buy this gap, so we may not see it.

Upside target is 1706 (measured move target).

Other levels which may see demand flow in are 1696, 1690.50, 1689.50, and 1682.50.  I’ve highlighted these levels of support on the second market profile chart:

ES_MarketProfile_08052013_24H

ES_MarketProfile_08052013

Comments »

Friday Sentiment Report

Well here we are on another Friday, the first of its kind for August, and the market has confidently settled into the 1700 handle, using the overnight session to familiarize itself with the price level and digest the progress made.

The markets took a pause overnight, printing a quiet and balanced session.  We have payroll data out in about 20 minutes, and I suspect we’ll see some action leading into the announcement.

Yesterday was an upward auction all day after gapping higher, the market never suggested a gap fill to be in the cards, thus we’ve left a large gap open.  It’s not clear on the profile because we closed near the low of the day on Wednesday and the market came down and tested the high-of-Wednesday to the tick before proceeding higher, but a gap in fact does still exist.  And I have a strong feeling there are participants looking to buy that gap down at 1681.50.  However, they may not see the level print before confidence resumes in the marketplace.

The market is extended, but it’s Friday and we could enter the realm of irrational.  Again, I suspect we’ll have more visibility of the rotations after the data at 8:30.

On any pullbacks, I’ll be looking for signs of buyers at 1696.50 than 1693.  The measured move upside target is 1708.50.

I’ve highlighted these observations on the following market profile chart:

ES_MarketProfile_08022013

Comments »

Building Energy For A Powerful Move

The overnight session was all buy side as the /ES contract continues to print a near-perfect sine wave across time.  The action looks to be building up plenty of energy, and I suspect the next move away from the large balance area will be a meaningful one.

The bracket extremes on this gyration range from 1694 – 1680.  The action within these prices encapsulates all of this week’s trade.  As I type, the bulls are pressing up against these upper limits, printing the 1694 handle about an hour back.  The momentum is certainly theirs to run with, should the buyers press their initiative early on.

Let’s not make this any more difficult than it needs to be, if we sustain trade > 1694, we’ll be targeting the 1700 century mark. 

Should we trade decidedly lower, or perhaps see a failed push by the bulls, I’ll be looking for signs of buyers first at 1687, then again at 1683.  Failure to hold these levels could introduce selling into the market, pressing us to test 1676 and perhaps even Friday’s low at 1670.50.

I’ve noted these interesting levels on the following market profile chart:

ES_MarketProfile_08012013

Comments »

Month End Index Levels

We printed a very balanced, very symmetrical profile overnight as it appears the broad market is on pause awaiting the GDP and Fed data.  We had a rotation higher overnight the stalled before the 1688 level I mentioned earlier as the bull target.  Sustaining trade above this price could bring in the buy flow at an accelerated rate.  I’ll be looking for price to run up to 1694 in this instance.

We auctioned back through Monday’s inside day yesterday and found buyers in the process.  The auction was healthy and produced a quality excess low we can monitor if any weakness presents itself today.

Should we trade lower, our expectations would be for buyers to show the same reactive nature at 1678, if they don’t show up, I’ll be on guard for liquidation lower, retesting Friday’s low at 1670.50.

I’ve noted these observations of the following market profile chart:

ES_MarketProfile_07312013


Comments »

Buyers Hold The Upper Hand Early On

The overnight market was relatively quiet and balanced and has begun showing early signs of upward momentum.  Pair this with the fact that we printed an inside day on the market profile and it suggests a reversal higher may be at hand after a mild drift lower.

To be sure, we’ll need to see price recapture and hold above 1688.75.  We’re currently only an earshot away as we approach 8am.  Given the small gap present from yesterday’s close however, we may see sellers coming into the market early and attempting to press us back down into the large value area from 07/26.

With a long bias, I want to see the market reject lower prices at the 1682.75 area.  Secondary support exists at the VPOC 1680 then the VAL 1678.50.

I’ve presented these thoughts visually via the following market profile chart:

ES_MarketProfile_07302013

Comments »

Month End: Step Your Game Up

The globex market opened up Sunday evening without much fanfare and has drifted sideways-to-lower overnight in a balanced manner.  As of this writing, the futures are off about 3 points from Friday’s close.

We’re entering a week of moderate headline risk with the S&P 500 hanging around all-time highs.  The buyers may attempt to carry their Friday momentum into today’s session and their first matter of business is sustaining trade above 1688.50 where the liquidation break began last Wednesday.  If they’re able to accomplish this target, I’ll be on the lookout for a swift trade to 1690 then 1694.50.

Looking at the 24-hour profile, it suggests we’re accepting the large value area from early Friday morning and may work back through it to ensure the marked has sopped up all the buyers below.  Bulls will want to see the market significantly slow down in the heavy volume range from 1679.25 – 1678.  If we blast right through that range it would suggest a shift in sentiment and a possible retest of Friday’s ‘buy the dip’ lows.

I’ve highlighted the levels mentioned in the above scenarios in the following market profile charts:

ES_MarketProfile_07292013

Comments »

Early Weakness: Can The Sellers Press?

Weak market overnight, with the sell flow picking up around 5:30am.  I think it’s important not to locate the driver of this weakness as if it’s derived from some other market or currency, but instead to understand where the S&P 500 is trading contextually and where it could potentially go.

Although we’re pressing upon all time highs, it wouldn’t surprise me to see the market settle into a range over the coming week which means we need to be prepared for possibility.

The bulls will want to give up as little of the progress made on 07/11 (the Bernanke move) as possible to show their faith in The Fed.  Bears want the 1688 level to hold, where they flexed their liquidation muscles and pressed the market lower.

The overnight profiles suggest a lack of balance and potential for large directional movement today if we see a breakout above 1680 or a breakdown below 1675.

Breaking 1675 sets up a test of yesterday morning’s globex low down at 1671.75.  If that price fails to hold, the market will look to work down to 1666.

However, the market is showing significant signs of being oversold this morning, and given the weekly opex nature of Friday, we may see aggressive buying coming in early on.  Buyers need to get us on the other side of 1680 and hold it if they want to hold the upper hand.

I’ve highlighted these levels in the following profile charts:

ES_MarketProfile_07262013

Comments »

Yesterday’s Low Is Important Early On

As we approach month end and work through earnings we’re seeing our first bit of weakness since the v-shape recovery off recent lows.  The move has been more selective as ChessNwine has been reiterating, but for the indices it has been a unidirectional move.

The weakness spilled into the overnight session when European markets opened up.  We pressed through yesterday’s low and price was driven lower by sell flow bringing us to prices as low as 1671.75.  This price level has multiple confluence on the market profiles and should be monitored in relation to the other highlighted levels in the below chart to gauge the conviction of the sellers.

For the morning session, I’ll be closely watching yesterday’s low at 1677.25 and how the market treats it.  After breaching the level around 3am, we’ve clawed our way back up to it.  It will be interesting to see if sellers enter the market early and aggressive like we saw yesterday, or if something different occurs.

I’ve highlighted the aforementioned price levels and a few others in the following market profile charts:

ES_MarketProfile_07252013

Comments »