iBankCoin
I turn dials and fiddle with knobs to hone in on harmonic rotations
Joined Oct 26, 2011
4,121 Blog Posts

Busy Day Trading Recap

This morning I defined a price level where I wanted to position for the pump.  That way, even if I get pulled into a meeting to talk IRS bullshit or jerked around by my favorite underlings I can always pick up my chart and see where we’re trading and whether I should act.  It turned out to be a busy day.

When it comes time to buy into a rally, I want to buy.  I bought SE early on, thinking the market would hold my pivot at 1460 on the S&P March contract.  When the level broke, I cut TIVO.  For all I know, TiVo could rip tomorrow.  But when it was weak in a strong market and the market began giving back its early gap, I cut.

Next my eyes turned to Zale Corp to see how it was behaving after TIF missed on revenues.  They dropped some hot same-store data too, double pumparoo.  ZLC loved the news.  People who can no longer afford Tiffany but still need to get iced out can shop at Zale’s.  Shares ripped hard off their 200 day moving average and I hunted a dip to buy in.  I barely caught a riskier secondary entry after the primary entry vanished as soon as I loaded up the chart.  When I bought the stock it was already up almost 10% so it felt sketchy.  Thus I only purchased a 1/3 position.  The position was in question all day.  My swing setups are all based on how the stock closes.  Obviously I had no clue where the stock would close at 11am, but given the strength of the market and the strength in the name I gave it the benefit of the doubt.  It closed strong.  Nice.

Just before lunch I took a small ¼ scale in FB.  I usually scale in thirds, but the stock has been far too beast.  I’ll ride peak-to-trough if needed to see higher prices.  However, it’s always prudent to take gains when you’re at prior levels where price has demonstrated curious behavior.  I also purchased BGMD near the highs of the day only to sell the degenerate stock near the LOD.

Coming into the closing hour of the day it became apparent the market was accepting higher prices.  All I wanted to do was get longer.  I bought GOOG to bring my cash levels down.  Then I bought APP.  I know, busy day.

Finally, I scaled off 1/3 of my full size SINA position.  It seemed a proper sacrifice to the stock gods.

All this action and I still have 35% cash in case the hanging man candle forming on the index wants downside follow-through.  It was the only warning indicator flashing to my eyes, but it could signal buyer exhaustion.

I have to go swim now I have far too much energy.  Take care and get out of that chair friends.

RA RA WITH THAT SINA:

Comments »
Baking a Layer Cake

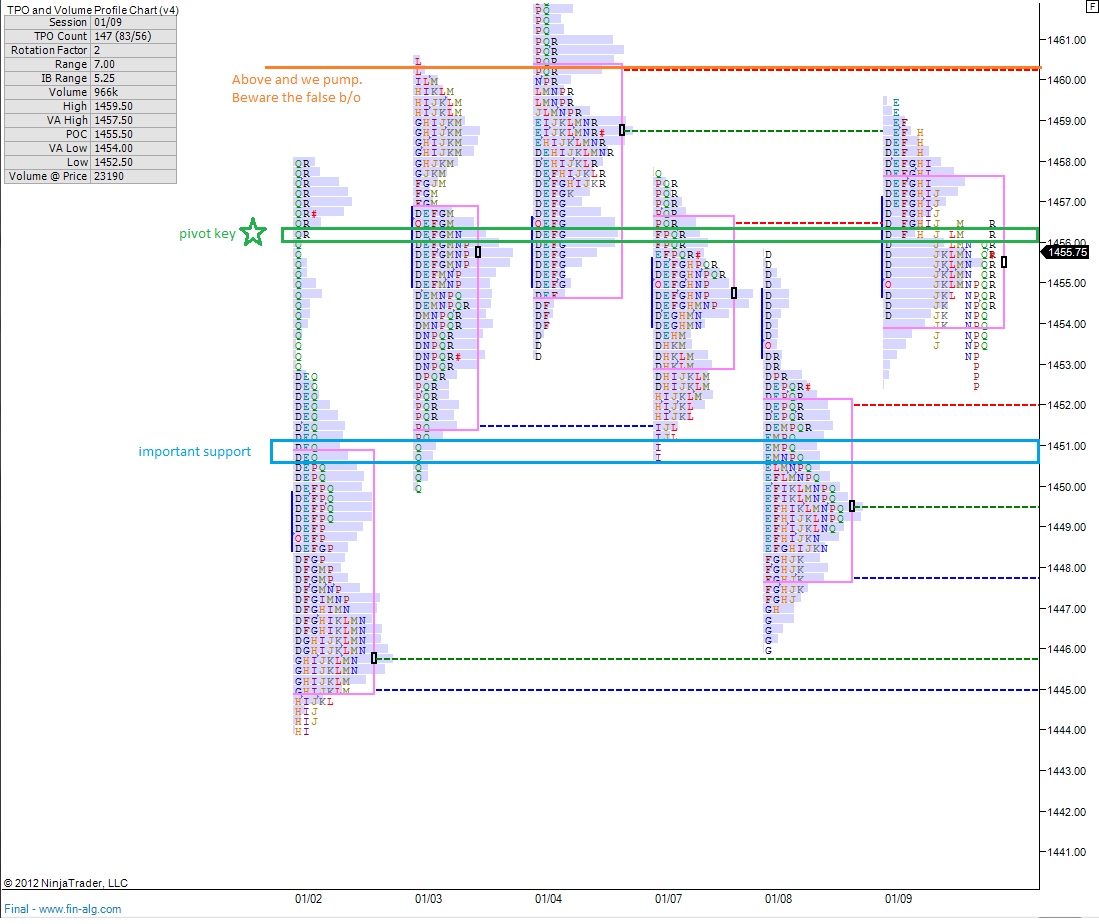
We’re starting to get several layers of profiles building upon one another.  Seeing this tight consolidation after the monster run we had to start the year is impressive. It suggests a strong bid is present in the market.  Support levels are holding.  I’m always on the lookout for a rug pull, but I continue to give upside the benefit of the doubt.


First level I want to draw attention to is 1456-1457.  I highlighted the price level yesterday morning for its confluence of multiple reference points.  Yesterday added another reference point to the mix after trading above the level for most of the day only to give it up going into the afternoon.  The result was a very low volume “slip” zone.  I won’t look too far into the level except to say interesting activity has occurred at the level and where we sustain trade relative to this price is our tell going into the weekend.

Key overhead resistance for reference today is the VAH from 01/04 which also was the globex high as of this writing.

Comments »

Hijacking The Fly’s Time Machine

In my last post attention was drawn to the Independent Oil & Gas sector after seeing it exhibit unique seasonality performance with a high count of stocks excessively outperforming and underperforming their January seasonality.  That tells me the industry is all over the place (read: tradable action) thus I got lazy and asked the Fly to provide me his top pick in the space.  I wanted the space alien magician pick.  Then I realized he’s a very busy man, piping conference calls into his brain and abstaining from profanity.

I then at that very moment realized I was being very lazy.

Interestingly enough, The Fly leaves the keys to his time machine lying around for the tabbed bloggers.  It’s a work perk.  I’m sure some of you get cocaine or hookers from your degenerate bosses.  We keep it classy and get data.

Without further adieu, here is the stock plucked from The Fly’s computer brain.  LONG LIVE THE FLY:

CLICK HERE TO SEE THE AMAGAMATION OF THE FLY AND RAGINCAJUN BRAINS

Comments »

Digging into January Seasonality

Seasonality is new to me, and like all new things in life, it brings out my childlike curiosity.  This same curiosity, mind you, killed the cat.  With that in mind, when I approach anything new that can impact my little purse (very homo) I like to get my hands dirty.  All covered in nasty data.  Okay this is getting weird.  I like it.

I pulled some very basic seasonality statistics from The PPT into excel to get a sense of normality.  Specifically, I analyzed the following:

Month To Date Returns – Average January Monthly Returns

The idea behind the above function was to get an idea of how far stocks have deviated from their average January returns to get a grasp of what is “normal” and what is not.

This is not normal

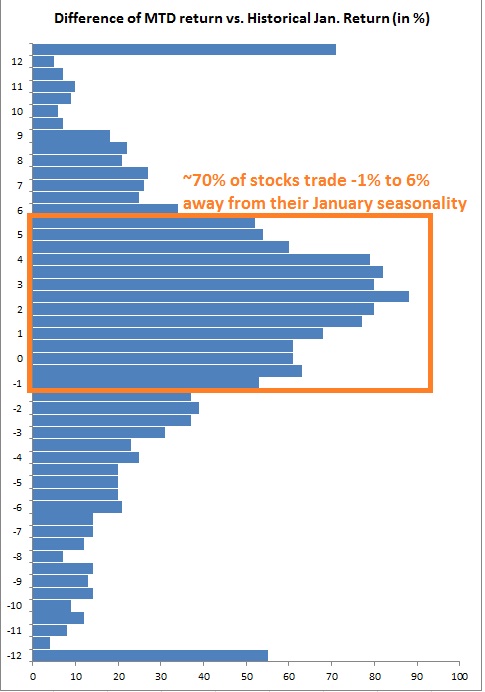
I define normal using histograms. Similar to the value areas I’ve been writing about in the mornings, I want to find where around 68% of the data falls. I consider any outliers as unique and perhaps warranting attention.

Using all PPT stocks that trade more than 500k shares on average, I built the following model:

You can see the model skewed to the high side, over the 0% line indicating an outperformance of January seasonality is happening in more stocks. Also you can see the range or value area where most performance deviations lie.

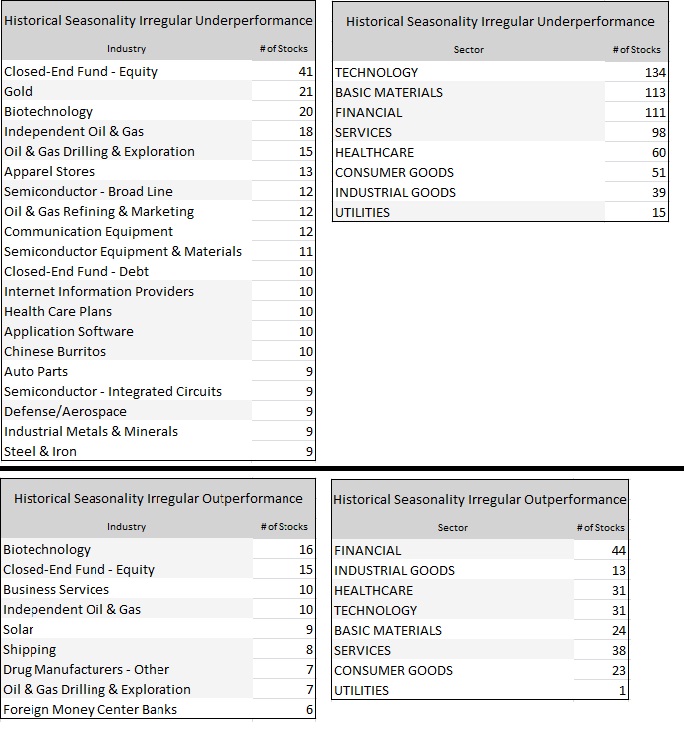
The top two tables tally the lower tail (below -1.5%) and bottom tables the upper tail (above 6%). I know, it’s backwards. You’re backwards. See below:

So what’s the play, the action? Well you can see biotech ranks high on both lists like a good lottery ticket. Fly told us this early this morning, so no insight gained there. Gold as an industry and a gaudy jewelry is failing big time in 2013, perhaps you game the mean-revision. Also note two oil industries making the underperformance list. Is our old nemesis the dollar to blame?

Turning our attention to the industries loaded with stocks outperforming the outperformers we see independent oil and gas. Just like the lottery action in biotech, the same is happening in this industry. HOWEVER, the difference is several fine folks in these halls know a thing or two about this industry. I must assure you I am not one of them. But if anyone (ehm, Fly) would like to suggest a top pick in this industry I’m all ears.

Solar made the list (obviously) and so did Business Services and Shipping. I don’t really have more to say. I’m just presenting the data to you. I would love to see some bravery and have some interpretation of the data in the comments below. Ga’head:

Comments »

Gaps Filling – Stocks Chilling

My portfolio enjoyed a slight loss today mostly due to the shake down I received in shares of RGLD and CEDC. Moody’s decided today was a good day to throw hot potatoes at the Russians by downgrading their debt. I don’t entirely see how this company’s tiny debt matters when a Russian billionaire has taken the stock under his wing. Their debt is peanuts to him. Fund it.

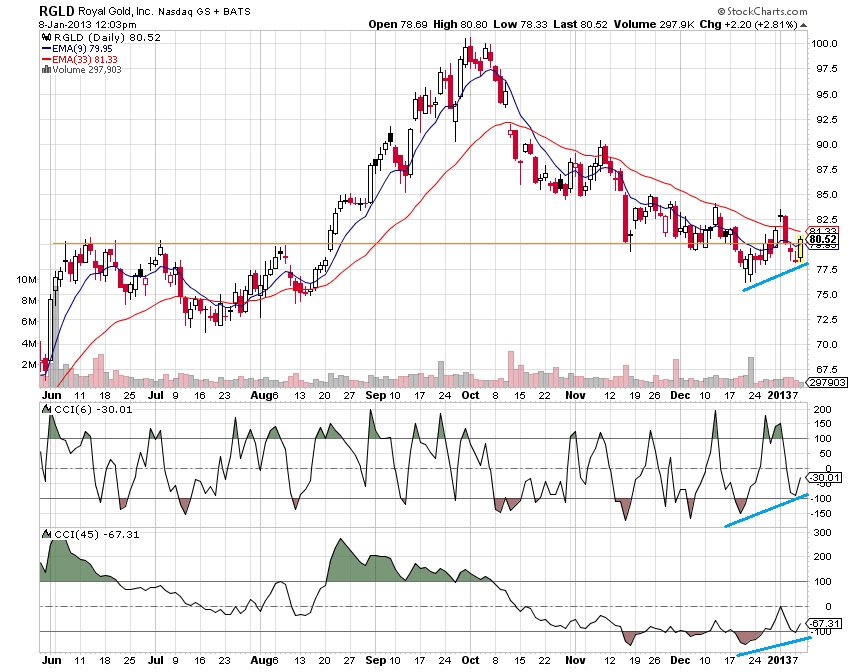
Royal Gold on the other hand is whipping around, undecided on whether or not to hold this very important price level. I don’t intend to stick around and find out after Fly damned the entire space.

Finally, I added to my shares of SINA near the highs. I still like the name.

Banks caught a slight downdraft too (sans my Goldman).

All of these losing propositions were muted by my Facebook position.

Overall, the market traded lower in a rather orderly manner, especially the S&P which spent the day filling its opening gap.

Comments »

Bulls Building a Case

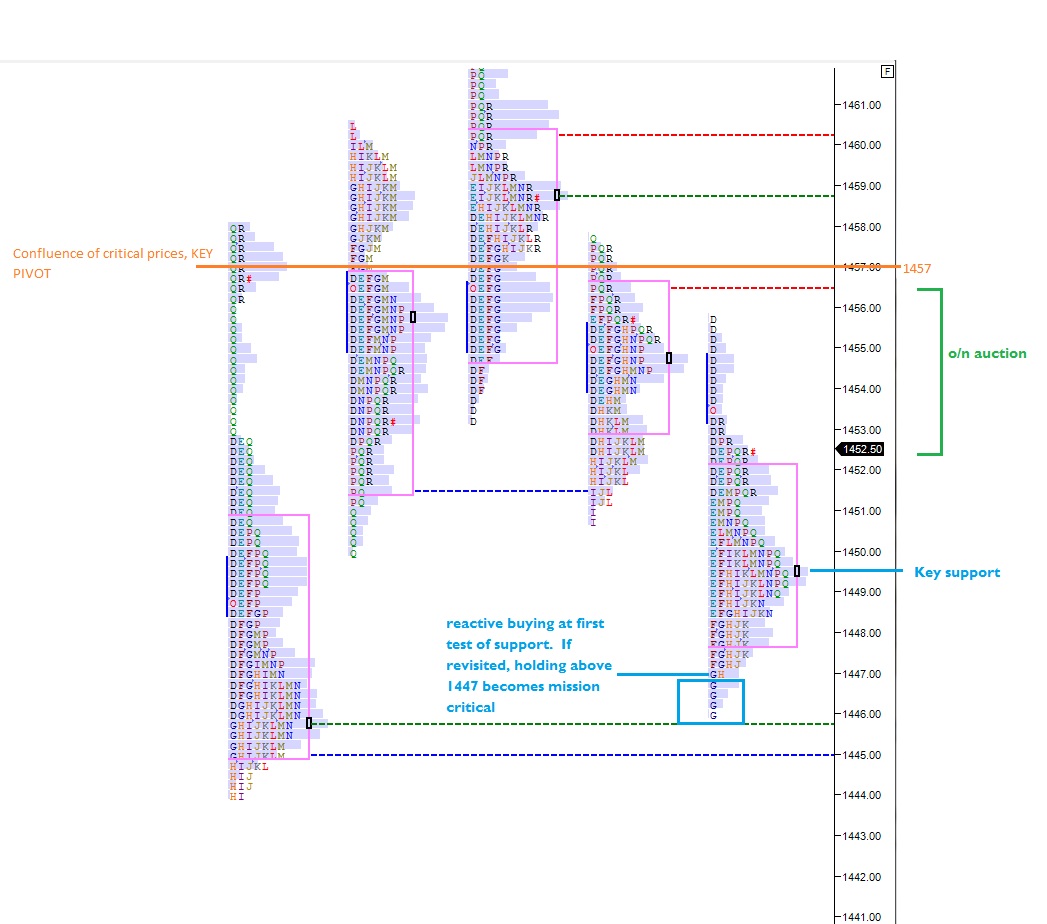
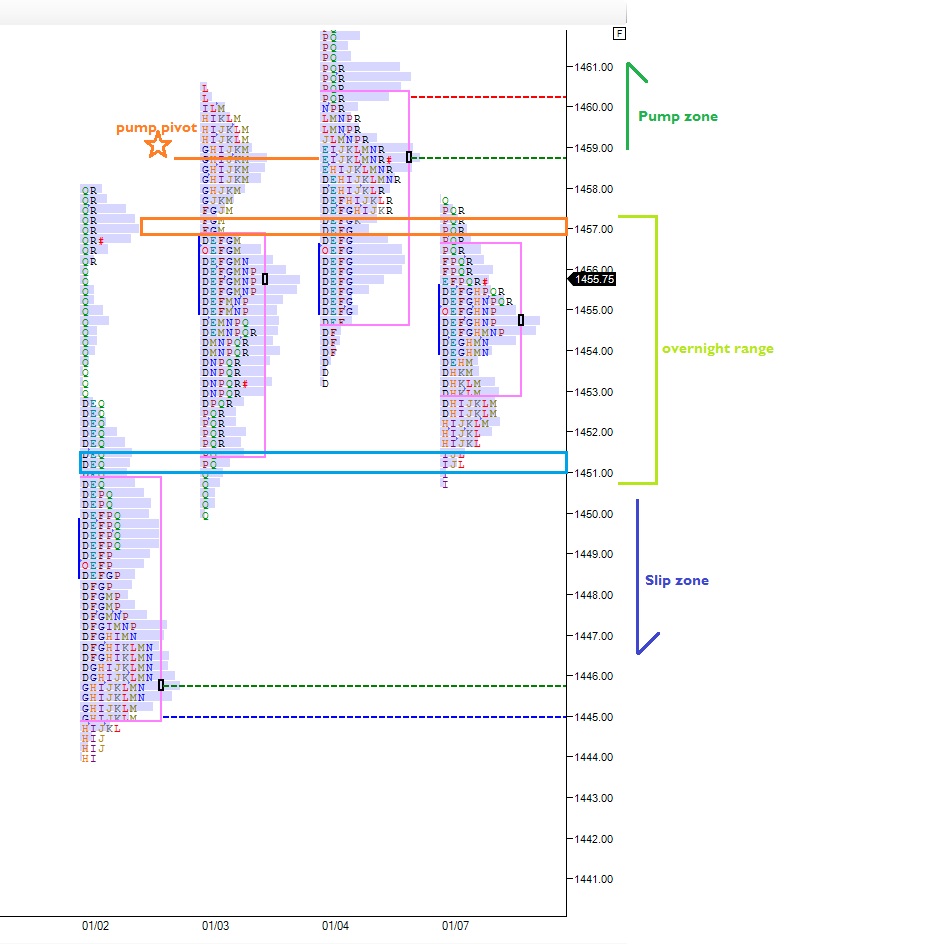
Yesterday the bulls showed up and defended the critical breakout level from the beginning of the year.  Their reaction to the lower prices can be seen in the profile as a single print of TPOs.  Just like a low volume zone, we can draw knowledge from this area.  The market spend very little time trading in the area as buyers snapped up the perceived discounted price.  We therefore can expect those same buyers to show up on any attempt to revisit these levels.  If they do not show up and defend the lows, it’s our cue something has changed, and we need to reevaluate the overall tenor of the market.

I’ve also marked 1457 as a key level.  Not only did the overnight session top out just below this level, there are multiple levels of confluence here.  Where we sustain trade as the week progresses will be a solid cue to the direction of the market in the swing term.

Comments »

Stalker List

I like this dip and need to get all the names I’m stalking on paper.  Ideally, I would write on the pages of a small notebook in blood or on a mirror with red lipstick like a good stalker.  But then how would I share them with you?  Facebook?

Stalking the following names for entry:

TPX, APP, JIVE, EWJ, and SINA (to add)

MOAR Update: ZLC, ATML

Note: I’ll be adding to this list as I find more opportunities

Side note: CEDC failed at the very basic necessity of meeting the listing requirements for NASDAQ yesterday.  Yesterday it was a non-event.  Today it’s a decocking.  I may close my position.  Developing…

Comments »

Royals Chopping Up the Bears

My favorite mining play has been Royal Gold (RGLD) ever since Senator Gint brought the stock to my attention.  The stock has always flowed in a rather smooth manner, even when taking my coin.  I prefer this type of behavior when I’m trying to build a large position.  I don’t want 5-10% positions in cocaine monkey stocks like ZNGA (a current long) because my portfolio will oscillate too violently.

Today the stock is reclaiming a VERY critical support level even as the rest of the market sells off.  I like the potential bottoming characteristics the stock is exhibiting and currently have no precious metal exposure.  I think the stock has much work to do before I can build a full size position, but I’ve initiated a medium-sized trade today. 

NOTICE: this is a trade with a tight stop until the stock proves it’s ready to start behaving again.

Comments »

Well Behaved For Now

http://youtu.be/0UjsXo9l6I8

The pullback yesterday occurred in an orderly fashion with the market finding support at the first key level below Friday’s range.  It wasn’t important that we traded inside of Friday’s range. Had we done so that could have cued us to an impatient bull.  Instead we want to see now is price tighten and coil into a range.  This will give us a tight set of profile characteristics to cue from.

Below I’ve noted the chart and my expectations should we trade above/below certain price levels.  Should we enter the below “slip zone” it will be vital that bulls defend the support down at 1445.  The area is home to heavy initiative buying and losing the level puts many positions initiated into the New Year under water.

Comments »