iBankCoin
I turn dials and fiddle with knobs to hone in on harmonic rotations
Joined Oct 26, 2011
4,121 Blog Posts

My Mojo Is Flowing Today

Good afternoon speculators, spectators, and readers of all kind.  The markets are ripping, still, set to print a V-shape more delicious and powerful then all preceding V-shapes.  V-shapes truly are beautiful, what with the symmetry and all…I hope the action has treated you well.

Everything was up today.  There is not much more to say.   The stocks that weren’t up, like Zillow, eventually went up.  I do not always nail every trade, but I can put an official #NAILEDIT stamp on trading Zillow through earnings.  It all started yesterday, when I SOLD all my shares ahead of the announcement.  They beat across the board, yet prices were 5% lower at the open.  Seeing the NASDAQ off to an early charge, I gobbled up call options in Z, right about when we printed the low of the session.  Spencer Rascoff would be proud of my bargain hunting prowess.

SpencerR_Zillow

The LED trade is about to make its move, finally.  I was early to this trade by about 1.5 months…no big deal.  It can be frustrating exposing yourself to the market for that long while you wait for a trade to set up.  Such is the price one pays (in time) when they decide to take a top down approach to stock picking.  The idea is solid—every lightbulb will be LED.  The marketplace of stocks however, is fickle, and only pumps when the stars are aligned for pump-o-mania.  I am happy to say, the stars are finally aligned for PUMP-o-MANIA 80’s style for LED stocks.  If we don’t pump this time, I am out and will use said funds to start my own damn LED company.

I like the solar trade to pair with my LED trade.  You generate the cheap electricity using the great powerplant in the sky, and you use said energy to fuel the energy sipping LEDs.  Doesn’t that sound like a better world?  Then again, everyone eating health food sounds like a better world but WFM is dead and CMG is the future or instant gratification.  Again, it is tough to invest in ideals unless you buy and walk away for years.

I bailed on Facebook yesterday because a video is going viral showing the fake ‘likes’ people are buying from FB.  Lo and behold, the catch me if you can trade continues on.  Now I have to wait on the sidelines for the correction so I can get back in.  Same with Twitter, all I have is a small stake when I got fickle and sold the shares I bought for $50.02 last week.  I am fumbling the social media trade and question whether I am worthy of the Frank Abagnale avatar.  However, I am not motivated enough to change it, yet.

Elroi has been in the shop all week getting a tune up.  His preliminary update will be complete at 9pm tomorrow, then I hope to get his next mod completed over the weekend so I can take him back live come Monday.  He has work to do.

I have two pot stocks: PHOT and GRNH.  If I am going to dabble in OTC degeneracy, I refuse to pay more than $1/share.  I can get a way more potent position (pun intended) without being any more vulnerable to the shenanigans of OTC listed stocks.  Hence, I would not touch MDBX, CBDS, or any of these high priced illegal stocks.  Instead I may consider HEMP, or even MJNA if I must.  This is high speculation (pun intended) so tread carefully.

I had a piece of ANGI options left into earnings after scaling some off at a well-timed peak.  The small loss is being offset 10 fold by OWW, which is going bananas along with the rest of the travel industry.

I have too many side bets, I realize, after writing this post.  I need to concentrate down risk before the next correction.  And by concentrate, I mean take fewer, larger, positions.

Have a good one.

Comments »
Shaking Off A Doji Print

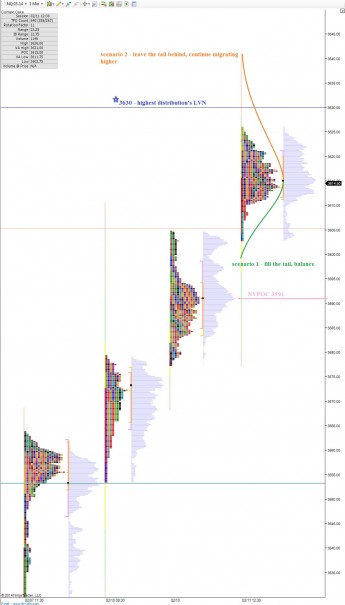
Yesterday we printed a tight ranged doji candle on both the SPX and the COMPQ, signaling indecision on the part of buyers and sellers and a marketplace coming into value.  It now appears the markets have found supply up here which needs to be worked off.  We may begin to see the auction process return to two-timeframe action after four solid days of long timeframe dominating the action.

Futures are lower overnight, and sellers are attempting to work down into 2/10 prices on the NASDAQ.  We have many interesting levels below which we left behind during the dynamic push higher.  I have highlighted a few potential scenarios on the day, and also some key price levels on the following market profile chart:

NQ_MarketProfile_02132014

Comments »

Morning Market Context Report

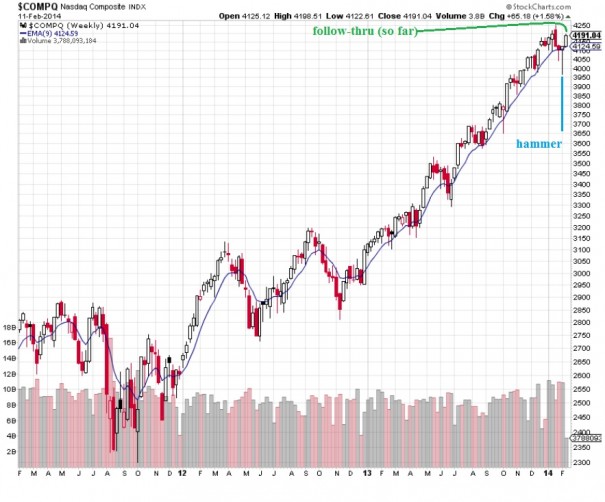
Today is day three of a week that has thus far produced a solid bit of follow through on the hammer reversal candle printed on the NASDAQ composite, see below:

COMPQ_WEEKLY_02122014

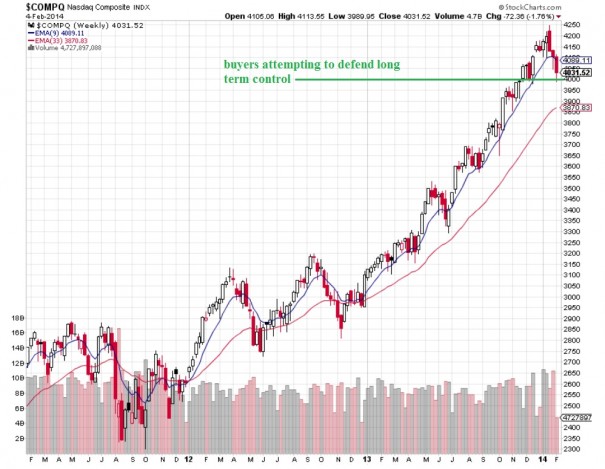
Remember, that only one week ago today, the long term control of the buyer had come into question, however we maintained that the buyer still held the control.  One week ago today was the inflection point that tripped the rally:

COMPQ_WEEKLY_02052014

Thus buyers remain in control of the long term auction after being put to the test last week.  Once a market finds a floor, or a lowest bit, it begins the process of finding the ceiling.  This is the discovery phase where price moves quickly in the opposite direction in search of excess that motivates selling.  We can look for a large selling wick perhaps, or even a subtle rejection of higher priced value.

On the intermediate term, we have come into balance, however the point of control is at lower prices.  Intermediate term balance dates back to January 24th.  I would produce a wonderful chart of this intermediate term balance, but my primary charting platform is two days into a massive elroi optimization.  Thus I must estimate intermediate term control VPOC to be around 3553.

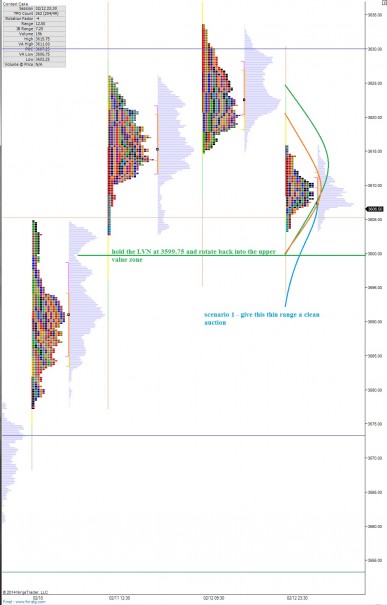
Short term, buyers are in control.  This can be seen via the migration of prices higher, aggressively.  Value areas are not even overlapping yet.  This is strong market activity.  Before the sellers can regain control in the short term, they will first have to create some overlapping value.

I have sketched out a few scenarios for the day, as well as marked a few key price levels on the following 24-hour market profile chart:


NQ_MarketProfile_02122014

Comments »

Observing The Rally With Market Profile

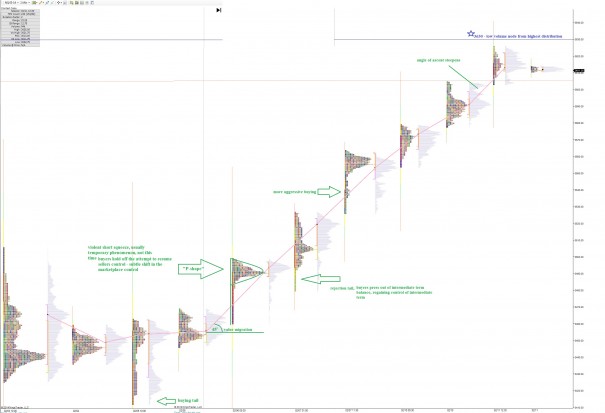
I have stitched together the last eight days of market profile in the /NQ_F, the electronic futures contract representing the NASDAQ 100.  Before doing so, I went through the price action and separated the profiles in to the proper distributions.  The resulting picture is an informative piece which we can use to measure future inflection points against and also analyze real time.

Given the macro nature of market activity recently, I decided to use the 24-hour profiles in this representation because I feel it shows the true auction taking place as money sloshes around the globe around the clock.

I have noted the observations I deemed significant, and the subtle shifts in sentiment leading up to the rally.  Do you see anything that interests you?  Click and enlarge this one, it is pretty huge:

NQ_correction_Bottom_022014_w_notes

Comments »

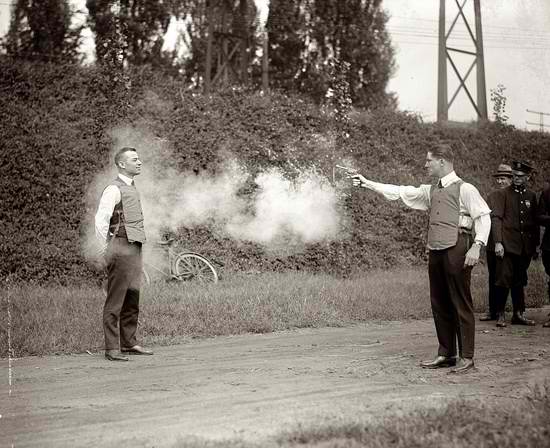
Headshot

First and foremost, if you are selling the TSLA $200 dollar roll, you’re doing it wrong.  Sell it at $225 you goof.  I want to take a quick bow, over here, for sticking through this bad boy all quarter, grabbing the golden ring in the process.  Here we are, at the $200 hundred (extra redundant) handle, wondering if this will be the next asset mania.  I bet it will be.  You are no longer cool in the inner circles of California conservation unless you boss a Tesla through the ungodly herds of traffic.  Everyone knows you love your planet in style when you drive a TESLA, you can’t lose!

I, on the other hand, can lose.  I have proven that to myself recently via a string of errors.  Error one, I got spooked into buying TZA.  Error two, I bought SCTY yesterday knowing it was the stalwart stock during recent weakness.  Of course it takes a back seat once the rest of the market comes ripping around.  Plus earnings are around the corner.  Needless to say, I am working with a red position here.

We are experiencing a violent amount of uncertainty in the market place, even though bulls are presenting themselves as the winners.  This is about the 7th inning of the ballgame and the buyers hold a three run lead.  It is their game to lose, but the sellers could still pull off a victory here.  Right now they are losing.

My book is almost entirely long, yet my gains today are moot.  Dragging me down are SCTY calls and TZA. Even without these positions, I still would not be having a real humdinger of a day.  My book just isn’t propelling like the indices are.

A few future events can change this.  I still hold OWW calls, risk I laid out on January 22nd.  They announce earnings on the 13 and I will either lose the rest of my premium or get bossed up.  The risk reward is heavily skewed in my favor so I will let it roll.  I have a large ACAD call position, February expiration, and that chart is more wound up then a nun in a men’s locker room.

The Frank Abagnale trade in FB is still playing out, where panic buying is yet to convince me to sell.

Thus I will sit here, in a bathtub full of land mines, wearing only my TZA g-string to protect my unit.  I have a little less than 10% cash left, and I intend to use it. Soon.

Comments »

Expanding Upon A Thought: Give It Data

vestyWe started feeling the effects of a macro correction mid-January where stocks to a binary backseat to currencies, volatility, and overall index direction.  I impatiently traded the price action, buying dip after dip, through earnings, and snatching up anything that moved.  The price paid was a both a paper and actual drawdown.  I haven’t really missed a stride though, and I continue taking quality setups in individual stocks.

As I write, I have unleashed a wonderful thought onto two years of intraday data, where a bit of code can determine if an idea is worth financial pursuit.  I will not have an answer until 3.5 days of peak i7 quad core awesomeness optimizes 1.3 million scenarios of the thought to see if we have something to build upon.

A thought is a trading picture, or chart setup, or set of conditions that you see repeatedly before a move you want to trade happens.  This will be different for every trader.  One of the biggest factors you have to determine is what type of trading you will participate in.  For example, I trade swing trades lasting anywhere from 2-60 days in stocks.  An example is this TSLA trade, where I bought the earning’s reaction, rode out some drawdown, and ultimately am deep in the profit ahead of earnings.  This trade lasted an entire quarter, had some adds and scales, and ultimately I have to choose either to close out the position entirely or take a piece through earnings.  The best choice as a swing trade with no fundamental logic behind my position is to get small.  But I have digressed because I want to talk timeframes and styles.  For these swing trades, my decision making is based on daily and weekly charts of price.

For day trading, I get much closer to the action.  I like to use a range bar or a short duration bar from 1-to-5 minutes.  This is hands on trading, and my discipline is put to the test rapidly which can compound mistakes rapidly.  With a swing trade, I can eat some tacos, sleep, exercise, and then refresh the chart and objectively form a battle plan. The day trade needs the same objectivity in seconds to minutes.  Thus your diligent and undivided attention is needed.  I am now using algorithmic entries to enforce discipline.  That leaves the entire trade identification process out, but still requires one to manage the stop loss and exit.  I still find I can see when a trade is wrong sooner than the alogo.  Thus I prefer to trade hybrid where the algorithm puts on a feeler position, one contract, and I use discretion to manage the trade.

Both types of trading require context.  Everyone has their own methods of building context.  Some have powerful contacts in the industry.  Others have large groups of traders sharing their outlook and expectations.  Some measure sentiment on stocktwits and twitter.  For me, it is market profile and volume profile.  They are the auction, the essence of the marketplace.  A market exists to facilitate trade between as many people as possible.  Price is a mechanism for trade as are volume and time.  I spend the most time building context.

I am long, and will be away from my book until the afternoon on a business venture.  I think it is best I ignore the noise ahead of Yellen regardless, this is simply an opportunity to do so.  I am mostly long, a TZA hedge in place, and have new risk in SCTY and ONVO.

Comments »

$SPX Enters the Hon3y Hole

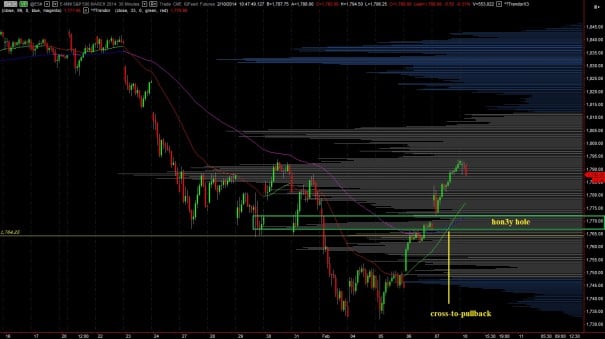
Grand morning grand traders, may you fill you wallets with several grand this month.  I want to turn your attention to the 30 minute /ES_F chart, our futures contract representing the S&P 500 index.  You can see price working a rotating off of a bounce last week, but encountering some resistance.  Such is the challenge any marketplace encounters when working through a glut of supply.  Remember all of that egregious buying I did last month?  Supply.

Anyhow, I think the SPX is important this week, especially if we see this weakness which is creeping in right now follow through in the afternoon.  With Goldman Sachs on the cusp of a breakdown and little Miss Yellen on deck, everyone is feeling a bit skittish.  An overall aversion to risk at this junction makes sense, just like taking little jabs at mother Russia from your broadcasting sofa.

The path our SPX is taking looks familiar, and is entering a long only environment I am very fond of.  Should we find buyers around 1770, I will be pedal to the metal long.  And wouldn’t it just be swell if I could shed this TZA hedge in the green?  I know you all wish the best for your humble market broadcaster.

Here is where I want to see buyers come in as we enter the hon3y hole:

ES_VolumeProfile_02102014

Comments »

A Few Words on Risk Management and Methodology

Trading is a numb3rs business.  I look at different ideas and systems and methods every year.  I am trying to find improvements and ideas just like everyone else because there is no broad stroke to success in trading.

I have found there are essentially two ways to consistently profit in trading.  You either trade a high win rate or a low win rate.  When you trade a low win rate, you also need to win the lotto once or twice a month with a super large profit to offset not only the many losing trades but also the scratches and commissions as well.

The issue is you need to exit a trade only when you know it is a loser.  Usually, you can’t know a trade is a loser until you have lost money.  If your stop loss per trade (or average loss per losing trade) is $600 and your average profit per trade is $1,000.00, with a 40% win rate the math of your trading is as follows:

On 100 trades, $40,000 won – $36,000 lost – ($14 * 100) commission = $2,600.  By the way, commission soaks up about 53.8% of your profits.  This is on the high side and needs to be brought down below 30% if possible.

On a futures trading strategy, I aim for higher win rate trading because multiple opportunities arise during the day, and it takes incredible fortitude to continue trading an idea with a low win rate.  Psychologically it becomes challenging to stick with a method or system that trades this way intraday and you may not be around when the winner that makes the system profitable occurs.

If your stop loss on a futures trade is $140 and your average profit per contract is $80.00, with a 70% win rate the math of your business is as follows:

On 100 contracts, $5,600 won – $4,200 lost – ($4 * 100) commission = $1000.00.  Again, the commissions eat a high amount of your profits, 40% in this instance.  You may think $1000 is not much to make from trading 100 futures contracts.  That’s just $10 of profit per contract traded.  However, if you improve your entries or exits by just three ticks on every trade your profit per contract is suddenly $20.50 and instead of making $1000 you are making $2050 and doubling your profit.  What if you can improve by three ticks?

The above numbers are how I approach any method of trade.  Everyone has a different preference or availability when it comes to putting risk into the stock market.  If you find one that works, say swing trading, then you need to take at least 50 trades (preferably live to get the juices flowing) and run the numbers.

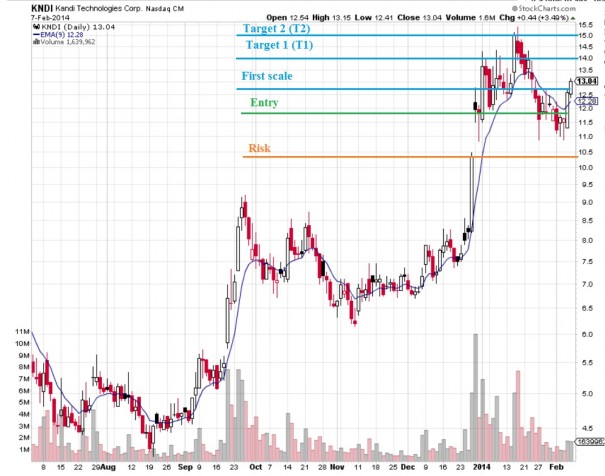
Now let’s run through a live example of a swing trade I have on in KNDI.  With swing trades, I like to max out my position size at 20% of my book, but most often I put 10% of my risk into common stock.  My idea is for losing trades to lop 1% off my book. Thus, I size my position so if the stop loss is hit, I will lose 1% of my entire risk capital.  I target to make 15% profit on my swing trades.  For swing trades, my stop loss is $700 and my average profit per trade is $1050, with a 70% win rate the math of swing trading is as follows:

$73,500 won – $21,000 loss – (100 * $14.00) commission = $51,100.

Below I present a chart of the KNDI trade.  I draw these up to help me determine how much money should be in a trade when I enter.  The second and third targets are lower probability.  I scale profits on stock trades and work my risk higher along the way:

KNDI_Feb2014

As the markets become more volatile, I adjust the proximity of stops to prevent getting knocked out of a trade due to noise.  Overall, I have a 75% winrate to my first scale, 65% win rate to the second scale, and 55% win rate to my third scale.  I tend to milk the winners by getting down to a runner size and becoming very liberal with my stop loss.  This worked out very well the last two years, letting my winners do the work while I focus on futures and such.

Now the environment may be changing, and that is exactly what I have been coding my eyes out to discover.  If we continue to see violent chop, I will be increasing position size and targeting fewer ideas with tighter stops.  I simply cannot manage 15 positions while trading futures properly.  However, I want to see if bulls build on this bounce like they have for the past two years.  If we get a mild dip, a higher low, and then return to our pleasant decent, I will keep a large book.  Developing…

Comments »

Failing A Little Bit

I have not played this correction as well as I know I could.  I tend to compound mistakes.  I think this is how people blow up.  I have enough risk management in place to prevent this from happening, but my performance, the scoreboard, clearly reflects my loose fundamental game play.  In a very boring way, I run through highlight trades thus far this year at the bottom of this post.

I had to override Elroi today.  I simply cannot stand idle and watch the algo be wrong.  It does not have context built in, and a few other very key components that would make him more robust.  The question becomes, is he broken?  To be honest, I do not think he is.  There simply need a few more variables in the code to avoid recurring pitfalls.  I still really like the information the algorithm provides.  I can see him trigger and get pinched and I know other traders are likely in the same position.  It helps me get a sense of order flow.  But it needs to be more robust and amorphous to market conditions.

Do not think that I aim to fail via broken robots that tip me off by being wrong.  Or that I get excited about losing money on a bad trade.  The process, however, the data one gathers from failure is incredibly informative.  A specialist is someone who has made every mistake that can be made in a very narrow field of work.  There are data points baked in that you will never learn unless you go out and do the work yourself.  I am frozen in remember, thus I might as well write trading logic inside the mother ship.  I enjoy the process.

My book is 75% long stocks, 3% February call options, 7% TZA, and 15% cash.  That’s a decent look, in my humble opinion.

It was a great week to trade the market.  Really I have enjoyed the whole year, although my book wouldn’t reflect it.  I am -5% thus far on the year.  To be honest, I am happy to be there.  I have been rolling through earnings season like Wiley Coyote, drunk and shooting at any stock that moved.  This gets kind of boring, but I figured I would share some highlights of the churning I have done year to date:

AAPL, OESX – guillotine

CREE – fake out

YGE – I bailed, not bad

FB – Frank Abagnale

TWTR – was tiny, bought yesterday’s close at 50.02, sold the early prints like a clown baby.  Now I want more, slowly.

GOGO – capitulated Monday

Could be worse, could be better, but we are always moments away from another breakthrough at the Raul test laboratory.

Have a great weekend.

PPT, FTW

Comments »

Bulls Did Not Cave

Even I was convinced we would slide right through this volume cave below.  It appears the net inventory became too short, and a squeeze ensued.  We are still trading near the upper end of intermediate term balance, but this environment could squeeze higher.

I have a TZA hedge on, it’s already underwater, but I don’t mind having it into the weekend.  That is, unless we blow out of this intermediate term balance:

NQ_cave_02072014

Comments »