iBankCoin
Home / Tools I Use

Tools I Use

Staying long through a -12% drawdown: how I built a real trading edge

PROGRAMMING NOTE: If you will be in Detroit the week before Thanksgiving, come out to my brief presentation on trading futures Wednesday, November 14th from 6-7:30pm.  Here is a link to RSVP for the free event: https://www.meetup.com/Detroit-Investors-Traders-StockTwits-Meetups/events/255982115/

Greetings lads,

Time changed.  By the decree of man we fell back an hour.  Our leaders can effectively change the time on clocks, but they won’t acknowledge their impact on climate.  Whatever.  Let’s skip right to making money before I lose the attention of my Simple Jack readers.

On Thursday, October 18th 2018 the predictive ‘mother algo’ inside Exodus flagged oversold.  The signal came on the heels of a buy signal that fired on October 4th, so recency bias had the risk of spooking users away from using the information to make money.

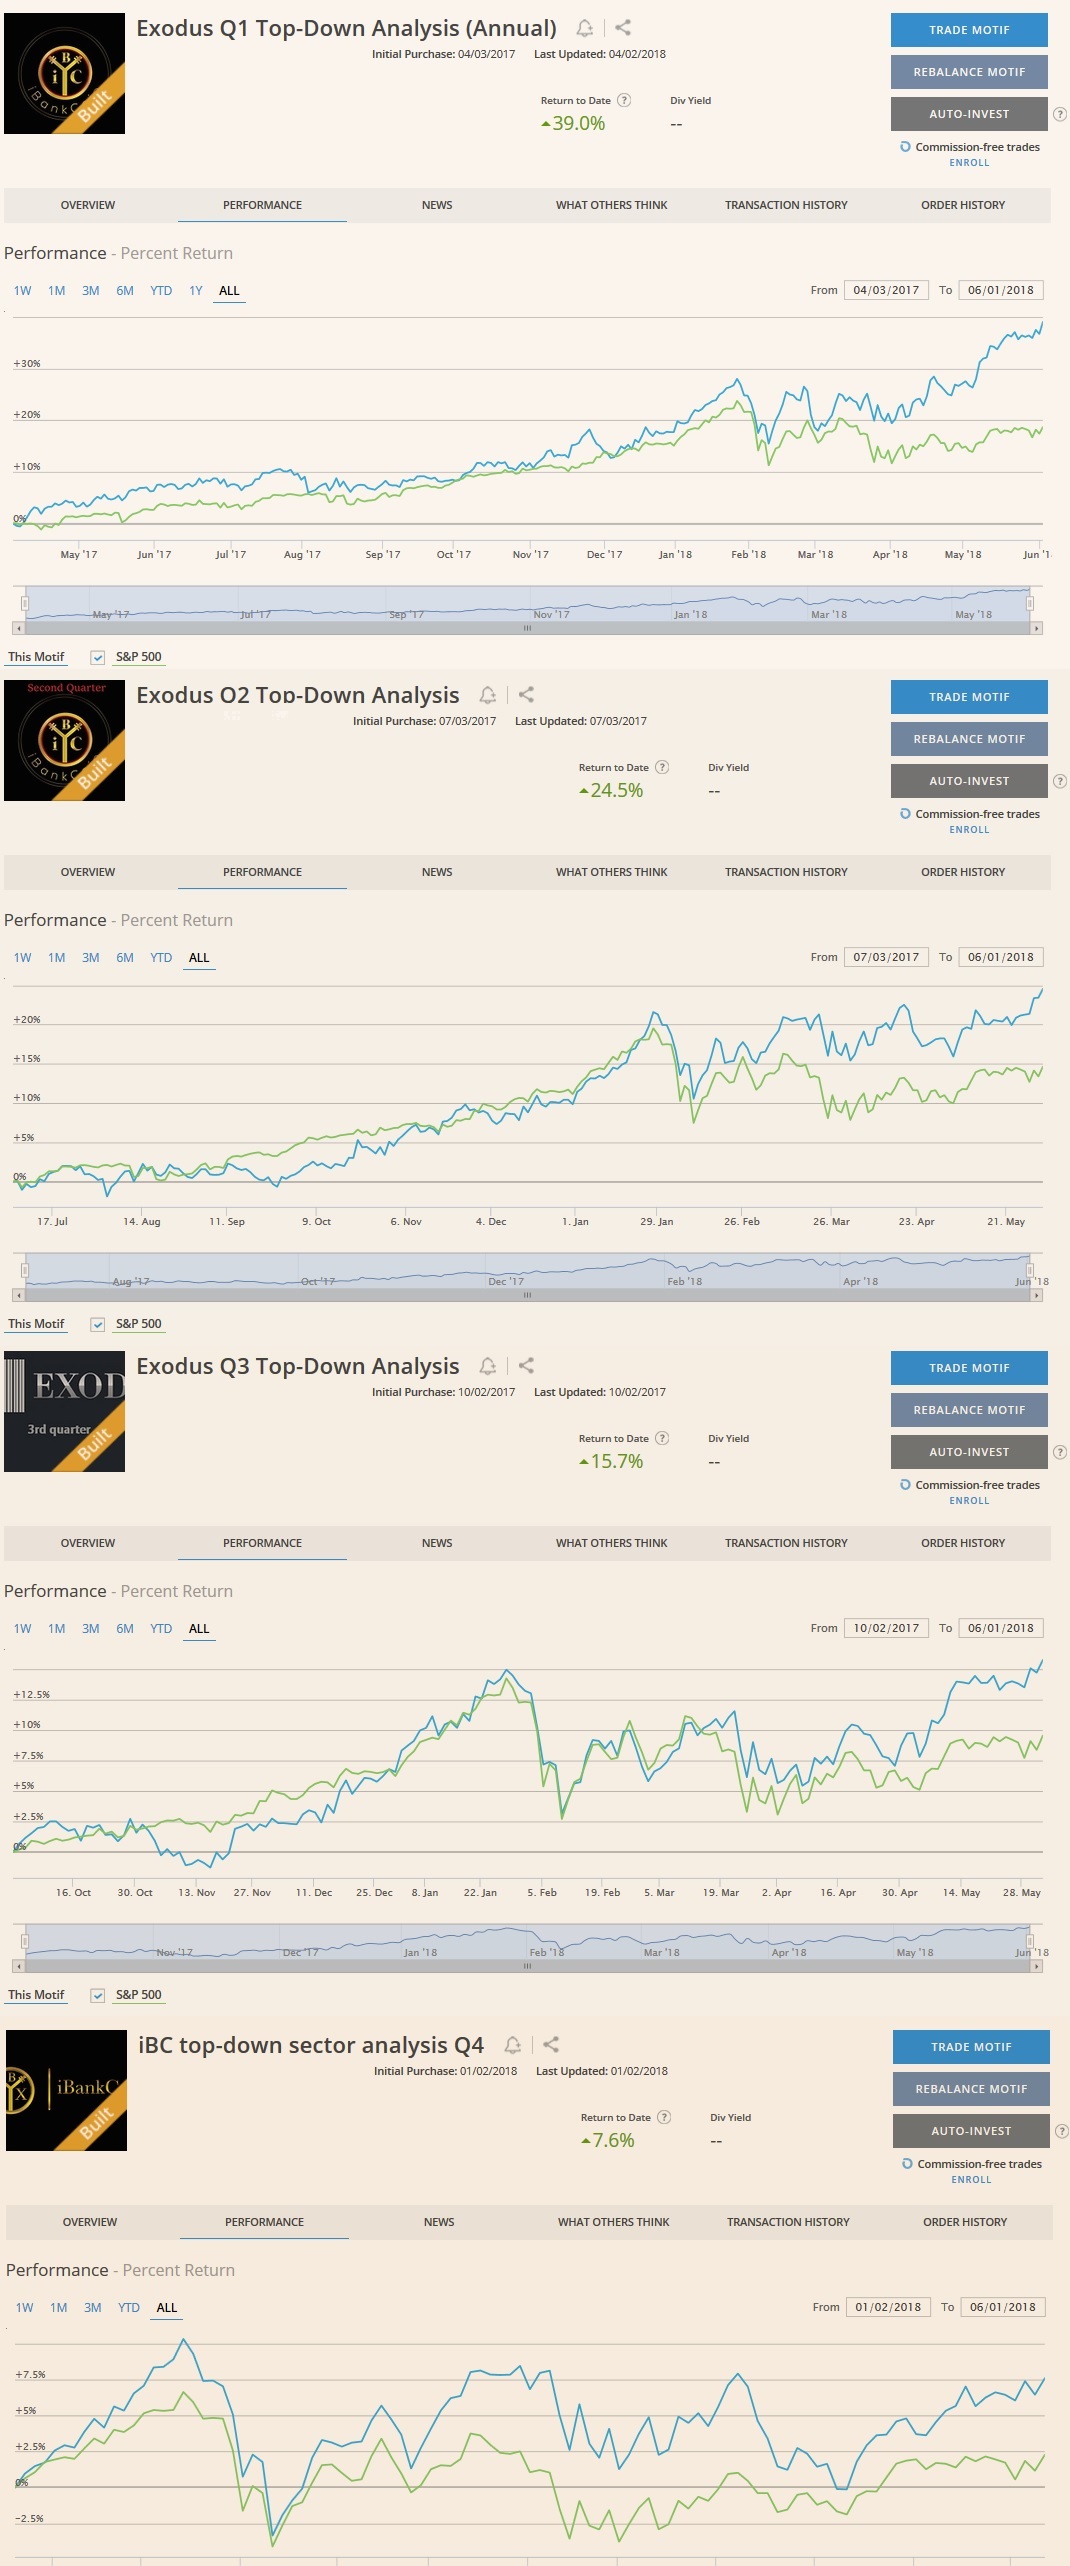
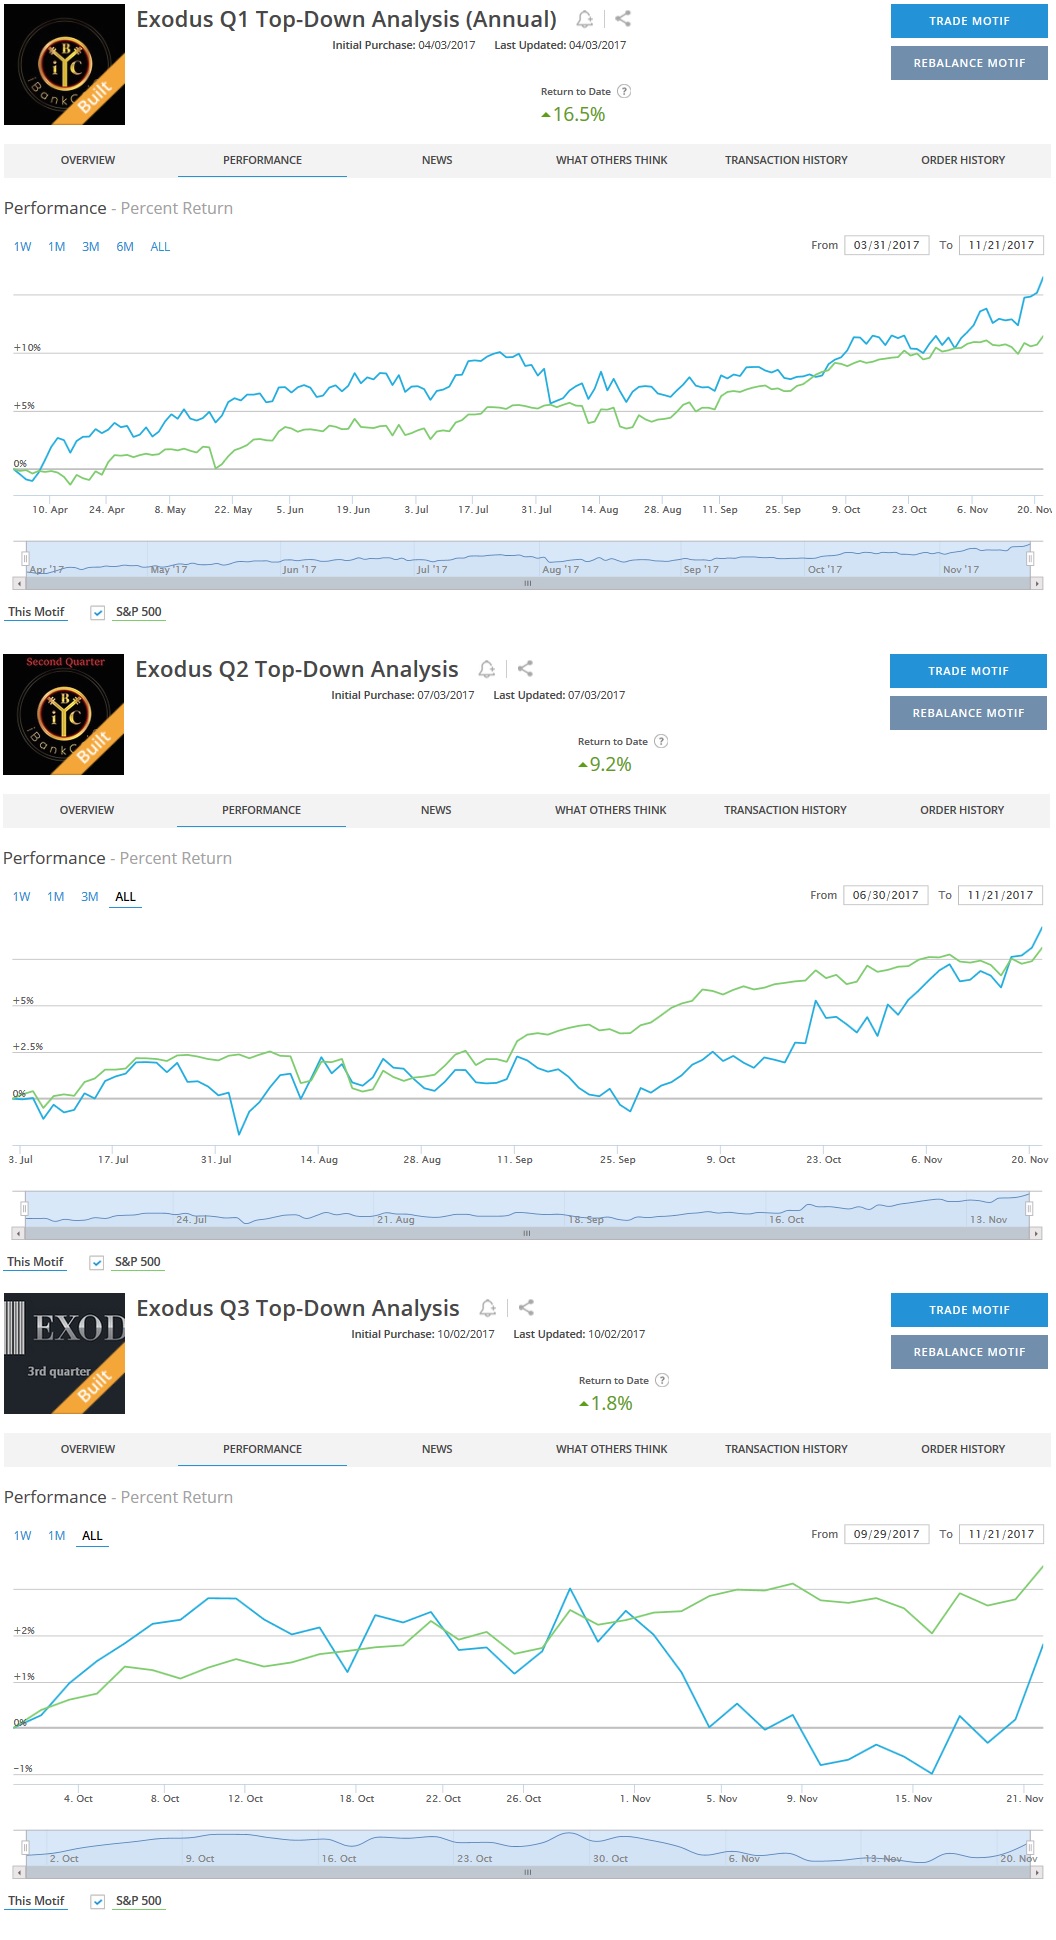
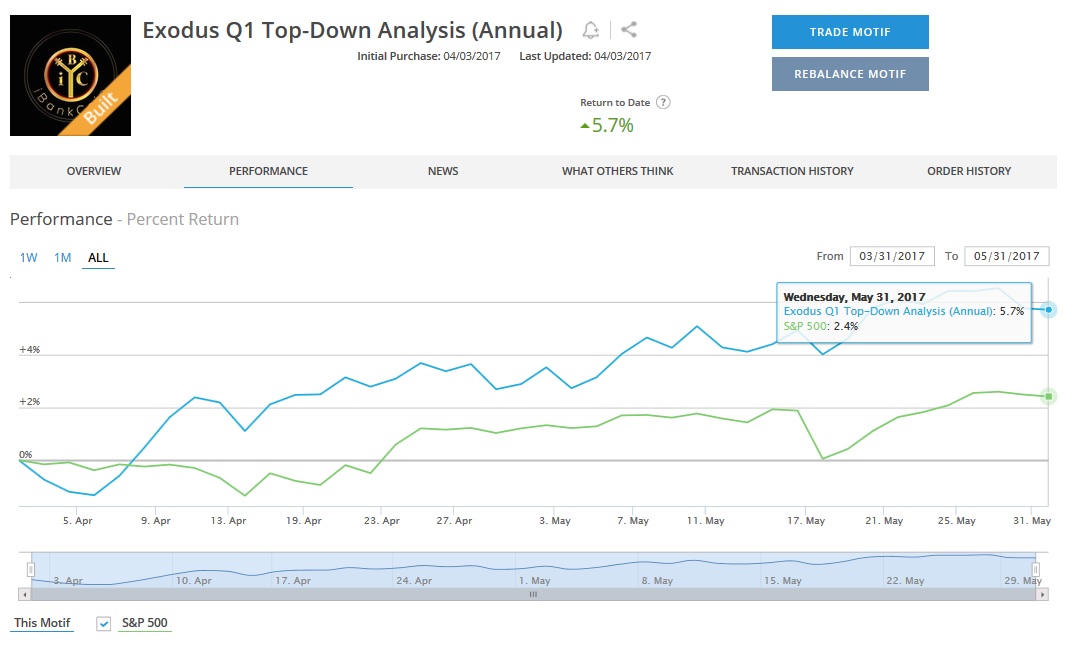
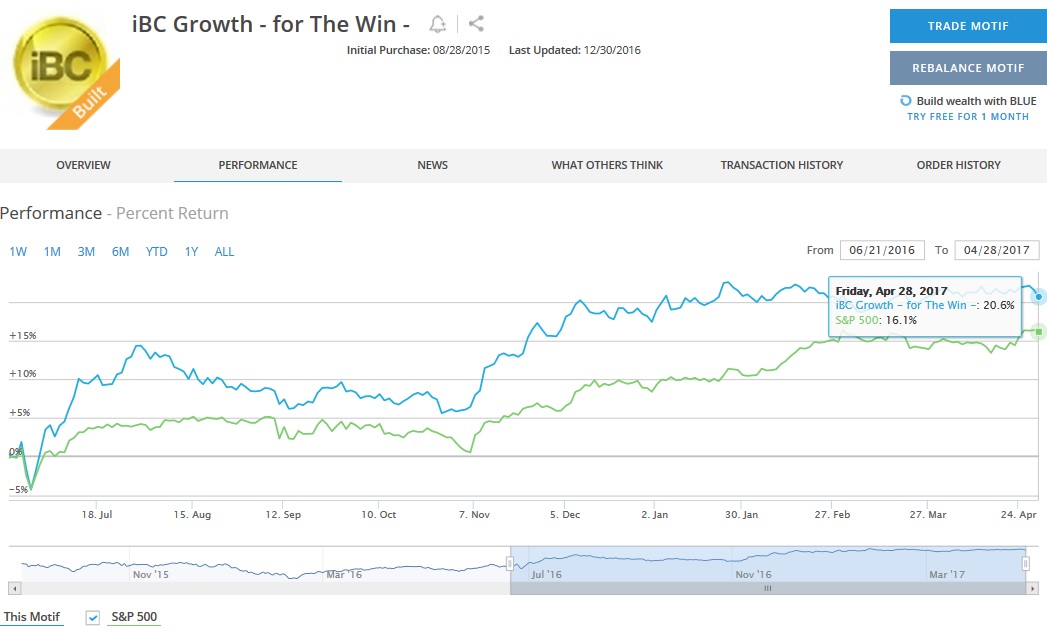
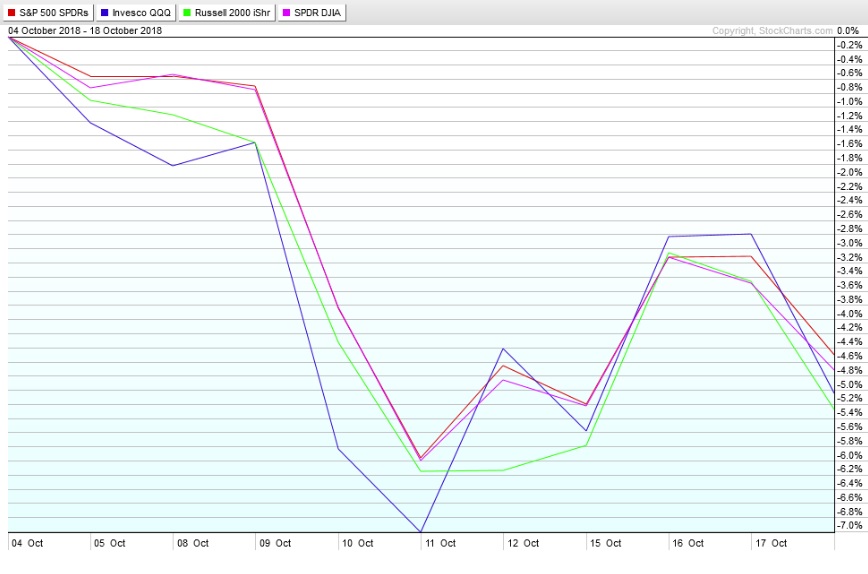
First, here is the performance of every major index during the October 4th cycle:

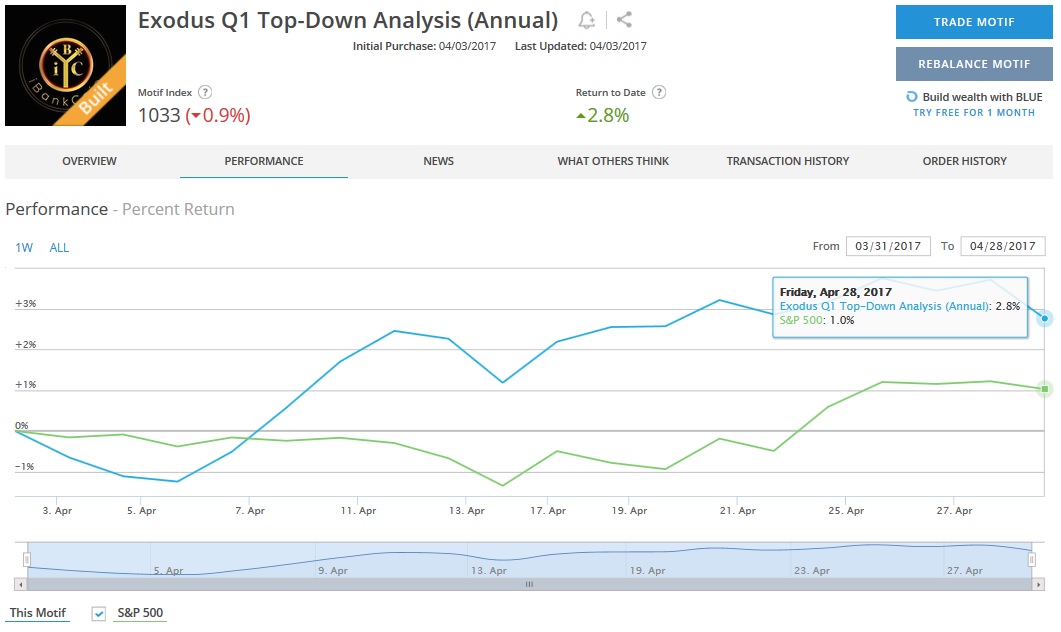
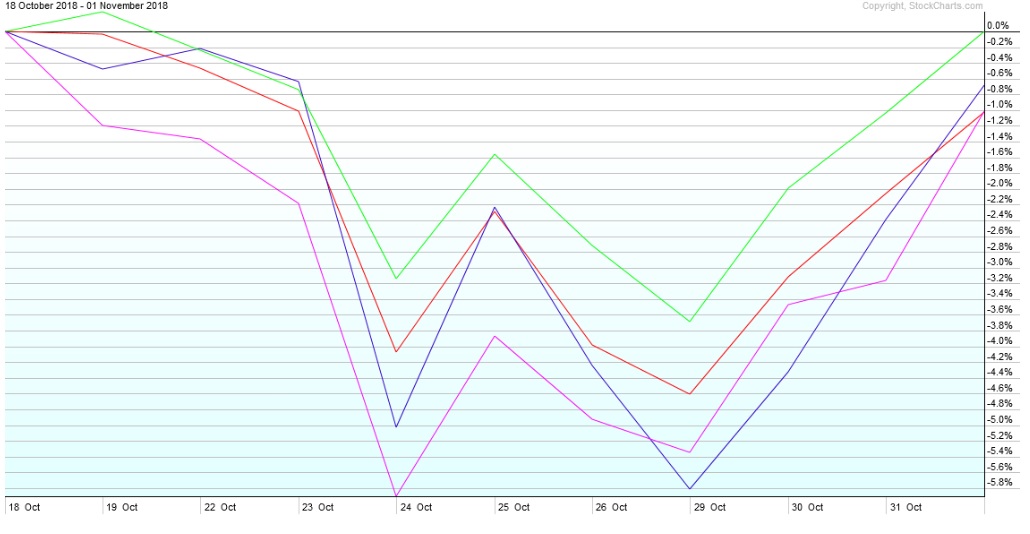
Next, here is the performance of every major index during the October 18th signal:

You may be looking at those two charts and thinking, “RAUL, you dumb sack of shit, not only do you offend my flat-earther sensibilities, you can’t even read a performance chart and see that your precious Exodus buy signals were losers.”

Which is fair.  I did take a proxy position in TQQQ during both cycles, which in both instances generated a 2x loss of the NASDAQ performance shown above.  They were losing trades.  However, the bullish bias worked to my benefit big time over the same period.  Let me explain.

***

I trade NASDAQ futures.  I operate on a different time frame than almost everyone reading this blog.  If you wanted to label my trading, I suppose you could call it medium frequency. My average holding period is about six minutes.  Average.  Sometimes I hold positions for several hours.  Especially if I have a directional bias.

Enter the Exodus buy signal.  When trading within the confines of an Exodus hybrid oversold cycle I only take long positions, meaning I buy NASDAQ futures with the expectation that I can sell them later in the day at a higher price.

I have specific rules defining my entries.  These are setups that I have studied and cultivated over years.  They are my craft.  I can execute them quickly and cleanly, like an experienced chef chopping an onion.  But developing entries is not the purpose of this blog post.  This blog post is about EXITS.

So little attention is paid to exiting positions.

When should you exit a position, and why?  The answer is in the numbers.  The most ratio to track when trading is you expectancy.  Here is the expectancy formula, but we won’t deep dive into the math because I don’t want to lose your attention:

Expectancy = (Probability of Win * Average Win) – (Probability of Loss * Average Loss)

For a trading approach to be profitable, the expectancy needs to be greater than zero.  To cover the overhead of trading as a business, I like to keep expectancy over 0.30.  And overall, when tracking my expectancy, I want to see the arc of my expectancy trending higher.

If you focus on the simple algebra, you can hopefully see (godspeed, Simple Jack) that you have four ways of making your expectancy ratio go up.  Here are the ways of increasing your expectancy, in easy-to-digest list form:

  1. Increase Probability of Win 
  2. Increase Average Win
  3. Decrease Probability of Loss
  4. Decrease Average Loss

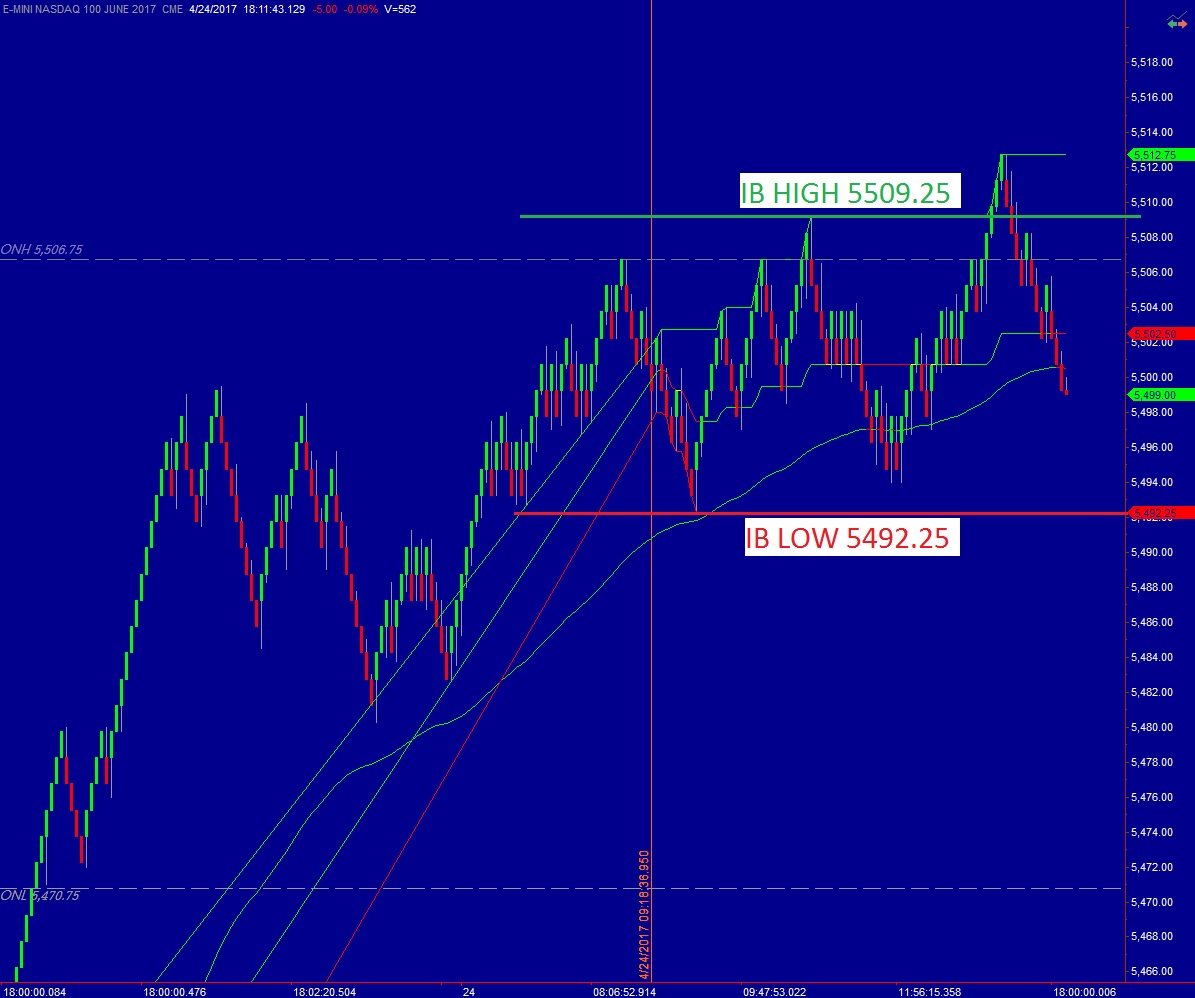
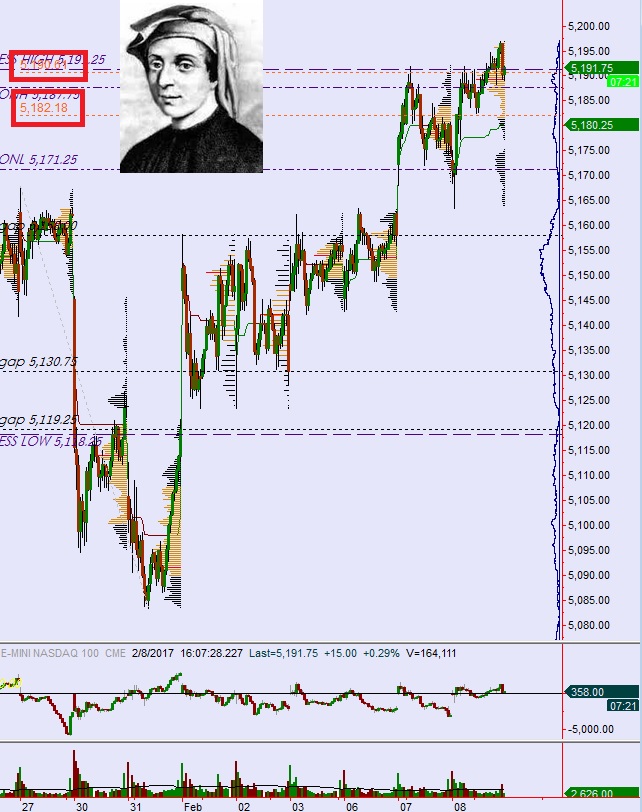
Returning to exits.  I need logical reasons to exit a trade—statistics.  The first hour of trade after the cash open is called the Initial Balance (IB).  Did you know that 94.75% of the time, price breaks beyond the IB range?  How do I know?  Statistics, damn statistics, and my only true lover—Microsoft Excel, look:

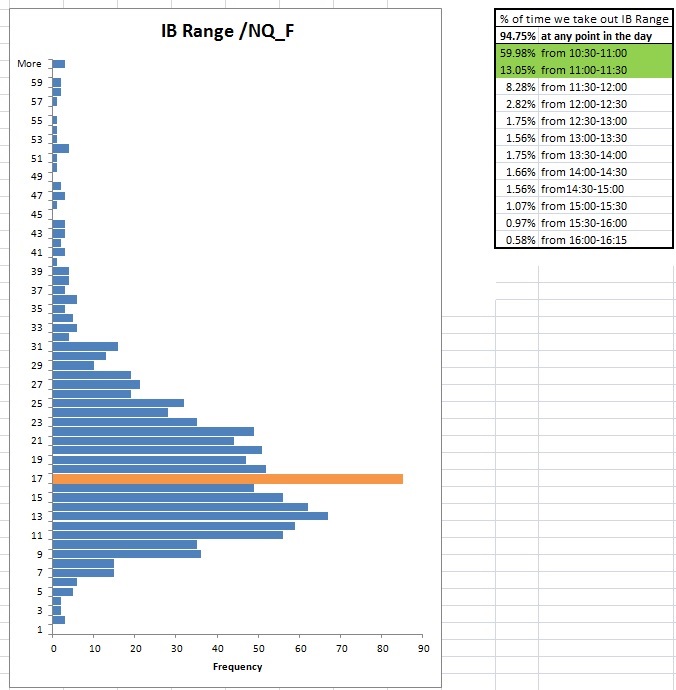
So we know either the high or low of the first hour’s range will break about 95% of the time.  But we don’t know whether it will break the IB high or the IB low.

ENTER Exodus, BWAHAHAhAHAHAHAHAH

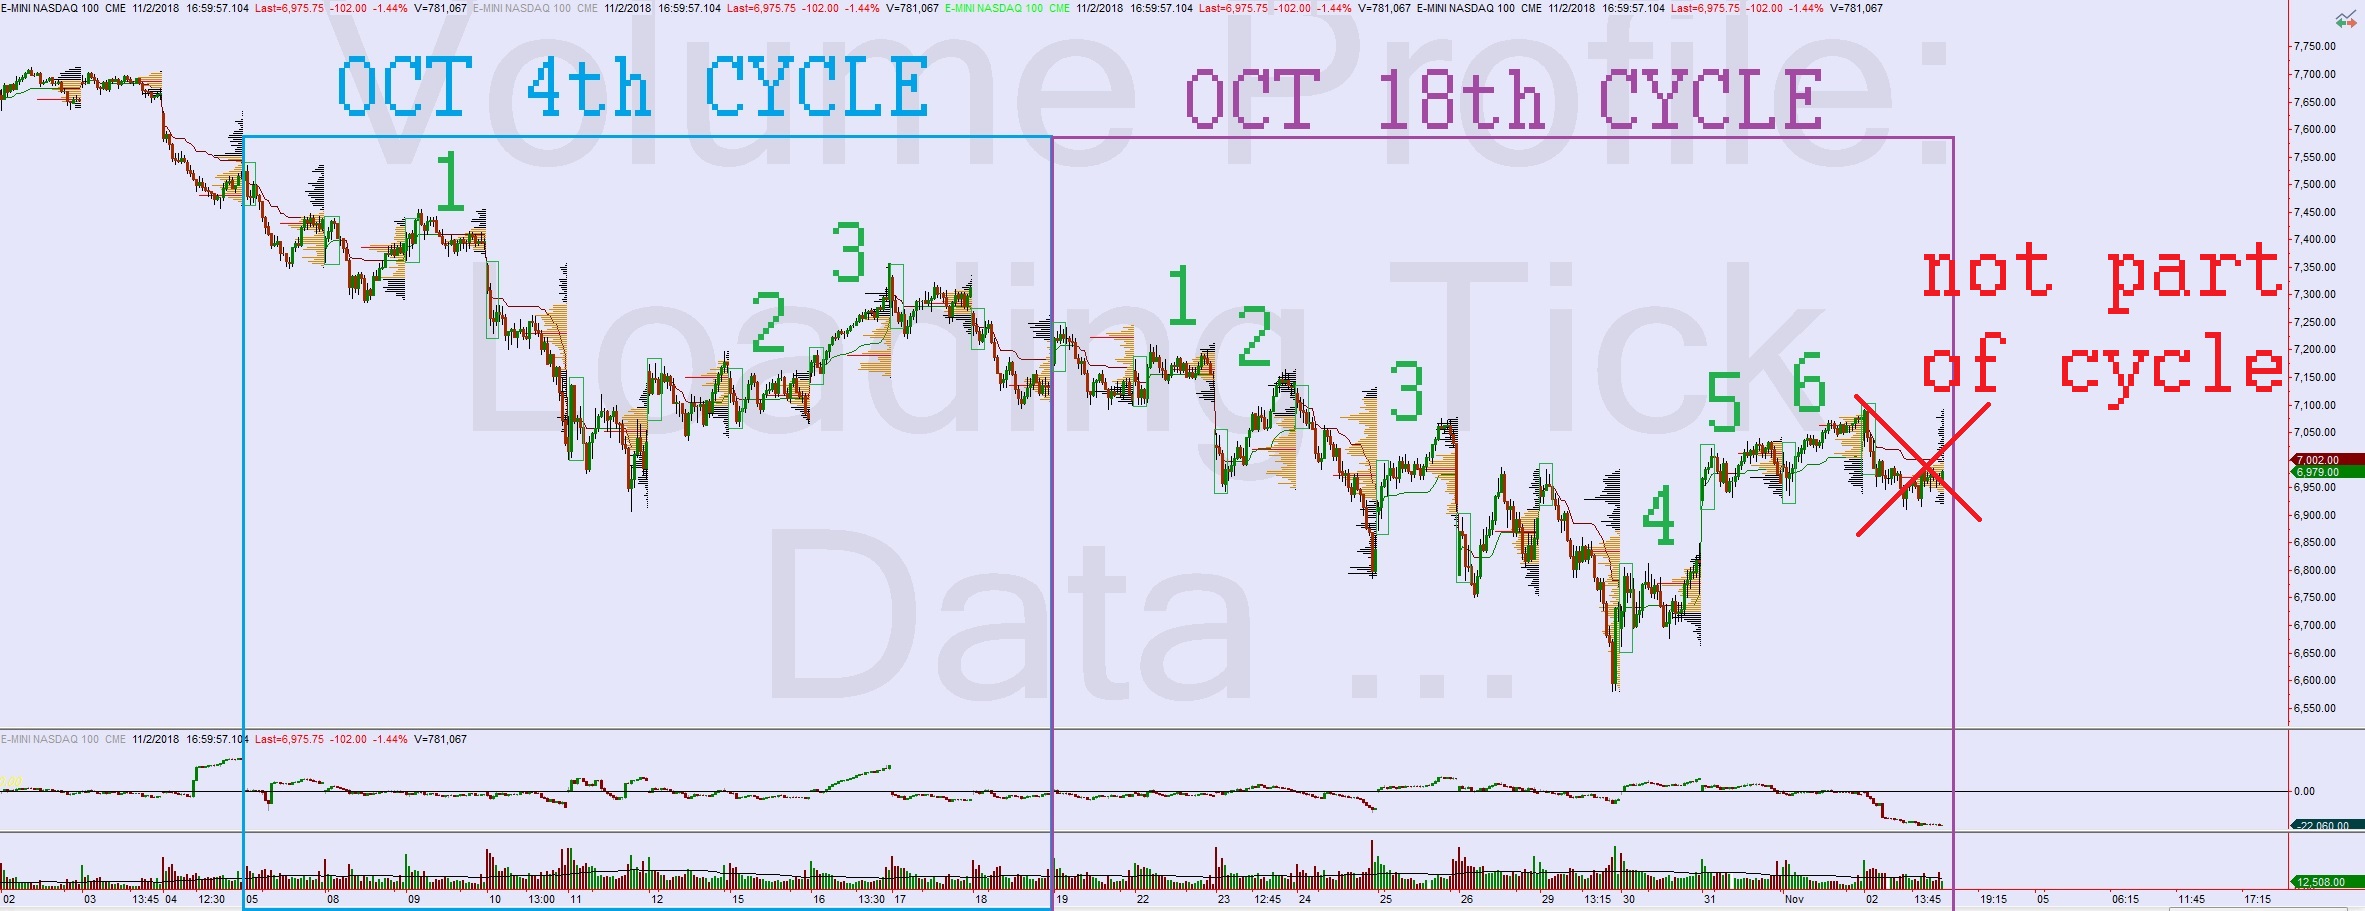
I need to update the study so I can show definitively that Exodus has sharpened my IB trading approach.  But let’s go back to the October 4th trading cycle (10/5 – 10/18) and the October 18th cycle (10/19- 11/01).

How many times did we break IB high before IB low during the October 4th trading cycle?

3 out of 10.  It was a rough cycle.  I was bloodied up pretty badly.

How many times did we break IB high before IB low during the October 18th trading cycle?

6 out of 10.  Back in action.

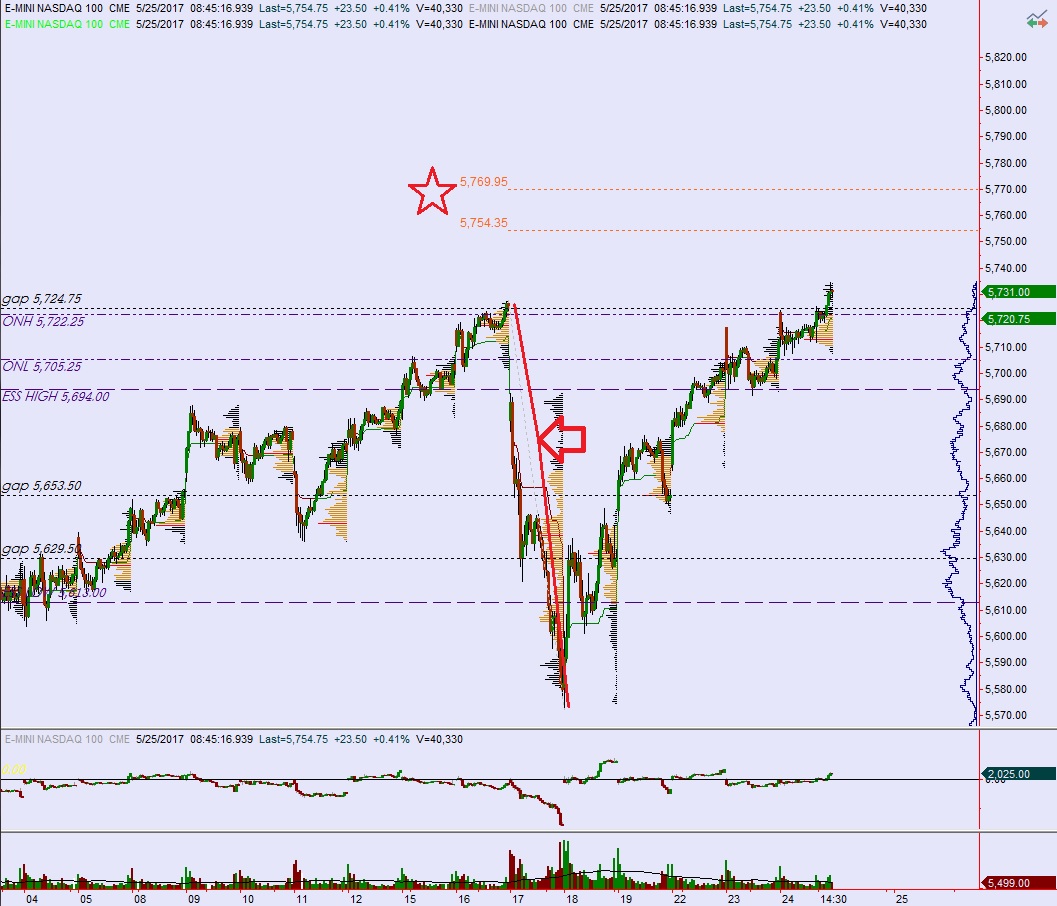
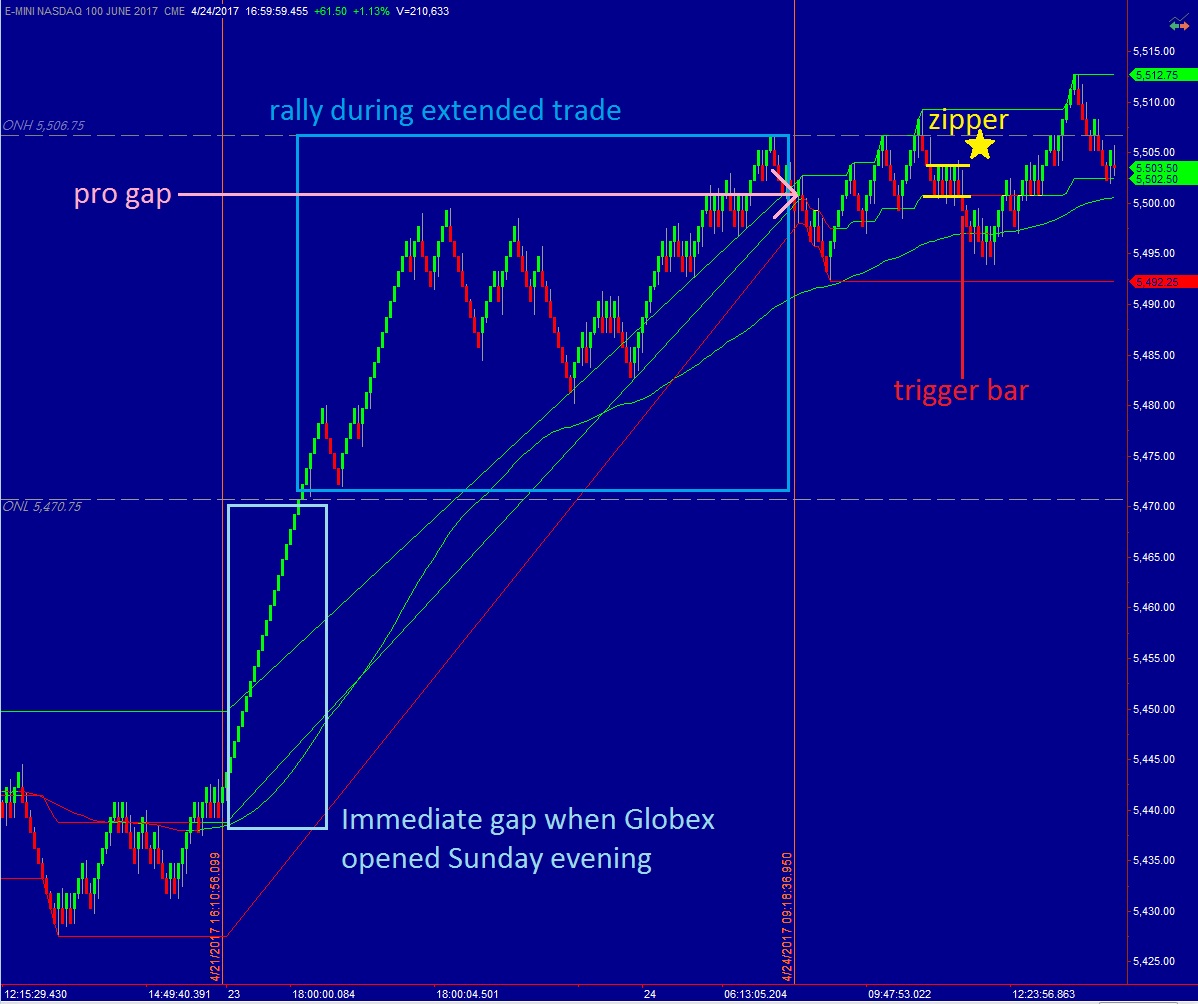
Here they are, in chart form:

When you have the parameters of the initial balance to work with, the closer you are to IB low during an Exodus oversold cycle, the less risk you have to give your trade, and the more REWARD the trades have.  The initial balances during October have been BIG.  There has ben lots of range to work with.

There is a similar set of statistics that power my overnight high/low approach.

***

Hopefully this short blog post gives you a bit more insight into how I use Exodus/Excel/expectancy to empower my futures trading approach.  Ever since I started using IndexModel and Exodus hybrid overbought/oversold signals to force me to only trade one side of the tape, I have seen a dramatic improvement in my expectancy.

It’s funny, I fought like hell to escape the corporate world and all its structure, yet it is structure and discipline that affords me the freedom I desire.

And that is why I produce a Strategy Session inside Exodus even though I do not receive pay for the newsletter.  I appreciate the structure The Fly created for me, the accountability to my research that came from other people depending on it.  Because it caused me to sharpen my trading edge.  For that I am infinitely grateful and will happily give back to our community of iBankCoiners.  I don’t care if you hate my geopolitical/environmental views, I know we are all here with the explicit intent of extracting fiat dollars from the global financial complex.  These are my ravenous people.

Working through these cycles, one after another, is how I make my way through the world, no one’s master, no one’s slave.  Right now I have no cycle to work with.  That means I will only be scalping the price levels revealed during the morning trading reports and only when I feel like it.  Tight risk, quick 8-9 point scalps.

Neutral until otherwise noted.

Exodus members, the 207th edition of Strategy Session is live, go check it out!  Be sure to take a look at Section IV, I like the story semiconductors are telling.

Comments »

Let me show you what alpha looks like

Some of you refuse to accept that your skills are being automated away by big-brained boys and girls one third your age. You can take solace in knowing that Exodus was created by a Space Alien Magician who is in fact immortal.  Nevertheless, Exodus is eliminating the need for a, umm…how do I put this, financial services professional if only you can manage to assuage the responsibility of choosing stocks to the quant.

Presented without further commentary, the performance of my quarterly quant, built exclusively with the tools inside Exodus, performing live via Motif investing for ease of implementation and return-to-date verification.

Next adjustment occurs at end-of-June.

Total annual commissions $40.00.  Total other fees $0.00.

Bye sweeties,

RAUL

Comments »

The model is bearish again, an explanation of how I will trade it into month-end

For the second time in four weeks the IndexModel, which is prepared every Sunday as part of the Exodus Strategy Session, is signalling bearish.  Before we go into how I will trade the signal, lets discuss the purpose of the Exodus Strategy Session.

Financial markets never truly sleep.  In our quasi-free-market society money is always moving around the world, 24/7.  This is facilitated in a number of ways from credit cards, to wire transfer or ACH, and even via the exchange of physical currency (which drives governments mad).  But the USA public stock markets do ‘close’ briefly, from Friday afternoon until Sunday evening.  This short pause is somewhat arbitrary, and as we become more immersed in a world augmented by artificial intelligence, the way the stock market closes for 49 hour and 45 minutes every American weekend is becoming increasingly archaic.

But it does close.  Therefore it makes sense to use the brief pause to strategize and plan our next actions.  Hence the Sunday strategy session.  It used to be written by a person I’ve never met in real life called Chessandwine [chess and wine].  As a young man I found him to be an admirable character who demonstrated a level of stock market understanding I had not yet achieved.  In fact, that was the case with many of the contributors to iBankCoin back in the early days.  One day Chessandwine defected from iBankCoin, completely abandoning his post as the creator of the Sunday strategy session.  I had been reading the report for years.  And I imagined many others did too.  And it seemed like many people would be put out by this abandonment, which sucked.

I was just blogging in public forum back then, posting my research and trade ideas and doing my best to ‘put myself out there’ in hopes of learning how to be a competent trader.  It was working.  I found my niche trading NASDAQ futures, which I heavily supplemented with algorithmic signals.  You can click here to see how my mind approaches deep understanding.  Here’s a brief snippet for anyone too lazy to click:

Nothing builds confidence in an idea like statistics and probabilities.  Therefore as an addendum to the weekly course, I have built out the relevant IB statistics for my product, the Nasdaq E-mini future contract.  I used five years of pure IQ Feed data to compile the following stats.  Some highlights:

  • We break initial balance 94.75% of the time
    • By 11:30 – 73.03% of the time
    • By 12:00 – 81.13% of the time
  • Normal IB range (69.87% frequency) is 11 – 24 points
  • Normal IB volume (66% frequency) is 40k – 75k contracts

Anyhow, The Fly tapped me to take over the Sunday Strategy Session.  The problem was, I had no desire to do the report.  Back then it was tailored, by Chessandwine, to be a tool for people who traded individual stocks.  I rarely trade those instruments.  But I tend to find ways to say yes to people, so I took over the report.

For a few months it brought me great anxiety.  My research was going to be broadcast out to 100s of paying iBankCoin investors and traders.  It wasn’t going out to some dorks reading marketwatch or whatever, it was going to hard core, punch your fucking jaw off, iBankCoin traders.  For those of you who weren’t around in 2007, this was a violent website solely dedicated to making money.  Nothing else mattered.  Eat what you kill and if you’re a distraction then face humiliation until you were banned and shamed out of existence.

It was truly a wonderful place for a rabid dog like me.

Anyhow, I would go to bed early Friday so I could prepare the report Saturday.  It would take me 7-10 hours and I could not enjoy the weekend until it was done.  The final product was my absolute best attempt at preparing a report for stock traders.  Hopefully they found it useful.

It was useless to me.

At some point I snapped and made the report exclusively for me, and also for any younger humans similar to me who were in their 18th-to-22nd year of existence.  What did I need to know going into the trading week?

For starters, I trade equity index futures.  Not stocks.  And for the last four years only one instrument, front-month NASDAQ futures.  The 100 largest non-financial stocks trading on the NASDAQ are market cap weighted into an index.  A contract called a future is a derivative of that index that you can trade.  These futures trade on the Chicago Mercantile Exchange.  The NASDAQ is in New York City but in reality it exists only on the internet and in our minds.  There is no physical exchange.

The first thing I need to know is what the stock market has done since my last report.  Aka, the first of ‘the big three’ questions…what has the market done?  Section II covers this as objectively as possible.  We go top-down, starting with the 1-week performance of the four largest USA indices, then working down into sector performance then finally the industry level.  I used to factor oil into the equation but found its behavior irrelevant to my needs.  This section of the report helps identify what happened and also what the risk appetite was last week.  I need to know this.  It also helps to answer another big question…what is the market attempting to do?

If you are wondering where these questions come from, they come from one of the [very] few useful books on active trading called Mind Over Markets.  You can find it on Amazon and one of the writers recently started a twitter account and is practicing the methods presented in the book live.  You could go follow him right now but please come back and keep reading the RAUL blog:

After we answer those questions we ask the most important question of all…what is the market likely to do from here?  This is where the rubber meets the road.  The right edge of the chart.  Everyone’s so damn good at pointing to old charts and confidently explaining what happened and why.  Eventually, if you trade long enough, you’ll start to realize charts are okay, they present information well.  But it can be difficult to consistently act based off of them.

The only people I see consistently acting from charts are options traders who studied under The Option Addict.  They tend to buy directional bets on charts that are consolidating into tight wedges.  These guys are only right like 15-20% of the time but when they are, huge huge gains.

I find statistics to be a better forecasting tool.  That is what Section IV and V of the strategy session are all about.  We rank things like 2-3 day trend, volume, and more, and track the outcomes when abnormal readings occur.  This allows us to consistently forecast a directional bias over the next five trading days.

And that is what I need to know.

One of the signals, the bearish signal that triggered today, is called Rose Colored Sunglasses or RCS for short.  It is called that because it is describing the current situation as best as I can with words.  The indices paint a rosy picture, lulling everyone into complacency.  Meanwhile, below the surface, Exodus sees things differently.  It’s micro interpretation of over 4000 stocks and a handful of other macro components are telling a different story of bearish undertones.

If you have never worn rose colored sunglasses, just know that everythings better with rose colored sunglasses.

A directional bias means I will favor one side ‘of the tape’ while I trade the NASDAQ 100.  Going into next week the model is bearish, therefore I will be aggressively shorting the NASDAQ 100 intraday.  I will also put on a position trade early in the week using the SQQQ ETF and hold it until we tag ATR bracket low or the week ends.  This serves as a placeholder for my bias and reminds me that I have a bias.

Want to know what trade setup will have me most aggressive and most excited?  An overnight gap up, inside the prior day’s range. I will be shorting that open very aggressively until I am proven wrong or we fill the overnight gap.  This is my bread and butter trade, the overnight gap in range, further stacked in my favor by the Strategy Session.

So that’s it.  That’s how the Exodus Strategy Session came to be what it is today.  And that is how I will trade the signal.

Sometimes after I prepare the report inside Exodus, I come out here, in public forum and discuss my directional bias in a colorful way.  It’s really just an attempt to engage the reader.  I think most people prefer to be entertained more than they prefer learning how I do business.  But for those who do care to learn, there is the Exodus Strategy Session and the morning trading reports.

Only like 40 people read both.

Which is fine.  The way my brain is required to think in order to produce the Strategy Session, and the resulting bias creation has taken me out of trading plateau I had been on for a long time.  The elevation in my performance is significant.  Having a bias made me a way better trader.  So to me, it doesn’t matter if anyone finds it valuable.  I find it valuable, and I eat what I kill.

The Strategy Session makes me a better trader.  So do the levels presented on the morning report.  And so does all the hard work that goes down behind the scenes.

I prefer being in my quiet little corner of the internet, misunderstood by most and left alone to make money.  It took me many years to realize attention has the dangerous ability to cut right to my ego, which time-and-again is my arch enemy in trading.  And in business.  And in life.

The models are bearish into the last full week of May.  Therefore I will be selling IN MAY.

So it is written, so it shall be.

RAUL SANTOS, May 20th, 2018

Exodus members, the 183rd edition of Strategy Session is live, go check it out!


Comments »

ANNOUNCED: RAUL to host Detroit Meetup. Topic? Active Trading

When: January 23rd, 2018 from 5:45 – 7pm

Where: Brew Detroit, 1401 Abbott St, Detroit, MI 48216

Cost: FREE

Link to RSVP: https://www.meetup.com/Detroit-Investors-Traders-StockTwits-Meetups/events/246867556/

Why: Our first meet-up of 2018 will take place at Brew Detroit. We will meet on Tuesday, January 23rd and hold an open forum, loosely centered around active trading. We will discuss the basic tools needed to actively trade, what to trade, and the habits that you can start building now to prepare for active trading.

I spoke with the co-organizer of our Detroit Investors and Traders group last week and it looks like he will be in attendance as well. Should be good fun.

If you have any stocks or cryptos or commodities you want us to analyze on the spot, I will have a laptop and we can run through them. Brew Detroit has promised us free WIFI, so feel free to bring your own devices if you would like.

There is no set format for this meet-up. It is just an environment for us to discuss what is and is not working in our trading. All skill levels are welcome.

If you want to take control of your investment decisions, this is a great place to start. Come out next Tuesday, January 23rd from 5:45 – 7pm and meet professional investors and traders.

Brew Detroit produces small-batch craft beers available only through its tasting room. There are about 15 beers on tap. There are also non-alcoholic beverages available including coffee, water, and soda. Once I have a decent headcount, we will pick up a few Supino Pizzas.

Hope you can make it out,

RAUL

Comments »

Update: Quant Portfolios Are Working

Impressive rally so far on this Tuesday before Thanksgiving.  Breadth supports it.  According to Exodus over 68% of the equity complex is higher.  Net issues on the NASDAQ 100 concur.  Net Issues are reading 67.

I do not want to assume all readers know that there are 100 stocks in the NASDAQ 100, especially since we have commentors with special needs like sacrilige.

But yes, there are 100, and if net issues are at 67 that means about 67% of the underlying components that make up the index are higher.

Moving on.

Since the end of Q1 I have been using our analytics platform to quantitatively build baskets of stocks.  There is a new one built every quarter.  You can read a long-form recap of the process here.

They are performing well, and by removing myself from the stock picking equation, I am liberated to focus on more important matters.  Stock picking is not a task suitable for 90% of humans.  The 10% can separate their ego from the process of stock picking and form a clear-headed method of choosing companies to own.

It takes a ton of work.  And maybe these investors are like some kind of apex predators who spend most of their life in solitude, stalking and hunting and eating.  But I prefer to take a beta position and submit to the robots.  They have no ego therefore they are better suited for the task.

So far it is paying off.  The Q1-through-Q3 accounts are up 16%, 9%, and 1.8% respectively.  See below:


Below is a picture of my assistant showing these charts to sacrilige:

It is important to note that none of these accounts have been put to the real test of a market correction because there simply has not been one since the accounts went live.  What needs to happen, ideally, before the next correction, is for the accounts to build up an out performance buffer verse the S&P 500.

For when the time comes for markets to correct, it will inevitably affect these portfolios.  To what degree, I am uncertain.

Overall, being freed from the need to babysit the 30-40 public companies that comprise my equity exposure has been extremely valuable.  Sure this task could be outsourced to a licensed wealth manager, and maybe it is my Midwestern mentality, but I like to handle my own business.

Like if a pipe breaks, I have to give my Italian genetics a chance to fix the problem before I call a plumber.  If my ancestors could build the aqueducts using brawn and muscle and stone, then I can probably cut and glue some PVC.

I am grateful Hardeep Walia and his team of engineers over at Motif created a platform that allows me to execute these quant strategies without blowing all my money on commissions.  There is no incentive for me to plug them, they just made a brokerage that works.

The final leg of this strategy will be built on the first trading day of next year, which I believe is January 2nd which is a Tuesday.  If I am not already chasing snow out in the Rockies, I will pop on YouTube and build the basket live.

Until then,

Raul Santos, November 21st, 2017

Comments »

Exodus Q1 Top-Down Quant Investment Model Slaughters The Standard and Poor for Second Consecutive Month

Here’s your monthly nudge to create your own quant investment model.  Below you will see the 2-month performance of a basket of stocks chosen by Exodus algorithms:

Keep in mind, the 2-month performance is irreverent because no adjustments will be made until the end of Q1, 2018.  So the positions will remain intact for the next 10 months.

 This basket of 15 stocks only one piece of the model I am building, and live investing in, right before your very eyes.

This is a very lazy approach.  There’s little need to babysit these books.  An hour is spent at the end of each quarter, parsing data, running the Exodus system, then making a few clicks in Motif.

Here’s how it all works.  At end of Q1, a 3-month top-down sector analysis is performed.  At the end of Q2, a 6-month.  Q3, a 9-month.  And you guessed it, at the end of Q4 a 12 month look back.

Each book is a 12-month hold.  Each book can hold a position held in another of the books, meaning certain stocks can have out sized positions.  This means greater micro risk—but also potential reward.

If the systems keep flagging a stock, like they are IMAX (which is getting slaughtered), then it will be bought quarterly and without second thought.

It is nice to not think about investing.  Humans tend to get in the way.  Robots are much better investors, advisors, and friends.

Loyal

This quarterly process jives well with my inner accountant.  Every quarter I make a contribution to my investments, and while doing so I re-balance one of my books.  This saves on overall expenses and lets me do some simple financial planning.

The plan is to execute for 120 months.  For most of this duration, most of you will overlook me.  Pass me over as irrelevant because it doesn’t engage you emotionally.  Then, when you see the ridiculous gains achieved, you’ll have no choice but to be inspired to be a better you—a cyborg—part human, part robot, lording over the general population.

I shall make boring videos along the way, perhaps with a higher resolution camera on my face, so you can all bask in its beauty.  I do these things, live, so hopefully you can liberate yourself from the expensive fees levied by advisors, brokers, and ETFs.

With any luck, some of you will manage to not blow up by the time you come to the good side.  Then you can enjoy the hedonistic lifestyle you deserve.

For now, let it be known that the quant model has more than doubled the gains of the pathetic S&P 500 over the last two months.


Comments »

How To Use Fibonacci Extensions; NASDAQ Edition

Fibonacci extensions are one of the most useful measured levels in trading.  Real quick, here is how Investorpedia defines them, which is decent:

These extensions involve all levels drawn past the basic 100% level; they are frequently used by traders to determine areas that will bring in profits. One popular extension, the 161.8% level, is used to set a price target on a breakout of an ascending triangle; this target is calculated by multiplying the vertical distance of the triangle by key Fibonacci ratio 61.8%, and then adding the result to the triangle’s upper resistance level.

Forget all that ascending triangle talk, that’s technical analysis guff.  A Fib extension shapes the narrative of a breakout.  Right now, in the NASDAQ, we have no market profile levels, the most logical trading levels in the world, to work with.  All we have are measured moves.

The Fib extensions in play right now are measured using the selling that occurred last week.  Below on the NASDAQ, you can see the measurement from peak-to-trough, and the subsiquent Fib-extension above current prices.  See below:

We moved up into these levels overnight.  Algorithms love to probe Fib extensions, looking to run stops.  Like if anyone initiated shorts into the down move, or somewhere during the retracement of it, then robots press into the move to see if these sellers really mean business, or if they’re going to stop out.

So our primary expectation on the first touch of the fib levels is for them to behave as resistance (in this case, since we reversed and extended a down move, the opposite ‘behave as support’ if we flipped the idea over). If instead we trade through the levels, and sustain price above them, it tells us this is much more than a stop run.

It could be the start of something much bigger.

And now you know everything you need to about Fibonacci extensions.

Comments »

Here’s A Quick Look at The Laziest Investment Approach Ever

At the end of the first quarter, a top-down sector analysis was performed, and the best performing sectors were screened using Exodus to narrow the list of potential investment candidates down to something manageable.  There’s a video describing the entire process.  It is a half hour long and very boring, I suggest you skip it.

Anyhow, not that it really matters (this portfolio is a 1-year hold, so 1-month performance is irrelevant) but here is the first month’s performance:

There is something to be said about starting on the right foot, not having to play from behind MAYBE, whatever.  It hit the ground running.  The portfolio turned out 1.8% MOAR returns than the S&P 500.  In the industry, they call that alpha.

This is not a sales pitch for our Exodus software, or even a campaign to promote my stock basket.  None of that matters.  I am sharing this investment approach because of the objectivity it is founded upon. Cold and dead logic—solid foundations for building.  Sure, Exodus offers a powerful tool kit for making objective decisions, but there are other ways.  You could collect a large data set onto Excel, for example, and run some statistics to isolate quality investments.

When the money goes into these accounts, it is with confidence in the process, liberating you from the distracting/bipolar nature of individual stocks.  Sure, you could buy an index ETF and balance it with a bond ETF and a gold ETF and a REIT ETF and bunch of other fee-sucking ETFs.

Or hire a fee-based firm, Mr. Big Bucks.

Or, or…embrace some of the latest disruptive tools like Motif (no affiliation) to take control of your investing.  We are entering a period of economic prosperity gentlemen.  Are you positioning yourself today for how you want your life to be in the roaring ’20s?

My top-down index compliments the GARP portfolio, Fly’s semiannually adjusted portfolio, quite nicely. GARP is also out performing the S&P.  Here is the performance since its June adjustment:

Note: GARP portfolio is members only

Outsourcing my stock picking to The Fly and his time machine allows me to live the fat man’s lifestyle—sashaying around the house in a robe eating hoagies—the best of times.

So far the latest top-down basket is doing well.  Will it outperform the S&P 500 for the duration of its holding period?

As always, TBD

Comments »

Let’s Take A Look At How Futures Traded Monday, After The Pro Gap Up

Pro gap is loosely defined, per my own statistics, as a gap greater than 40-60 points on the NASDAQ, roughly.  Greater than 60 points and we truly are dealing with something unique. Let’s discuss the forces behind a pro gap and the implications they carry into the trading day.

A gap usually occurs when information deemed material by investors and traders is discovered outside of open market hours (9:30am-4:15pm, New York Time).  When the market resumes trading, many participants (including institutional, the higher or ‘other’ time frame) are put in a position that may require them to adjust their exposure.

In Monday’s instance, the large move higher may have pressured short sellers to cover their positions, creating a natural demand force inside the market.  The move was deemed macro driven, tied to the first round of French Elections.

And buyers were the first ones to attempt a move after the opening swing, but by late morning, NQM17 (the front month futures contract) had fallen back around the opening prices.  This is when the day became interesting. The first trade of the week set up, a zipper, affectionately named by the image it resembles on my renko trigger chart. See below:

The trade was scratched at cost.  I managed to cover one unit at the exponential moving average then due to the day’s context scratch the remaining units instead of re-adding to the shorts and pressing for the range extension down.

Range extension is a move beyond the first hour’s range.  Understanding range extension is only important because it unlocks a high probability edge for day trading.  You can run a study yourself (and you should for added conviction) where you calculate what percentage of the time the first hour’s range is exceeded.  It happens 94.3% of the time.

94.3% probability, does that sound like an edge to you?

The trick of it is guessing which side of the range is going to break.  On a big gap day like today’s, the range extension could carry big order flow with it, and implications that could last days, even weeks into the future.  Historically, the high of the 1st hour’s range (aka initial balance) is taken out 66% of the time, while the low is breached 52% of the time.  The high breaks more often mainly due to the long term trajectory of the NASDAQ, which is up.

Below you will see Monday’s initial balance, which is clearly marked—observe:

When sellers failed to take out IB low it became evident that the primary expectation from this morning’s trading report was still in play.  For added context, we had a clear pivot zone, the old zipper that triggered the late-morning short trade.

The final layer of context is a statistic that needs to be dug up (it is archived in the laboratory somewhere, SMH) which states that if a gap outside of the prior day’s range is not filled by 1pm, the market is likely to continue in the direction of the gap.

Mix all these little contextual quirks, expectations, trade set-ups, and high probability events and you have an excellent foundation for justifying taking longs—afternoon day trades.

Overall, the day had a wait-and-see feel to it, with buyers hardly initiating fresh risk beyond opening balance.  This suggests the institutions are waiting for more information before they become aggressive in either direction.

In short, it seems, for now, the market remains out of balance which means it is interesting.  Interesting, because of the potential opportunity it holds.


Comments »

A Closer Look at The Inner Workings of The Market, Up Here at All-Time Highs

Not many spend time to understand the complications of the stock market—all the small mechanics behind price and time.

Today they tell a story of health and virility.

But that small slip lower we experienced last week followed by an overexertion from the bull, el toro, created context, or a story, that merited exploring a short bias.

Leaning short was effective several times this week, intra-day.  Yet we pressed higher.  When we came into my favorite Fibonacci extension, which is a fun place for algos to run stops, the level became a last stand for short sellers.

Sellers either defend the level or lose the first full week in the second full month under our new Authoritarian Regime.

It made sense to also go swing short, so I put some QID on the books.

Qid-beginning2017

The market confirmed it was a decent entry.  We sold off on Tuesday from those levels.

But alas, here we are, lingering above my Fibs.  And the longer we do, the more likely this leg of the rally is the real deal and not just a petty stop run.

fibs

So my bias intra-day keeps pivoting.  This afternoon it was long.

The complications, the context, the story—whatever you want to call it, can form an objective set of observations for making market decisions.  Presented with the right facts, any one of you could make the right decision.

Just for fun I ran through all my afternoon observations over on the old snapchat.  Check it out if you want, username vCali.

Disclaimer: lots of random stuff on my snap story too

I’m keeping the QID to stay swing short the NAS for now, but it’s on its heels.


Comments »