If you do not have time to read the entire context report, skip to the last paragraph/chart for the Two NASDAQ price zones you need to navigate the FOMC reaction-to-the-reaction-to-the-reaction.
Buyers showed up overnight and as the USA warms up we have a slightly green NASDAQ market. One of the features of this multi-week selling has been mornings which start strong only to be faded and eventually wind up with price closing near the low of the session. However, just when you think you have the markets number it will throw you a slider.
Let’s have a closer look at the long term auction and why I suspect a bounce is near. Also, let’s look at what will begin to worry me and cause me to really tighten my book up. See below:
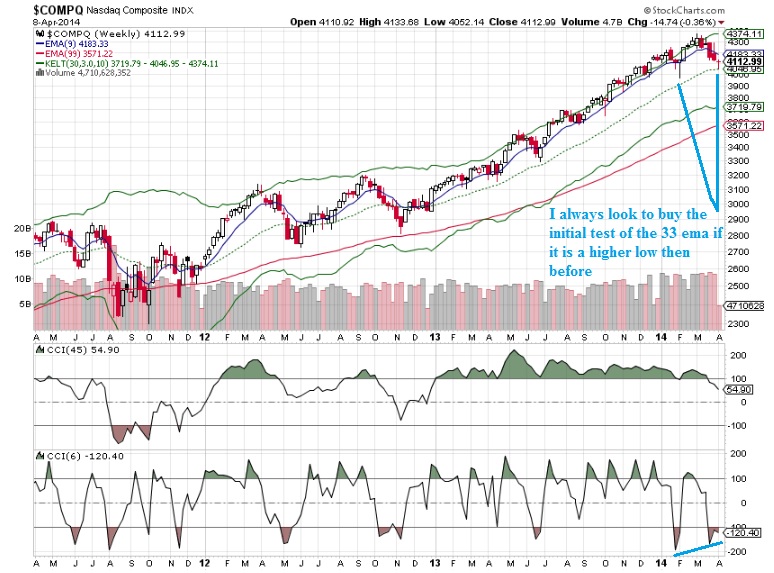
Weekly Chart (long term auction):
DAILY CHART (long term auction):
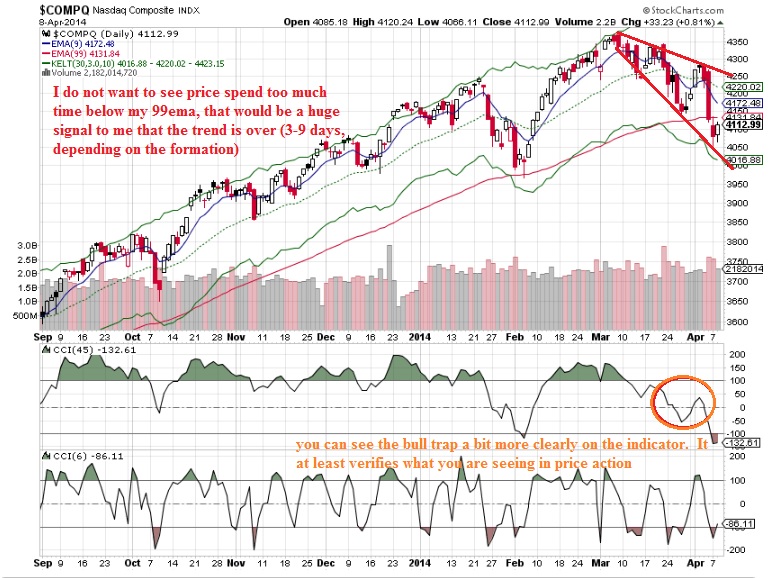
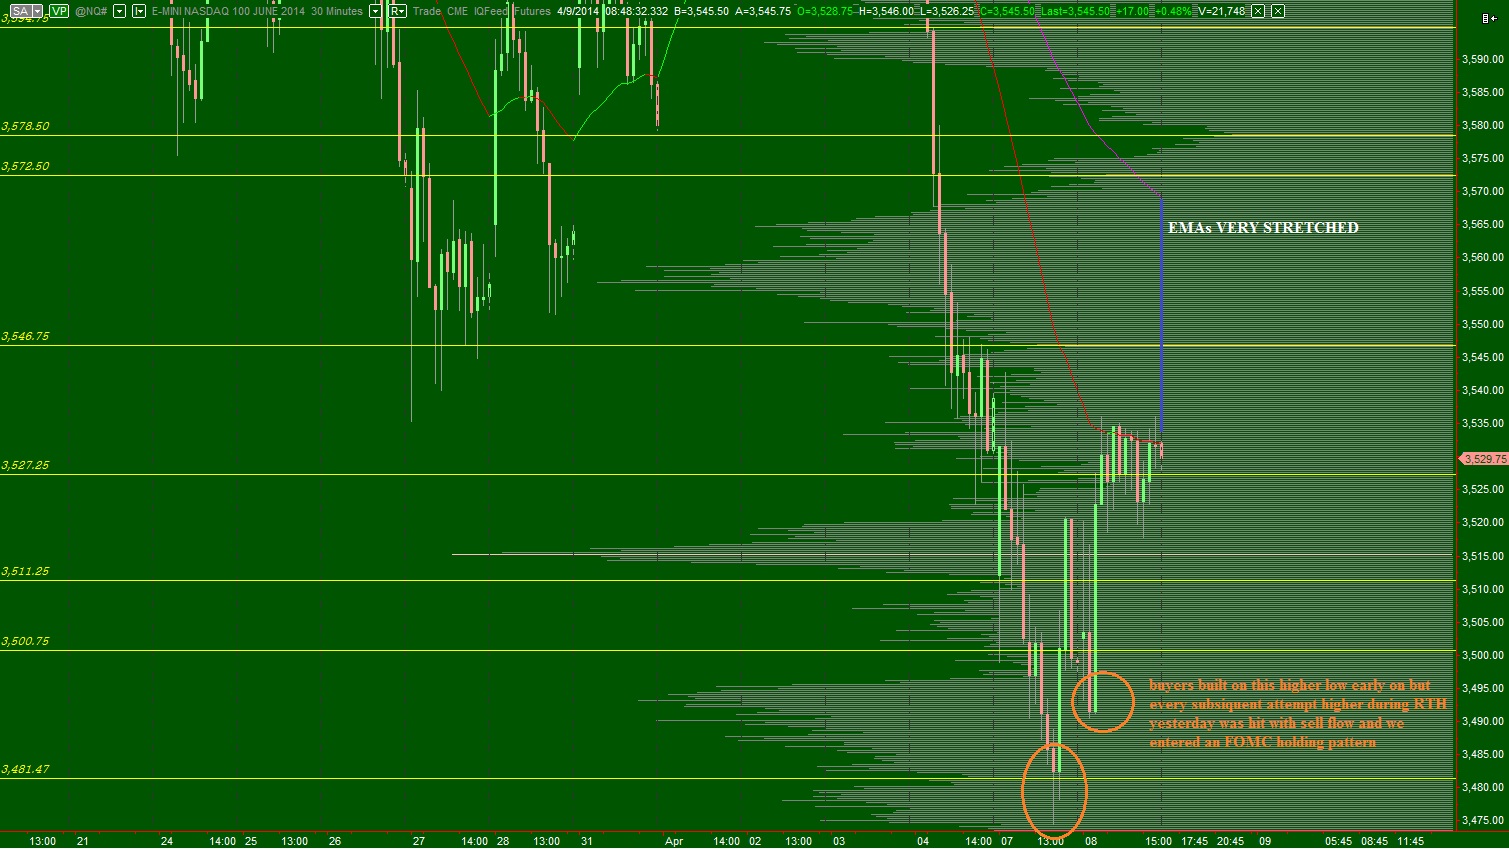
Intermediate term we are still seller controlled but stretched. This increases the likelihood of a big move in either direction, either a continuing to stretch the boundaries of the market to the downside or a snapback move. With FOMC minutes out this afternoon, the likelihood is even greater. You can see price has reverted back to my 33ema and paused. The market is very likely waiting for FOMC minutes before deciding the next move. More importantly to us is how the market reacts to the price reaction we see this afternoon. This is not to say the first move is wrong or fake, but instead that long term participants are likely to be moved by the action and if they are we need to observe their order flow. I have highlighted some key intermediate term levels on the following volume profile composite:
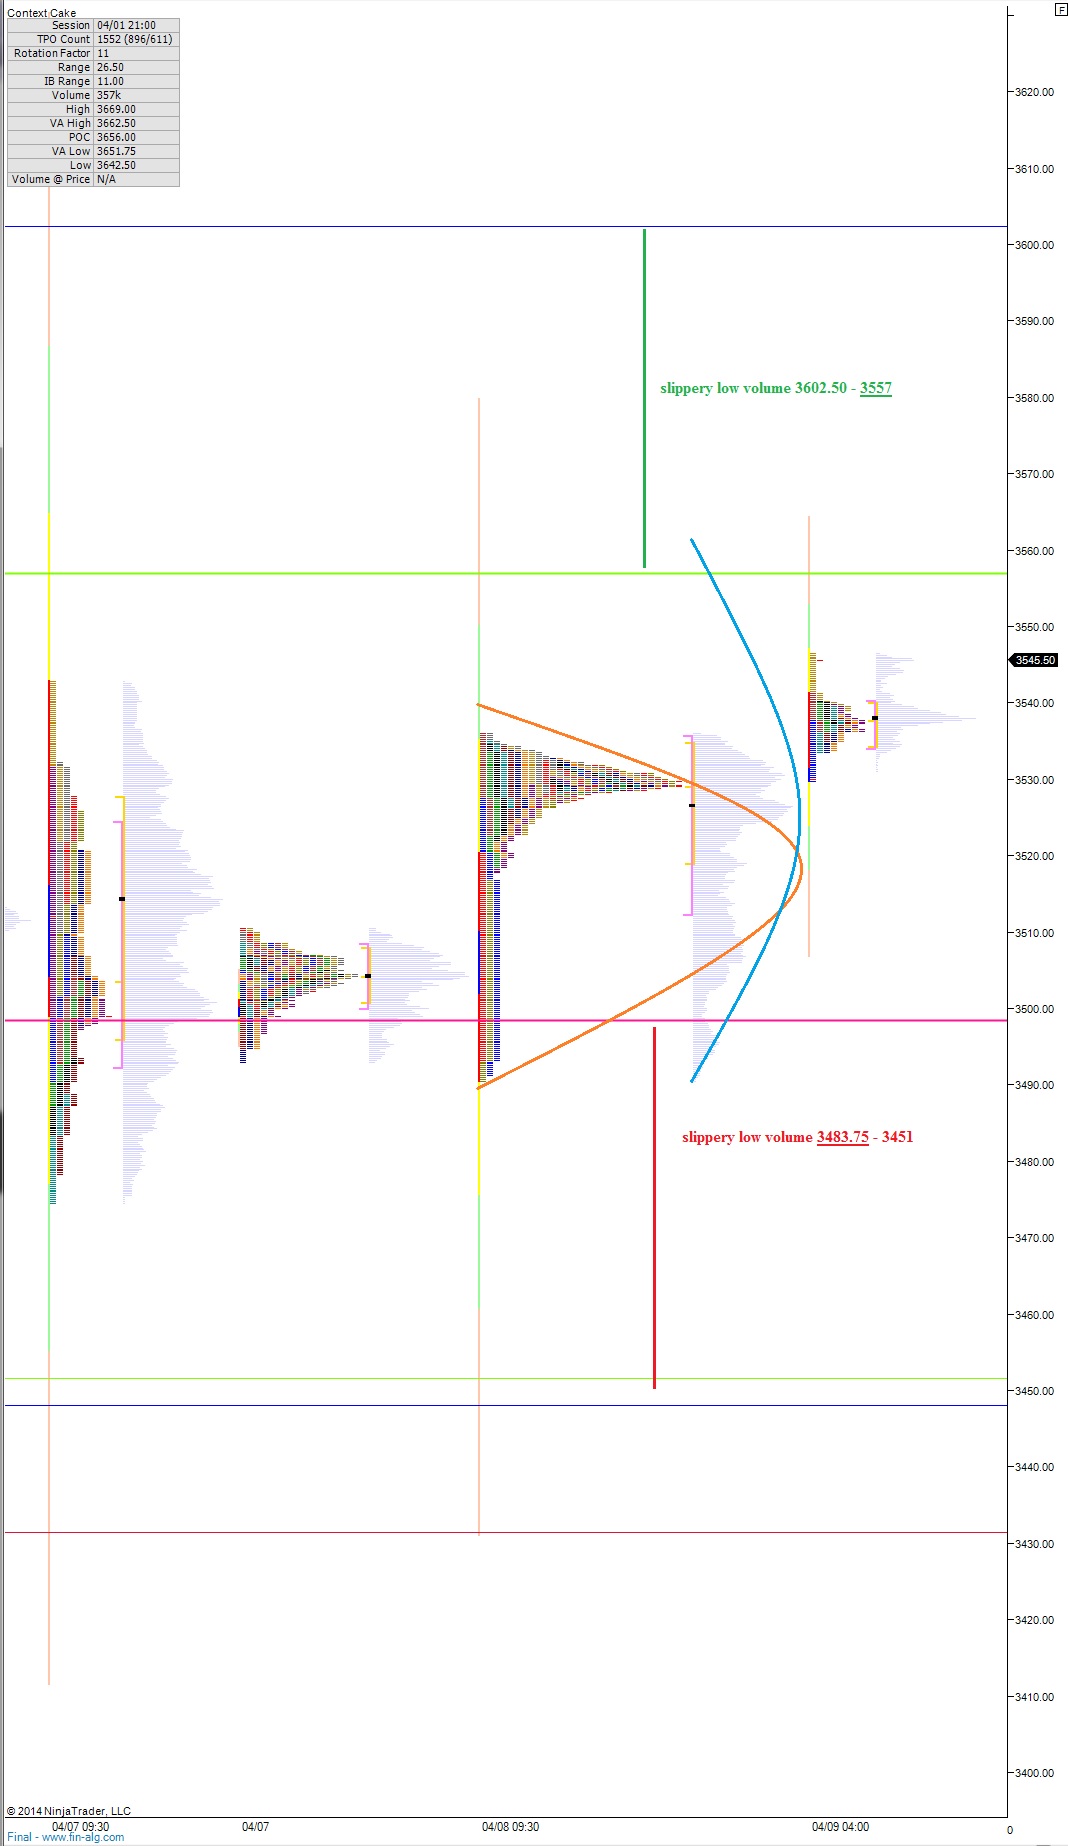
Finally the most delicious and powerful timeframe of all, THE SHORT TERM auction. These profiles are set up more exciting then I have seen in a great while. We have very low volume slippery zones on both sides of price right here, right now. The short term is in balance with buyers trying to take the early initiative to break the balance. On my market profile chart you will see a thick pink and a lovely chartreuse green line. These two levels are the edges of where very low volume starts. A breech of either (or both) is very likely to see an acceleration of price in that direction. Which side of this environment we end up on will ultimately dictate the control on both the short and intermediate term. In the meantime, it produces a massive trading opportunity to “go with” a move that penetrates either zone, intraday. See below: