[youtube://http://www.youtube.com/watch?v=3lnETHlzu48&feature=relmfu 450 300]
Comments »No Difference at All
Many have complained over the use of fluoride in public water use. It is suppose to prevent tooth decay. Well a new report shows it does not matter.
From Wiki: The goal of water fluoridation is to prevent a chronic disease whose burdens particularly fall on children and on the poor.
Comments »A Little Independent Energy Experiment on the Prairie
If you can fight your way through the dirt storms of Madelia, Minnesota, you may be able to find the future of renewable energy
By Maggie Koerth-Baker
Smithsonian.com, April 06, 2012

Madelia, Minnesota is a small town with a big plan to produce fuel made from local materials for local markets.
In the middle of the Minnesota prairie sits Madelia, a town of a little more than 2300 people that is surrounded on all sides by miles upon miles of brown soil, tilled into neat rows. If you flew there in an airplane, Madelia would look like a button, sewn into the middle of a patchwork quilt—each farm divided into fields shaped like squares and circles, bordered by pale yellow gravel roads and by the narrow strips of bright green grass that grow alongside creeks and drainage ditches.
When the residents of a town such as Madelia think about the future of energy, the solutions they come up with are unsurprisingly centered on the land and what it can grow. In Madelia, however, those solutions look a little different from what you might expect. When Madelians imagine the future of energy, they don’t see prairie dotted with big ethanol refineries, where corn grown by hundreds of farmers is processed into fuel that will be sold all around the United States. Instead, they’re thinking about something much more local. Madelia is a small town with a big plan to produce fuel made from local materials for local markets. From the native grasses that easily grow in prairie soil to leftover beaks and pieces from a nearby chicken canning factory, anything that can grow within a 25-mile radius of town is fair game.
Why would a generally conservative town, populated by a lot of generally risk-averse farm families, want to stake a decent amount of time and money on the cutting edge of alternative energy? When I traveled to Madelia, I ran headlong into the reason before I’d even reached the town itself. My moment of enlightenment happened a few miles outside the city limits, on the narrow blacktop of Highway 60, when I came very close to driving my car into a ditch.
The wind had started the day full of bluster, and it was positively furious by the afternoon, while the open, empty fields that flanked the highway offered nothing to slow the wind down. This alone wouldn’t have been a big problem. I grew up in Kansas, and I know how to steer a car through a windstorm. The issue was what I could see ahead of me—or, rather, what I couldn’t see. Out of nowhere, a gray cloud rose up to hover over the highway, swallowing semi-trucks and digesting them into sets of disembodied tail lights. I had barely enough time to realize I wasn’t looking at fog before I plunged into the thick of it.
The sun disappeared. Gravel pinged against the car windows. I couldn’t see anything that wasn’t artificially lit. In a panic, I turned on my headlamps just as I drove out the other side of the gritty haze, back into a normal, windy spring day. The “cloud” was made of dirt, and a mile or so up the road, another gray ribbon of it stretched across the horizon. I went through three or four of these dust clouds before I reached the exit for Madelia.
Read the rest here.
Comments »CORRUPTION: Is the U.S. Gov’t Falsifying Sea Level Data?
Posted on April 11, 2012 by Steven Goddard
The graph below shows changes in Envisat Northern Hemisphere sea level made this week. Previously, sea level was decreasing -0.241 mm/year, and now it is increasing by 2.37 mm/year. The most recent data magically went from lowest on record – to highest on record.
Note that the magnitude of the seasonal swings has greatly increased, and the adjustments are clearly non-linear. There is a sharp break in slope after the year 2009.
The red image was dated November 10, 2011 and the blue image is dated today. Both were taken from the same link below. The data has been overwritten in place.
MSL_Serie_EN_North_IB_RWT_NoGIA_Adjust.png (1024×680)
Individual graphs are below.
November 10, 2011 version below. No longer available on their web site. It showed the record La Nina of 2010-2011, and the transfer of seawater to soil moisture due to heavy rain.

MSL_Serie_EN_North_IB_RWT_NoGIA_Adjust.png
Below is the April, 2012 version of the same graph

MSL_Serie_EN_North_IB_RWT_NoGIA_Adjust.png
Comments »
The Beautiful Truth: Epigenetics Shows How Thoughts and Environment Play a Large Role in the Outcome of Your Health
NASA, SCIENTIFIC OR POLITICAL? Joint Letter to NASA Administrator Blasts Agency’s Policy of Ignoring Empirical Evidence
FOR IMMEDIATE RELEASE
Contact: Blanquita Cullum 703-307-9510 bqview at mac.com
Joint letter to NASA Administrator blasts agency’s policy of ignoring empirical evidence
HOUSTON, TX – April 10, 2012.
49 former NASA scientists and astronauts sent a letter to NASA Administrator Charles Bolden last week admonishing the agency for it’s role in advocating a high degree of certainty that man-made CO2 is a major cause of climate change while neglecting empirical evidence that calls the theory into question.
The group, which includes seven Apollo astronauts and two former directors of NASA’s Johnson Space Center in Houston, are dismayed over the failure of NASA, and specifically the Goddard Institute For Space Studies (GISS), to make an objective assessment of all available scientific data on climate change. They charge that NASA is relying too heavily on complex climate models that have proven scientifically inadequate in predicting climate only one or two decades in advance.
H. Leighton Steward, chairman of the non-profit Plants Need CO2, noted that many of the former NASA scientists harbored doubts about the significance of the C02-climate change theory and have concerns over NASA’s advocacy on the issue. While making presentations in late 2011 to many of the signatories of the letter, Steward realized that the NASA scientists should make their concerns known to NASA and the GISS.
“These American heroes – the astronauts that took to space and the scientists and engineers that put them there – are simply stating their concern over NASA’s extreme advocacy for an unproven theory,” said Leighton Steward. “There’s a concern that if it turns out that CO2 is not a major cause of climate change, NASA will have put the reputation of NASA, NASA’s current and former employees, and even the very reputation of science itself at risk of public ridicule and distrust.”
Select excerpts from the letter:
- “The unbridled advocacy of CO2 being the major cause of climate change is unbecoming of NASA’s history of making an objective assessment of all available scientific data prior to making decisions or public statements.”
- “We believe the claims by NASA and GISS, that man-made carbon dioxide is having a catastrophic impact on global climate change are not substantiated.”
- “We request that NASA refrain from including unproven and unsupported remarks in its future releases and websites on this subject.”
The full text of the letter:
March 28, 2012
The Honorable Charles Bolden, Jr.
NASA Administrator
NASA Headquarters
Washington, D.C. 20546-0001
Dear Charlie,
We, the undersigned, respectfully request that NASA and the Goddard Institute for Space Studies (GISS) refrain from including unproven remarks in public releases and websites. We believe the claims by NASA and GISS, that man-made carbon dioxide is having a catastrophic impact on global climate change are not substantiated, especially when considering thousands of years of empirical data. With hundreds of well-known climate scientists and tens of thousands of other scientists publicly declaring their disbelief in the catastrophic forecasts, coming particularly from the GISS leadership, it is clear that the science is NOT settled.
Read the rest here.
Comments »BERNANKE POWER! Pentagon Study Finds Beards Directly Related To Combat Effectiveness
Tampa, FL – Forget new gear, weapons, or sophisticated targeting systems. The newest tool coming to combat troops is low-tech: beards. In a report released yesterday, research think-tank Xegis Solutions noted that beards have a direct correlation to combat effectiveness.
Jonathon Burns was the lead researcher in the study.
“We took 100 soldiers. 25 were Special Forces qualified and had beards, 25 were Special Forces qualified without beards, 25 were regular Army allowed to grow beards for the study, and the last 25 were regular Army without beards. All 100 of these subjects were in direct combat in Afghanistan during the study.”
He continued, “Xegis Solutions had several teams of researchers embedded with these troops to make observations on their combat effectiveness. The results were overwhelming, out of the 50 soldiers with beards, zero were wounded or killed and they had a significantly higher accuracy of fire than the soldiers without beards. The soldiers lacking beards had a higher rate of weapons malfunctions and basically, shit went wrong most of the time.”
CENTCOM wasted no time establishing a new rule forcing males to grow beards.
Commander Gen. James E. Mattis issued a statement to all troops in combat zones.
“The time has come for the Armed Forces to accept the facts, and the facts are that beards save lives. All this time it was speculated that Green Berets were better because of their superior and intensive training while in fact, most of it had to do with beards.”
There’s no doubt that many in the Special Forces community will be angered, but General Mattis is convinced.
“It’s settled science. In light of this information we will enforce a rule requiring all males to wear at least one inch of facial hair at all times. Furthermore, any females able to grow facial hair are encouraged to do so as well.”
Comments »
Herbal Medicine Causing Cancer
Aristolochic acid (AA) is a potent human carcinogen that is found naturally in Aristolochia plants, an ingredient common in botanical Asian remedies for aiding weight loss, easing joint pain and improving stomach ailments.
Comments »
Climate Change Wonks: New U.S. Population-Adjusted Temperature Dataset (PDAT), 1973-2012
April 5th, 2012 by Roy W. Spencer, Ph. D.
This is the first of what I hope will be monthly surface temperature updates for the contiguous U.S., based upon 280 International Surface Hourly (ISH) stations which have reasonably complete temperature records since 1973.
Following up on my previous post showing that ISH station warming trends during 1973-2011 were a function of population density, I have quantified the average temperature trend increase with population density (2000 population data) over the U.S, then applied a linear trend correction to each of the stations based upon that relationship.
A few of the findings:
1) Essentially all of the +0.20 deg. C/decade average warming trend over the U.S. in the last 40 years computed from the CRUTem3 dataset (which the IPCC relies upon for its official global warming pronouncements) evaporates after population adjustment (no claim is made for countries other than the U.S.)
2) Even without any adjustments, the ISH data have a 20% lower warming trend than the CRUTem3 data, a curious result since the CRUTem3 dataset is supposedly adjusted for urban heat island effects.
3) The only calendar month with obvious long-term warming is January, due to unusually cold U.S. winters during the 1970s.
4) Last month (March, 2012) is the second warmest monthly temperature anomaly in the 40 year record, and easily the warmest March, even after population adjustment.
For the time being, I’ve decided to post the results for comment rather than attempt to get the work published, which would be a much bigger effort. My hope is that the new dataset will stimulate debate in the climate research community over the existence of residual urban heat island (UHI) effects causing a spurious warming component in commonly used temperature datasets.
Read the rest here.
Comments »Pink Slime Was the Tip of the Iceberg; Ammonia Treated Food Products Have Been Around for 40 Years
Surprise, surprise, surprise….
“(Reuters) – Surprise rippled across America last month as a new wave of consumers discovered that hamburgers often contained ammonia-treated beef, or what critics dub “pink slime”.
What they may not have known is that ammonia – often associated with cleaning products – was cleared by U.S. health officials nearly 40 years ago and is used in making many foods, including cheese. Related compounds have a role in baked goods and chocolate products.
Using small amounts of ammonia to make food is not unusual to those expert in high-tech food production. Now that little known world is coming under increasing pressure from concerned consumers who want to know more about what they are eating.
“I think we’re seeing a sea change today in consumers’ concerns about the presence of ingredients in foods, and this is just one example,” said Michael Doyle, director of the University of Georgia’s Center for Food Safety….”
Comments »Oceans Started Warming 135 Years Ago, Study Suggests
Joseph Castro, LiveScience Staff Writer
Date: 02 April 2012 Time: 09:20 AM ET
The world’s oceans have been warming for more than 100 years, twice as long as previously believed, new research suggests.
The findings could help scientists better understand the Earth’s record of sea-level rise, which is partly due to the expansion of water that happens as it heats up, researchers added.
“Temperature is one of the most fundamental descriptors of the physical state of the ocean,” said the study’s lead author,Dean Roemmich, an oceanographer at the University of California, San Diego. “Beyond simply knowing that the oceans are warming, [the results] will help us answer a few climate questions.”
Read the rest here.
No Big Deal: The Radiation No One is Talking About
Bees Harmed by Low Levels of Common Pesticides
“Even low doses of popular pesticides can reduce bees’ survival and reproduction, two new studies show.
The findings bolster evidence that such chemicals may be partly responsible for recent declines in populations of honeybees andbumblebees around the world, which have caused alarm due to the insects’ importance as crop pollinators.
The researchers suggest the widespread use of the pesticides needs to be re-evaluated in light of the findings.
The two studies, published Wednesday in the journal Science, looked at the effects of pesticides called neonicotinoids on bumblebees and honeybees, respectively. The chemicals were fed to the bees in doses similar to those that they would be exposed to in the wild when foraging among crops sprayed with the pesticides.
Neonicotinoids, first introduced in the 1990s, are used to kill aphids and other sap-sucking insects. According to a news release from Science, they are now some of the most widely used crop pesticides in the world.
In the first study, led by Penelope Whitehorn at the University of Stirling in Britain, colonies of buff-tailed bumblebees were fed doses of a neonicotinoid pesticide called imidacloprid and then allowed to forage for six weeks. The researchers found that bumblebees exposed to the pesticide had nests that were an average of eight to 12 per cent smaller than colonies that weren’t exposed. They also produced 85 per cent fewer queen bees.
That could have a huge effect on bumblebee populations, because all bumblebees except the queens die when winter sets in. Bumblebee populations rely on the queens to survive the winter and found new colonies in the spring.
In the second study, led by Mickaël Henry of the French National Institute for Agricultural Researchin Avignon, France, honeybees were fed small doses of a different neonicotinoid pesticide called thiamethoxam. They were then tracked with small microchips called RFID tags.
The researchers found that 10 to 31 per cent of bees exposed to the pesticide did not return to their colony after being released to forage for the day. That was up to double the estimated normal mortality rate for a honeybee on a given day, about 15 per cent.
The pesticide appears to interfere with the bees’ ability to navigate and find their way back to the colony, an effect that has been shown in previous studies.
Henry noted that currently, in order to get a pesticide approved, the manufacturer must show that the product does not directly kill bees when applied to a field.
“But they basically ignore the consequences of doses that do not kill them but may cause behavioral difficulties,” he said in a statement.
David Goulson, who co-authored the British study with Whitehorn, said the use of neonicotinoid pesticides “clearly poses a threat” to the health of bees and “urgently needs to be re-evaluated.”
Comments »Low IQ & Liberal Beliefs Linked To Poor Research?
Watch out Sam Harris, Gordon Hodson and Michael A. Busseri of Brock University are giving you competition for the worst use of statistics in an original paper.
Their “Bright Minds and Dark Attitudes: Lower Cognitive Ability Predicts Greater Prejudice Through Right-Wing Ideology and Low Intergroup Contact” published in Psychological Science1—headlined in the press as Low IQ & Conservative Beliefs Linked to Prejudice—is a textbook example of confused data, unrecognized bias, and ignorance of statistics.
Hodson and Busseri on are track to beat out Harris’s magnificent effort, and they might also triumph over the paper which “proved” brief exposure to the American flag turns one into a Republican and the peer-reviewed work “proving” exposure to 4th of July parade turns one into a Republican.
Let’s see how they did it.
Read the rest here.
Comments »New Research: Compelling Evidence of Urban Heat Island Effect in Global Temperature Data
McKitrick & Michaels Were Right: More Evidence of Spurious Warming in the IPCC Surface Temperature Dataset
Guest post by Roy W. Spencer, Ph. D.
The supposed gold standard in surface temperature data is that produced by Univ. of East Anglia, the so-called CRUTem3 dataset. There has always been a lingering suspicion among skeptics that some portion of this IPCC official temperature record contains some level of residual spurious warming due to the urban heat island effect. Several published papers over the years have supported that suspicion.
The Urban Heat Island (UHI) effect is familiar to most people: towns and cities are typically warmer than surrounding rural areas due to the replacement of natural vegetation with manmade structures. If that effect increases over time at thermometer sites, there will be a spurious warming component to regional or global temperature trends computed from the data.
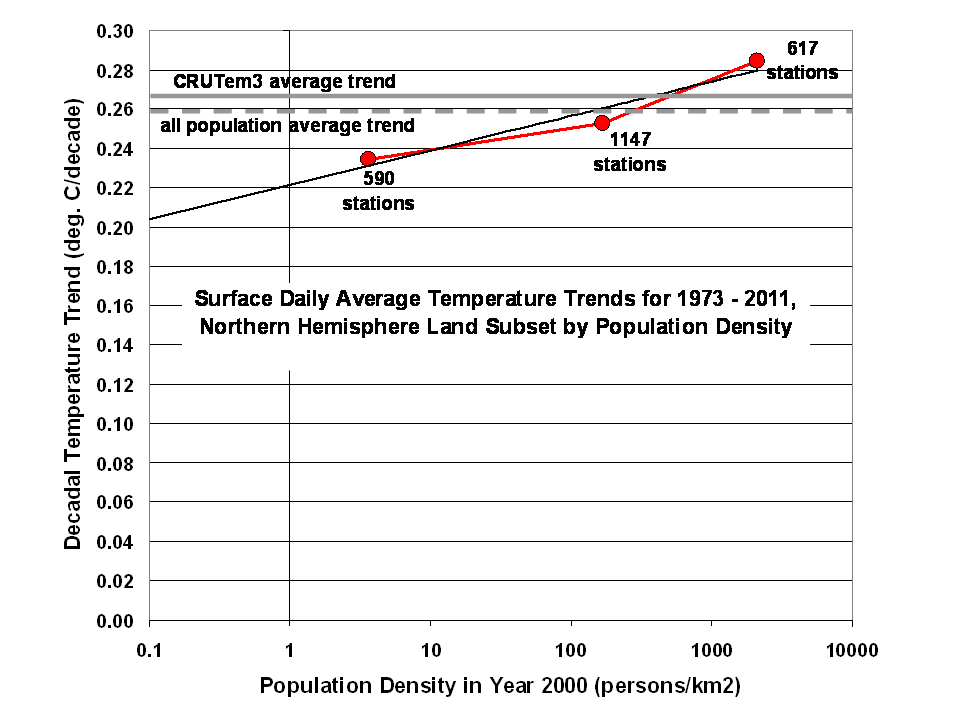
Here I will show based upon unadjusted International Surface Hourly (ISH) data archived at NCDC that the warming trend over the Northern Hemisphere, where virtually all of the thermometer data exist, is a function of population density at the thermometer site.
Depending upon how low in population density one extends the results, the level of spurious warming in the CRUTem3 dataset ranges from 14% to 30% when 3 population density classes are considered, and even 60% with 5 population classes.
DATA & METHOD
Analysis of the raw station data is not for the faint of heart. For the period 1973 through 2011, there are hundreds of thousands of data files in the NCDC ISH archive, each file representing one station of data from one year. The data volume is many gigabytes.
From these files I computed daily average temperatures at each station which had records extending back at least to 1973, the year of a large increase in the number of global stations included in the ISH database. The daily average temperature was computed from the 4 standard synoptic times (00, 06, 12, 18 UTC) which are the most commonly reported times from stations around the world.
At least 20 days of complete data were required for a monthly average temperature to be computed, and the 1973-2011 period of record had to be at least 80% complete for a station to be included in the analysis.
I then stratified the stations based upon the 2000 census population density at each station; the population dataset I used has a spatial resolution of 1 km.
I then accepted all 5×5 deg lat/lon grid boxes (the same ones that Phil Jones uses in constructing the CRUTem3 dataset) which had all of the following present: a CRUTem3 temperature, and at least 1 station from each of 3 population classes, with class boundaries at 0, 15, 500, and 30,000 persons per sq. km.
By requiring all three population classes to be present for grids to be used in the analysis, we get the best ‘apples-to-apples’ comparison between stations of different population densities. The downside is that there is less geographic coverage than that provided in the Jones dataset, since relatively few grids meet such a requirement.
But the intent here is not to get a best estimate of temperature trends for the 1973-2011 period; it is instead to get an estimate of the level of spurious warming in the CRUTem3 dataset. The resulting number of 5×5 deg grids with stations from all three population classes averaged around 100 per month during 1973 through 2011.
RESULTS
The results are shown in the following figure, which indicates that the lower the population density surrounding a temperature station, the lower the average linear warming trend for the 1973-2011 period. Note that the CRUTem3 trend is a little higher than simply averaging all of the accepted ISH stations together, but not as high as when only the highest population stations were used.
The CRUTem3 and lowest population density temperature anomaly time series which go into computing these trends are shown in the next plot, along with polynomial fits to the data:
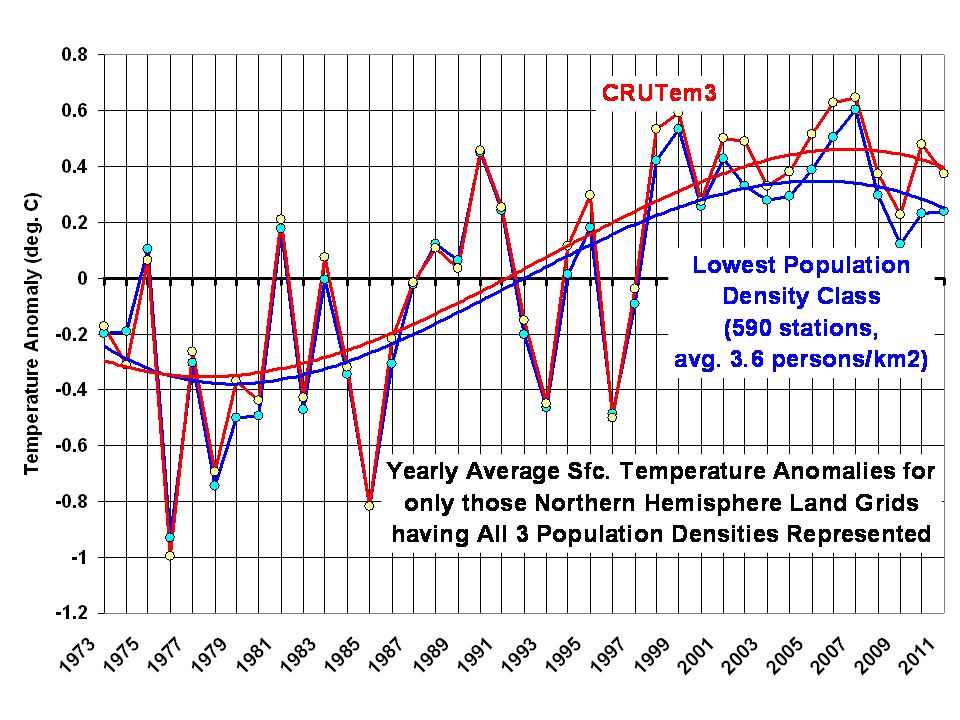
Again, the above plot is not meant to necessarily be estimates for the entire Northern Hemispheric land area, but only those 5×5 deg grids where there are temperature reporting stations representing all three population classes.
The difference between these two temperature traces is shown next:
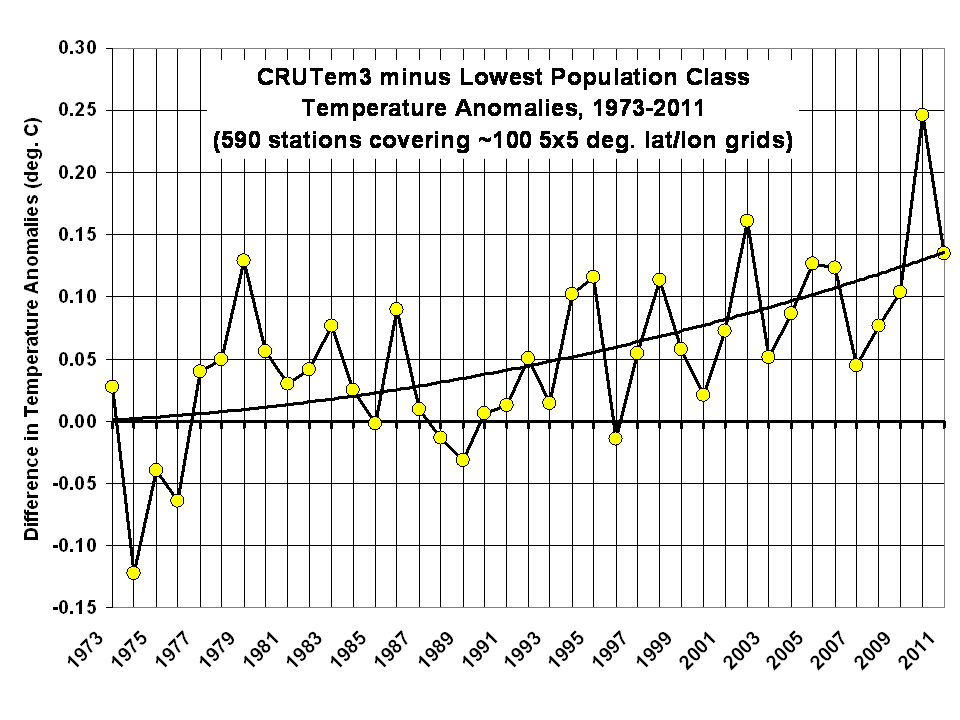
From this last plot, we see in recent years there appears to be a growing bias in the CRUTem3 temperatures versus the temperatures from the lowest population class.
The CRUTem3 temperature linear trend is about 15% warmer than the lowest population class temperature trend. But if we extrapolate the results in the first plot above to near-zero population density (0.1 persons per sq. km), we get a 30% overestimate of temperature trends from CRUTem3.
If I increase the number of population classes from 3 to 5, the CRUTem3 trend is overestimated by 60% at 0.1 persons per sq. km, but the number of grids which have stations representing all 5 population classes averages only 10 to 15 per month, instead of 100 per month. So, I suspect those results are less reliable.
I find the above results to be quite compelling evidence for what Anthony Watts, Pat Michaels, Ross McKitrick, et al., have been emphasizing for years: that poor thermometer siting has likely led to spurious warming trends, which has then inflated the official IPCC estimates of warming. These results are roughly consistent with the McKitrick and Michaels (2007) study which suggested as much as 50% of the reported surface warming since 1980 could be spurious.
I would love to write this work up and submit it for publication, but I am growing weary of the IPCC gatekeepers killing my papers; the more damaging any conclusions are to the IPCC narrative, the less likely they are to be published. That’s the world we live in.
Read the rest here.
Comments »Do Stocks Always Outperform (in the Long Run)?
via The Psy-Fi Blog
The equity premium puzzle is one of the longest standing anomalies in finance: the finding that stockmarket investing outperforms other types of investment by a significant amount. Generally you’d expect the price of shares to rise until this advantage was cancelled out, but this hasn’t happened and has made quite a lot of futurologists look rather silly.
It turns out, though, that the equity premium puzzle may be even more puzzling than it first appears. Basically researchers aren’t exactly sure how large it is, or even if it exists at all. So is the idea that stocks always outperform other investments in the long run just another market myth used to cajole unwary investors into parting with their hard-earned cash?
Read the rest here.
Comments »
Coffee Break: Billions of Habitable Planets Found
New Study: The whole of the Earth Heated up in Medieval Times Without Human CO2 Emissions
PUBLISHED: 07:21 EST, 26 March 2012 | UPDATED: 07:55 EST, 26 March 2012
Current theories of the causes and impact of global warming have been thrown into question by a new study which shows that during medieval times the whole of the planet heated up.
It then cooled down naturally and there was even a ‘mini ice age’.
A team of scientists led by geochemist Zunli Lu from Syracuse University in New York state, has found that contrary to the ‘consensus’, the ‘Medieval Warm Period’ approximately 500 to 1,000 years ago wasn’t just confined to Europe.
In fact, it extended all the way down to Antarctica – which means that the Earth has already experience global warming without the aid of human CO2 emissions.
Read the rest here.
Comments »
Women Bankers Linked to Rise in Risk-taking
Ralph Atkins
The image of women as safer managers less likely to fritter away a bank’s finances is wrong – and politicians should take note, according to Bundesbank research.
Board changes at banks that result in a higher proportion of female executives “lead to a more risky conduct of business”, conclude the authors of an extensive study of German finance houses released by the country’s central bank.
Read the rest here.
Comments »