Mexican & Latinos Flood South of the Border
Durable Goods Show The Economy Fell Flat
“Demand for long-lasting U.S. manufactured goods was the weakest in three years in March and a gauge of business spending plans fell, suggesting the economy lost momentum as the first quarter drew to a close.
Durable goods orders dropped 4.2 percent, the largest decline since January 2009, the Commerce Department said on Wednesday after a downwardly revised 1.9 percent increase in February.
Economists had forecast orders for durable goods, which range from toasters to aircraft, falling 1.7 percent after a previously reported 2.4 percent rise in February.
“This adds to the evidence that momentum in the economy sort of fell flat in March,” said Ellen Zentner, a senior U.S. economist at Nomura Securities in New York.
The data came as officials at the Federal Reserve met for a second day to deliberate on policy. The U.S. central bank is not expected to make any policy changes and will issue its statement at the end of the meeting around 12:30 p.m. (1630 GMT)
U.S. stock index futures pared gains on the data, while prices for Treasury debt pared losses to stand little changed. The dollar extended losses against the yen.
The report was the latest to show the manufacturing sector losing a step in March and it added to signs that the economy ended the first quarter on a soft spot.
Data last week showed industrial production was flat in March for a second straight month, while some gauges of regional factory activity weakened in April.
In addition to weakness in factory gauges, U.S. jobs growth slowed sharply last month and consumer confidence ebbed.
Manufacturing has been one of the main sources of economic growth, but is slowing as euro zone economies slide into recession and China cools.
Even though there are signs of some weakening in economic data early in the second quarter, economists believe the bar remains high for the Fed to ease policy further through a third round of bond purchases or quantitative easing….”
Comments »America’s Secret Growth Weapon: Why Immigration Really, Really Matters
Is the Era of Cheap China Coming to an End ?
“Rein is managing director of China Market Research Group, a strategic market intelligence firm with clients like Apple, DuPont and Kentucky Fried Chicken.
His thesis: “China’s evaporating cheap labor pool will disrupt supply chains and consumption habits around the world. Executives and policymakers need to prepare ahead of the curve, to evolve and take advantage of the changes — or else face extinction.”
The country’s unfettered growth and influence — billionaires now outnumbering their American counterparts — already reverberates through international markets.
Rein arrived in China in the 1990s. Now, unlike the 1990s, job opportunities are no longer scarce. The country’s twentysomethings are hopeful about their futures and career prospects. Their optimism is bolstering China’s consumers and workers, both of which demand American-style lifestyles. China’s middle class — 350 million and growing — want a piece of the good life, he says.
To satisfy China’s growing consumerism, foreign corporations are no longer operating in China as a lower-cost production center.
“Some companies cope with the End of Cheap China by building brands and charging more for their products; others by consolidating market share and becoming a volume player; and still others by converting factories to sell within China and other emerging markets,” Rein writes.
While China is an easy target for protectionists, many American businessmen hope to penetrate an expanding market and make customers of millions of Chinese with more money to spend. To those U.S. executives, China’s economic rise will create thousands of jobs for all kinds of companies in the United States.
Rein combines elegant writing and a methodical research. Years of working in China have given him access to important players. Incisive interviews with billionaires, business executives, government officials, and migrant workers guide the pulse of the narrative.
Each chapter concludes with strategic questions about “what to do and what not to do in China.” But the book is not a clear road-map to correcting the disruption he foresees. He leaves it to readers to answer many questions.
The main question still to be answered: Will China’s power and influence benefit or undermine the U.S. economy?
Rein’s exposé on the dawn of a new China is essential reading for anyone curious about globalism and the dynamism of the international economy.”
Comments »
BLACK MONEY
In light of the Walmart fiasco i thought it might be of interest to see other instances of bribery involved with business. The funny thing is it is treated as if the action is few and far between, but the reality is common place. In addition to bribery you can add threats, intimidation, black mail, and in some cases murder.
Comments »
Preliminary Numbers Show China Manufacturing May Shrink Further Into Recessionary Territory
“China’s manufacturing may shrink for a sixth month in April, maintaining pressure on officials to adopt more policies to stimulate economic growth, a survey of companies showed.
The 49.1 preliminary reading of the purchasing managers’ index from HSBC Holdings Plc and Markit Economics today compares with a final 48.3 in March. A number below 50 points to a contraction.
The contraction, if confirmed in the final reading due May 2, would be the longest since the global financial crisis and may spur the government to lower banks’ reserve requirements a third time since November. A $430 billion expansion of the International Monetary Fund’s lending power in Washington talks ending yesterday may help contain Europe’s debt turmoil and shore up demand in China’s biggest export market.
“The numbers in recent months have never been that good but don’t show signs of falling off a cliff either,” Paul Cavey, a Hong Kong-based economist with Macquarie Securities Ltd., said of the HSBC PMI. “Today’s number would suggest continuation of the government’s current policy of slow, cautious loosening.”
Comments »Rising Fears That Recovery May Once More Be Faltering
Food Stamp Rolls Grow by 70% Since 2007
The Congressional Budget Office said Thursday that 45 million people in 2011 received Supplemental Nutrition Assistance Program benefits, a 70% increase from 2007. It said the number of people receiving the benefits, commonly known as food stamps, would continue growing until 2014.

- Click for larger CBO infographic.
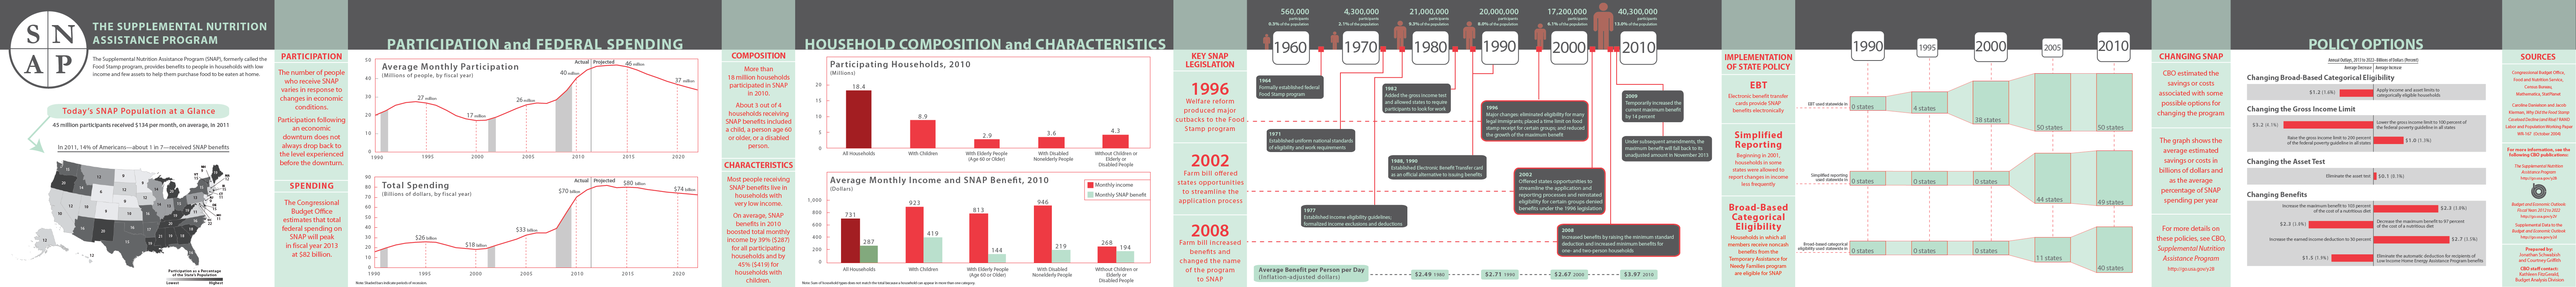
Spending for the program, not including administrative costs, rose to $72 billion in 2011, up from $30 billion four years earlier. The CBO projected that one in seven U.S. residents received food stamps last year.
In a report, the CBO said roughly two-thirds of jump in spending was tied to an increase in the number of people participating in the program, which provides access to food for the poor, elderly, and disabled. It said another 20% “of the growth in spending can be attributed to temporarily higher benefit amounts enacted in the” 2009 stimulus law.
CBO said the number of people receiving benefits is expected to fall after 2014 because the economy will be improving.
“Nevertheless, the number of people receiving SNAP benefits will remain high by historical standards,” the agency said….”
Comments »Survey: Manufacturers More Likely to Hire in U.S. vs China
A Clear Sign of Present GDP Upside
“Strong earnings reports from two of the nation’s biggest freight railroads show that the U.S. economy is continuing its long, slow recovery.
Union Pacific Corp. said Thursday its first-quarter net income jumped 35 percent as the railroad hauled more cars and crude oil. CSX said earlier this week that its net income jumped 14 percent. Both railroads were hauling more containers of consumer goods and both were able to increase rates enough to offset a decline in coal shipments after a mild winter.
“The economy is stable and slowly growing,” said Jack Koraleski, Union Pacific’s president and CEO. “We’re seeing some generally positive trends.”
Many people will be encouraged by the reports because the major freight railroads are considered indicators of the nation’s economic health. The amount of cars, chemicals, crops, lumber and containers of imported goods that railroads carry across the country offer insight into those industries.
“The railroad is a good leading indicator of how the economy will do,” said Sung Won Sohn, an economics professor at California State University.
Both Union Pacific and CSX reported a drop in coal shipments. Winter weather was mild and prices for natural gas, an alternative for power generation, are around 10-year lows. UP’s energy shipments declined 8 percent, and CSX reported a 14 percent drop in its coal shipments.
But shipments of more economically sensitive items like cars, lumber, industrial products and crude oil all increased in the quarter. That led officials at both Union Pacific and CSX to express confidence that their companies could offset the decline in coal shipments this year with growth in other areas of their business.
The 15 percent jump in automotive shipments that Union Pacific reported was particularly encouraging. That figure reflects the 13 percent increase in sales of cars and trucks in the first quarter. Analysts are predicting sales of 14.5 million or more this year, which would be the industry’s best performance since 2007.
Sohn said the railroads’ strong performance, combined with data on trucking and port traffic, all suggest the economy is doing just fine.
“They all indicate that the economy is moving in the right direction,” Sohn said.
That’s the trend railroad officials have been seeing although Koraleski said he worries that sustained high gasoline prices could slow the economic recovery. The national average for a gallon of regular gasoline is $3.89, up 62 cents since Jan. 1.
The U.S. government issues its initial estimate of first-quarter gross domestic product a week from Friday. Economists estimate the economy grew around 2.5 percent in the first three months of the year.
Omaha-based Union Pacific said Thursday that it generated $863 million in net income, or $1.79 per share, in the quarter that ended March 31. That’s up from $639 million, or $1.29 per share, a year earlier.
UP, which is the nation’s largest railroad, said it increased prices on many shipments and collected more fuel surcharge fees during the quarter to boost its revenue 14 percent to $5.11 billion.
CSX said price increases helped it increase profits 14 percent to $449 million, or 43 cents per share, in the first quarter. That’s up from $395 million, or 35 cents per share, a year ago.
Both railroads exceeded what Wall Street had been expecting.
Deutsche Bank analyst Justin Yagerman gives both UP and CSX a buy rating partly because he believes they’ll be able to continue increasing prices and improving their operations.
Union Pacific has 32,400 miles of track crossing 23 states from the Midwest to the West and Gulf Coasts.
CSX is based in Jacksonville, Fla., and has about 21,000 miles of track in 23 eastern states and two Canadian provinces.”
Comments »
The Laffer Curve Refuted
via Middle Class Political Economist
Mike Kimel at Angry Bear has several nice posts on the “Laffer Curve” that underlies much of conservative economic orthodoxy in this country. As you may know, Art Laffer famously claimed that at tax rates of 0 and 100%, you would get zero tax revenue, and that in between, there is an inverted U shaped curve, where taxes collected first increase as the tax rate goes up, then decrease as tax rates go higher still, back down to zero tax collected when the tax rate is 100%.
The Kimel post linked above was prompted by an economist at the American Enterprise Institute, Alan Viard, telling the New York Times that all economists know that when the top tax rate is 35%, cutting rates further will reduce tax revenue.
“The Reagan tax cuts, on the whole, reduced revenue,” he explains. “The Bush tax cuts clearly reduced revenue. There is no dispute among economists about that.”
Except, as Kimel points out, lots of conservative economists dispute this, including one who co-authored a paper with Viard! For his trouble, Kimel became the subject of a post at the AEI blog by James Pethokoukis, which started by completely misidentifying him and going downhill from there. For Kimel’s enjoyable takedown of this post, see here.
All this led me back to an earlier post of Kimel’s, where he makes an empirical estimate of the Laffer Curve, using U.S. data all the way back to 1929, the first year for which official U.S. data exists. I’ll spare you the technical details (see Kimel’s post), but here’s the bottom line: Laffer got it exactly backward, with tax revenue initially falling as tax rates increase, then rising after a further increase in rates. Here is Kimel’s estimate of the “true” Laffer curve:
Read the rest here.
Comments »LA Area Port Traffic Increases in March, Exports Hit New Record
via CalculatedRisk, some very interesting graphs and stats related to port traffic and exports.
Comments »The Power of $YELP – Snobby Critics are Getting Fired
via
SF Examiner Critic Unterman Dismissed After 20 Years
Monday, April 16, 2012, by Paula Forbes
 San Francisco restaurant critic Patricia Unterman has been let go from the San Francisco Examiner after twenty years with the paper. Surely this is all Yelp’s fault, as the website is believed by some critics to have “contributed to the mass murder of true critics.” No, it is the fault of the paper’s new owners, Canadian publisher Black Company.
Unterman saw the Examiner go through three owners during her tenure as critic; she will be replaced byEast Bay Express critic Jesse Hirsch.
The Laffer Curve Shows that Tax Increases Are a Very Bad Idea – even if They Generate More Tax Revenue
Posted by Daniel J. Mitchell
The Laffer Curve is a graphical representation of the relationship between tax rates, tax revenue, and taxable income. It is frequently cited by people who want to explain the common-sense notion that punitive tax rates may not generate much additional revenue if people respond in ways that result in less taxable income.

Unfortunately, some people misinterpret the insights of the Laffer Curve. Politicians, for instance, tend to either pretend it doesn’t exist, or they embrace it with excessive zeal and assume all tax cuts “pay for themselves.”
Read the rest here.
Comments »Americans Begin to Trade Up After a Period of Frugality
The article is about trading up, but the firstparagraph opens with middle to higher incomes buying Este Lauder and Dunkin Doughnuts. My bad, but I never considered EL or Dunkin as a trade up….down and out perhaps.
Comments »Italian Industrial Output Falls for a Second Month
How to Create Fake Growth Chinese Style
“This is a guest post from Christopher Pavese, CFA, Chief Investment Officer at Broyhill Asset Management. He and his team have recently been on a research-intensive trip in China, and has kindly agreed to share what he found. Visit his blog (The View from the Blue Ridge) for more analyses.
The Union of Soviet Socialist Republics (USSR) was a single-party state ruled by the Communist Party. The state was structured under a highly-centralized government and a command economy, meaning both capital and resources could be mobilized quickly and proficiently. However, speed and agility do guarantee economic efficiency and can often result in a massive misallocation of capital, which ultimately comes at a high price. This is a lesson China has chosen to ignore as signs of capital misallocation are widespread throughout the People’s Republic today.
The Economist Intelligence Unit (EIU) estimates that average living space per head is over 30 square meters in China, extraordinarily high given the country’s current income levels. “Based on international comparisons, a country at China’s level of GDP per head should have 20 square meters of living area, which would mean that China is 53% over-housed,” according to the EIU. Despite China already being the most “over-housed” country in the world, official data show a further three billion square meters of residential property currently under construction, according to The Wall Street Journal.

China’s real estate sector directly accounts for roughly 12% of GDP. To help put this figure in perspective, consider that private real estate investment in the US reached a staggering 6.3% of GDP at the peak of the housing market, in 2005. But China’s astonishing figure also ignores countless related industries driven by the bubble in construction (i.e. steel, cement, etc.) and the illusion of wealth created by a historic credit binge (i.e. appliances, home furnishings, etc.). A more inclusive estimate of Chinese real estate’s impact on GDP could be twice the commonly reported figures. Our friend, Vikram Mansharamani, provided some color into the excesses in the steel sector in his excellent book, Boombustology:
“When thinking about over investment and the potential for a bust, the steel industry exemplifies overcapacity. Chinese steel production has grown from 23 million tons in 1977 to a run rate of approximately 650 million tons during the first half of 2010. This growth has taken the Chinese steel industry’s share of global steel production from around 3% in 1977 to almost 50% by 2010.
“If we take a moment to break down the sources of demand for Chinese steel, one finds a potentially reflexive relationship with the property market. Anecdotal evidence suggests that up to 20% of Chinese steel production is being used to construct more steel mills!
“Most believe that utilization has been running between 65% and 75%. The WSJ reported in 2009 that there existed 200 million tons of excess capacity, while UBS analysis conducted in early 2010 suggested there was about 175 million tons of excess capacity. To put these numbers in context, 175 million tons of annual steel production is more than the production of South Korea and Japan – combined! Steel does not appear to be an outlier; similar grandiose statistics can be found for the size of the Chinese cement (greater than the rest of the world combined) and aluminum industries.”
With home prices now following transaction activity sharply lower, the biggest risk for the Chinese economy, as well as the rest of the world, is a sharp slowdown in new construction. Granted, official data still paint a more “balanced” picture, consistent with the standard responses we received from various developers throughout the country. When asked about the outlook for real estate prices we were regularly told that, “prices have reached bottom,” or that “prices have stabilized,” but curiously, when asked how much they had fallen, the immediate response was always, “they have not fallen.” Odd. Perhaps the laws of economics work differently in a command economy, but in a market economy prices tend to fall before “reaching bottom.”
While interested parties remain in denial, disagreements between friends are often settled using the following equation: “Figures don’t lie, but liars figure.” Consider that China Vanke, the nation’s top property developer, suffered a 40% drop in January sales. Consider that sales of excavators and bulldozers dropped by 53% and 67% respectively in January, according to China Construction Machinery Business Online. And consider that inventory levels recently reached historic highs at the same time sales activity has dropped off a cliff.

Figures don’t lie and liars figure, but a picture is worth a thousand word. So we’ll summarize how we view the Chinese economy’s attempt at rebalancing away from domestic investment and toward consumption with a few pictures. But first, consider that one of the most insightful nuggets from our visits with various local government officials was the common belief that, “Developing new cities and building new infrastructure will increase consumption.” Judging by the foot traffic shown in this Zhuhai Home Furnishings Mall, you could say that I am slightly suspicious. Please note that this particular savvy shopper is none other than our own, Hunt Broyhill, not a Chinese home owner.

And the striking gentleman at the railing in the photo on the right is none other than Cullen Thompson, CIO of Bienville Capital Management. Also, not a Chinese home owner, although full disclosure, the two women shown on the left picture, may very well be actual Chinese consumers.

We did not have any more success finding foot traffic at The Global Furnishing Design and Exhibition Center in Shanghai, the largest city in the world, and one where you might expect to see more than a few signs of increased consumption.

Not so much.


Victor Shih, author of Factions and Finance in China, estimates that the top one percent of Chinese households own up to half of the bank deposits in the country. You might have expected to see at least a handful of the ten million plus people this represents shopping on a weekday afternoon.
More on these bank deposits in our next post . “
Comments »China Reports an Unexpected Rise in Imports
“China reported an unexpected trade surplus last month as import growth trailed forecasts, underscoring risks of a deeper slowdown in the world’s second- largest economy.
Inbound shipments rose 5.3 percent, the customs bureau said today, below the 9 percent median estimate in a Bloomberg News survey. Exports increased 8.9 percent from a year earlier, more than forecast, leaving a trade surplus of $5.35 billion, compared with a median projection for a $3.15 billion trade deficit…”
Comments »Japan Goes From a Current Account Deficit to a Surplus
“Japan swung to a current-account surplus in February after a record deficit in January, lending support to a currency that officials have sought to weaken to aid exporters and economic growth.
The excess in the widest measure of trade was 1.18 trillion yen ($14.5 billion) the Ministry of Finance said in Tokyo today. The median estimate of 25 economists surveyed by Bloomberg News was for a surplus of 1.12 trillion yen.
The yen is rebounding even after interventions by the finance ministry and monetary easing by the Bank of Japan helped to bring the currency down from October’s post World War II high against the dollar. Governor Masaaki Shirakawa’s policy makers are meeting today and tomorrow to decide whether the world’s third-biggest economy needs more support as it recovers from last year’s earthquake and tsunami.
“There is no doubt that the yen is still too strong for companies to become optimistic, which leads to less investment and weak growth,” said Yoshimasa Maruyama, chief economist at Itochu Corp. in Tokyo. “The BOJ will have to be mindful about the recent yen appreciation.”
The yen traded at 81.48 per dollar, up 0.2 percent as of 10:40 a.m. in Tokyo, strengthening for a fourth day. The Japanese currency hit a postwar high of 75.35 per dollar in October before expanded monetary stimulus by the central bank on Feb. 14 aided weakening….”
Comments »