“Let’s take another look at debt. We’ve probably all gotten so used to huge debt numbers that we’re losing sight of what they actually mean. In the following article, Tyler Durden made me rethink both the debt issue and the perverse consequences of 7 years of zero interest policies (ZIRP) and/or ultra low interest rates. The destruction to society is far greater than anyone seems to be willing to let on. But that doesn’t make it any less real. Here goes:
According to the most recent CapitalIQ data, the single biggest buyer of stocks in the first quarter were none other than the companies of the S&P500 itself, which cumulatively repurchased a whopping $160 billion of their own stock in the first quarter! Should the Q1 pace of buybacks persist into Q2 which has just one month left before it too enters the history books, the LTM period as of June 30, 2014 will be the greatest annual buyback tally in market history. And now for the twist. Unlike traditional investors who at least pretend to try to buy low and sell high, companies, who are simply buying back their own stock to reduce their outstanding stock float, have virtually zero cost considerations: if the corner office knows sales and Net Income (not EPS) will be weak in the quarter, they will tell their favorite broker to purchase $X billion of their shares with no regard for price.
The only prerogative is to reduce the amount of shares outstanding and make the S in EPS lower, thus boosting the overall fraction in order to beat estimates for one more quarter. Compounding this indiscriminate buying frenzy is that ever more companies (coughaaplecough… and IBM of course) are forced to issue debt in order to fund their repurchases. So since the cash flow statement merely acts as a pass-through vehicle and under ZIRP companies with Crap balance sheets are in fact rewarded (as even Bloomberg noted earlier) the actual risk of the company mispricing its stock buyback entry point is borne by the bond buyer who in chasing yield (with other people’s money) serves as the funding source for these buybacks.
Corporations buy back their own shares in order to fool investors about their performance numbers. It’s a profitable undertaking for them because they can borrow at next to nothing. A very simple calculation: if we buy and borrow $1 billion worth, what’s the effect on our balance sheet? How about $10 billion? The essence: there is a reason junk bonds are so popular: there are no ‘normal’ yields left because of central banks’ ZIRP. That’s not to say Apple issues junk, but the principle is the same. Bond buyers, e.g. money market funds, will buy anything. VIX volatility is ultra low, everyone’s doing it, what could go wrong? Well, the answer to that question might to a large extent lie in private and public debt numbers. If only because much of the money corporations borrow to do buybacks has in turn also been borrowed.
When you follow the dots, you must wonder where there is still any ‘money’ left that has not been borrowed. You may even want to wonder whether you have any of it. And you might ask how it is possible that while any and all borrowing is supposed to be collateralized, it’s hard to find ‘hard’ collateral anywhere in the cycle. We can understand that when a Chinese state owned enterprise uses one load of iron ore, bought with credit, as collateral for the next one, something’s amiss. But do we also understand that in our own economies, despite the huge existing debt, and because of ZIRP policies, there is more borrowing instead of less, as would seem to be the smart thing to do. ZIRP thus leads to more debt, and – inevitably – exponentially more bad debt. You can’t heal a sick economy with more debt if it already has historically high levels of it, but that’s still exactly what central bankers claim they try to do.
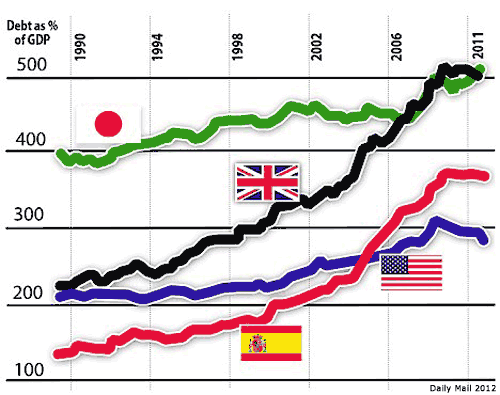
First, a Daily Mail graph from 2012 gives an indication of total debt numbers for a handful of countries
 And if you think that looks bad (not that it doesn’t, mind you), there’s this 2011 Haver/Morgan Stanley one we’ve seen before here:
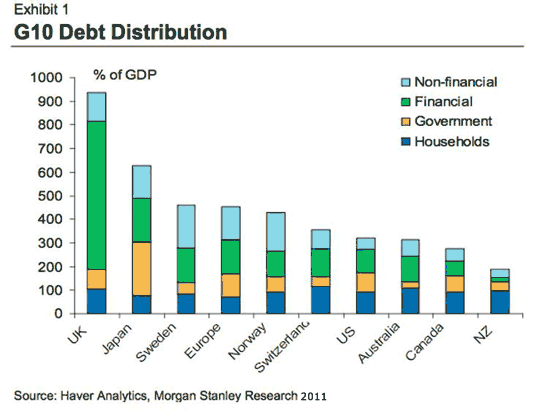 In which total debt for the US, but even more for Japan and especially the UK, are much higher than in the first graph. This may largely be due to underestimating debts in the financial sector, though it’s hard to say. And for the argument I’m trying to make, it doesn’t even matter all that much. Though I would like to say that it’s crazy that we have no better insight in bank debt than we have. We’re asked to recognize that some of our banks are so big they could bring down our entire economies, but we’re not supposed to know how close they are to doing just that. Honesty would kill us, apparently. The 2nd graph shows a huge, 600% of GDP, debt for the UK, but only perhaps 100% for the US. Oh, really? Let’s see the books.
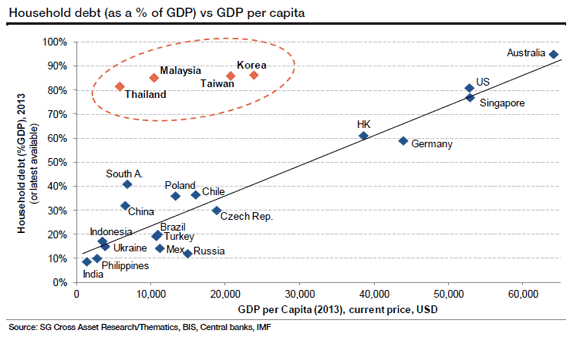
What’s a little easier to figure out concerning all this debt are the household and government parts. Here’s a comparison:
 Let’s take the US as an example. There are 300 million Americans, so about 100 million families…..”

