“Dow is up more than 5% five consecutive years now. A sixth such year has not happened before in history. A 5-year bull trend only occurred once before, in the 1990s, and was followed by 3 down years. Russell 2k rallies of similar size and duration to 2013′s (excluding accelerations from major bear lows) are shown below. In each case all the gains were given back the following year.
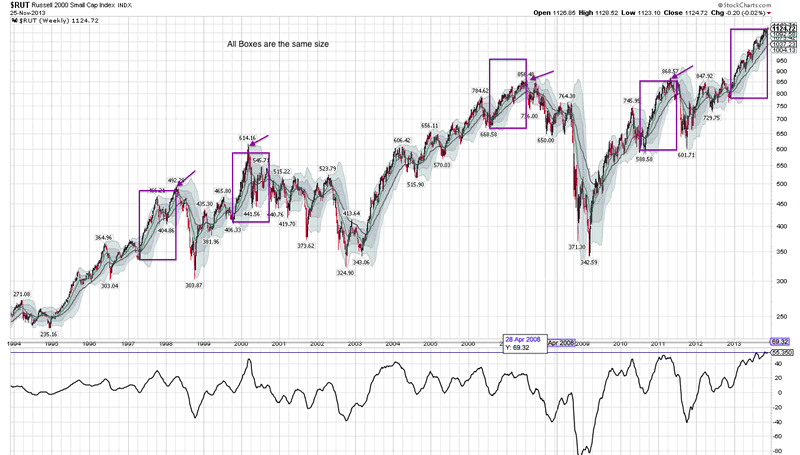
Source: Fat-Pitch
2014 is the second year in the Presidential cycle, and is the weakest historically by returns, averaging flat. The logic for this is that is it a time for governments to deploy tougher, unpopular policies. The Investors Intelligence bull-bear ratio currently exceeding 40% also forecasts a flat return for the SP500 by the end of 2014, by averaging history, whilst the II bear percentage alone, around 15% the last 4 weeks, has historically produced returns of -5% to -20% over the next 6 months.
The Citigroup Panic/Euphoria Model, having crossed the Euphoria threshold, predicts an 83% chance of losses in 2014. Goldman’s analysis of performance following a year of 25% gains or more point to a median drawdown of 11% in the next 12 months.
Next is a chart highlighting a couple of previous occurrences similar to 2012 and 2013 where stock index rises were dominated by multiple expansion, not earnings growth.
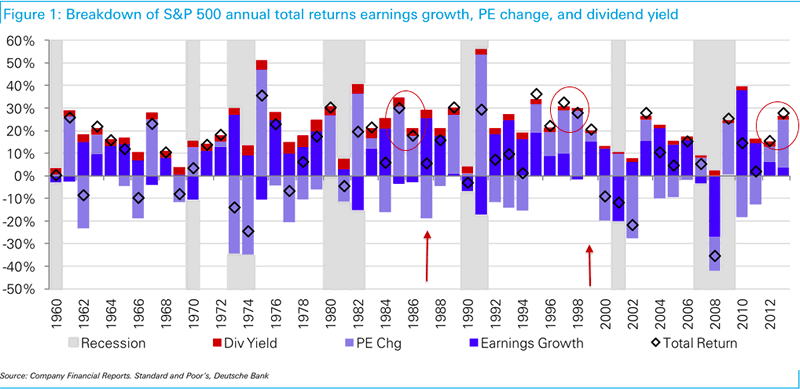
Source: Fat-Pitch
In both instances the following two years saw better earnings growth. But notably the next two years were 1987, stock market crash, and 1999, at the end of which the Dow peaked, suggesting a common theme of pre-correction exuberance.
Both the following charts reveal that 10 year stock market returns are closely correlated to deviations from norms 10 years earlier. The first correlates average investor allocations and the second market cap to GDP. I have added the blue horiztonal line averages, revealing both are overvalued currently, but one more extreme than the other.
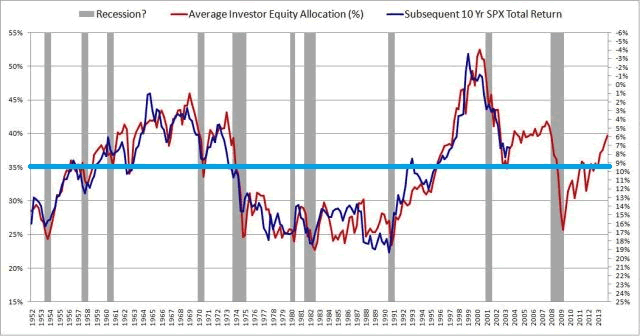
Source: Philosophical Economics
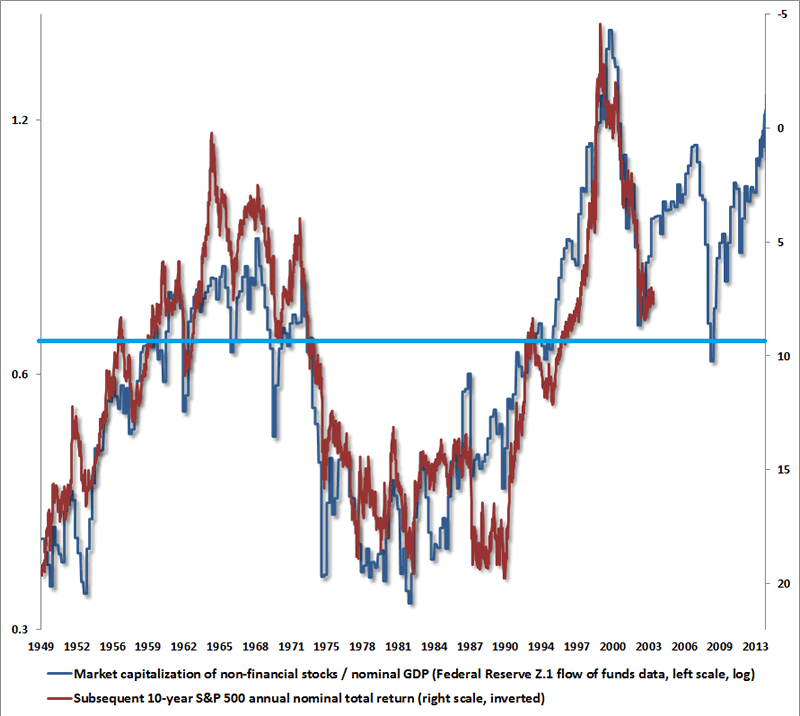
Source: Hussman
The logic behind both is that mean reversion always occurs. The bigger the deviation build the bigger the subsequent normalisation, as ‘this time is different’ each time is disproven. For US markets currently, we see the second highest market cap to GDP valuation outside of 2000, the 4th highest Q ratio valuation and 4th highest CAPE valuation in history. In all the other such historic outliers, a bear market followed to correct the extreme, there was no orderly consolidation of prices whilst the underlying fundamentals accelerated to catch up. ‘This time is different’ thinking argues that because the Fed has suppressed cash and bond yields, equities have to be revalued higher, so this valuation outlier doesn’t count, and there will be an orderly normalisation of valuation as earnings and GDP will accelerate and yields rise slowly, without any crash in equities.
Interesting to discover that the rally in the 1990s was also at the time considered to be Fed-induced and prolonged….”
If you enjoy the content at iBankCoin, please follow us on Twitter
