“Why is there a fundamental mismatch between stock market performance as reported in financial headlines – and the actual retirement behavior of the many millions of Americans who own those stocks in their portfolios?
Using 15 years of stock market performance data and the type of analysis tools used by sophisticated wealth management professionals, we will solve that mystery in this research-based tutorial. The results may come as a major surprise, even for well read and financially literate investors who have been buying stocks for decades.
On the one hand, stocks have been in a sustained rally, with the markets recovering from the depths of 2008 and 2009 and finally moving on to all new highs. This should have created enormous wealth for tens of millions of long-term retirement investors who have stock-heavy investment portfolios in their retirement accounts.
Yet at the very same time, according to recently released government data as reported in Bloomberg and the Washington Post, the fastest growing group of workers in the United States is older than age 65, up 67% in 10 years, and their average weekly pay has climbed from $502 to $825 over that time.
Over a decade, there has been a three-part change in behavior among those aged 65 and older, with a reduction in the percentage of those retiring, an increase in full time work rather than part time work, and incomes that are higher than those of all workers on average. So people with higher wages than the rest of the population are not only not retiring, they are increasingly not slowing down either, but are continuing full time jobs.
Now where the mystery comes in, is that people who are older than 65 with successful careers and good incomes are the exact same people who would be expected to have substantial stock portfolios in their retirement accounts. So if stocks have in fact been creating so much wealth in recent years, why is it that the same segment of the population that owns the largest amount of those stocks are in practice the same group that is changing their retirement behavior in order to prolong their careers and keep their full income coming in?
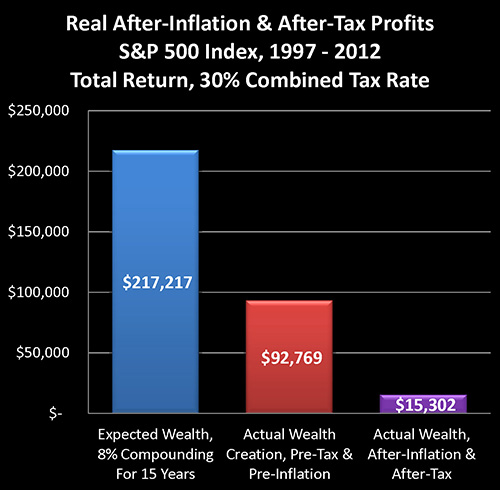
The explanation of the mystery can be found in the graph above, which is based upon historical performance of the Standard & Poor’s 500 index from the end of 1997 through the end of the 2012, as well as official US government inflation statistics for those same 15 years. As such, the graph should act as a reasonable proxy for the real world long term performance results achieved by tens of millions of American investors during those years.
Based on an assumed starting portfolio value of $100,000, the blue bar reflects expectations for the compounding of wealth through stock investment. It assumes an 8% average return – which has been a quite common assumption, particularly 15 years ago.
The red bar shows actual real-world performance on a total return basis, with price movements in the S&P 500 index, dividend payments and the reinvestment of dividend payments. It is much lower than expectations, but still substantially positive.
The purple bar shows what really matters – the purchasing power of average stock market investments on an after-tax and after-inflation basis. As shown above, in the real world for many millions of investors, the purchasing power of long term stock market profits has been virtually non-existent. If we compare what really matters – which is what money will buy for us on an after-tax basis – then real gains are a mere 7% of expected wealth gains.
The purple bar is what reconciles the mystery, and explains the divergence between the headline illusion of major profits and the reality of actual after-tax purchasing power in retirement that is currently driving the behavior of millions of investors.
As we will explore, the ultimate bottom line number of what our investments will buy for us after we’ve paid our taxes has been dominated by something that few average individual investors fully understand, which is the powerful and deceptive relationship between inflation and taxes.
What may come as a particular surprise is that these dramatic results are entirely based upon the officially reported 2.42% average rate of inflation over the 15 years. If our personal experience …..”
If you enjoy the content at iBankCoin, please follow us on Twitter

good work,,,well done