“Those who cannot remember the past are condemned to repeat it. – Santayana
The question of whether to commit new funds to stocks here is nuanced and complex, not least because it isn’t obvious that traditional alternatives – bonds or cash – offer any better value. We are very near all-time low interest rates across most developed government bond markets, credit spreads are near all-time tights, and rates are negative out to 5 or more years in real terms. If these options are representative of the complete opportunity set, then one might be justified in apportioning some capital to equities, if only because it is difficult to identify which investment stinks most profoundly.
However, those who do choose to allocate to equities should be aware of where we are relative to other bull-bear cycles throughout history. We have rambled-on about the poor prospects for equity returns over the next 10 – 20 years in many prior articles (see here for a full analysis, and here for a summary of research from other respected firms), but the true authority on stock market valuation is John Hussman. We would strongly encourage readers to investigate Dr. Hussman’s Weekly Market Comments for all the gory details.
This article approaches the issue from a completely new direction than our other work and the work of Dr. Hussman. It is mostly constructed as a thought experiment that explores the logic of compounding, but the conclusion is troubling for those currently overweight U.S. equities.
For the purpose of the study below, we examined the S&P 500 price series fromShiller’s publicly available database to understand the duration and magnitude of all bull and bear market periods in U.S. stocks since 1871. We defined a bear market as a drop in prices of at least 20% from any peak, and which lasted at least 3 months. Bull markets were then defined as a rise of at least 50% from the bottom of a bear market, over a period lasting at least 6 months.
Chart 1 and Table 1 describe every bull market since 1871 in the S&P, including duration and magnitude information. The lesson from this analysis is uninspiring for equity bulls, as we will see. The core hurdle is that the current bull market has (through end of February) already delivered 105% of gains, against the median 124% bull market run through history (using monthly data). Of course, this means that, should this bull market deliver an average surge, investors can hope for less than 20% more growth from this cycle. Further, given that the median bull market has historically lasted 50 months, and we are currently in our 49th bull month, we are about due for a wipeout.
Chart 1. Bull Markets since 1871
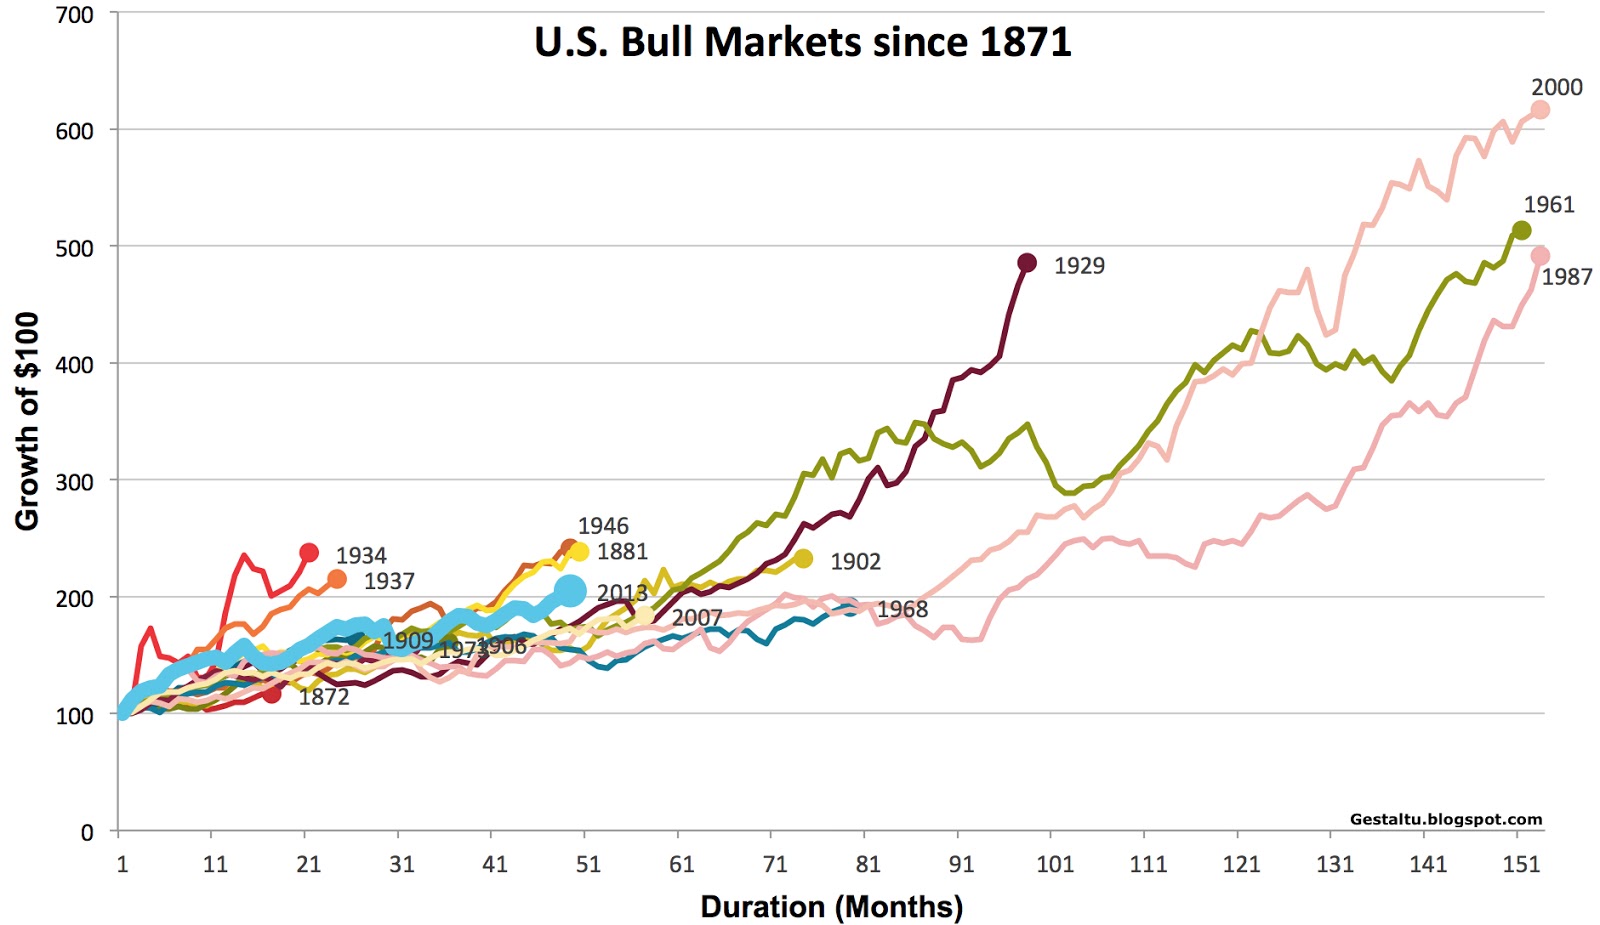
Source: Shiller (2013)
Table 1. Bull Markets since 1871 – Statistics

Source: Shiller (2013)
It’s troubling enough that the current bull market has already delivered 85% of the gains, and lasted about as long, as the median historical bull market. More disconcerting still is the fact that, when the bear market comes, as Chart 2. and Table 2. demonstrate, it is likely to wipe out 38% of all prior gains. And this has profound mathematical implications for current equity investors.
Chart 2. Bear Markets since 1871

Source: Shiller (2013)
Table 2. Bear Markets since 1871 – Statistics

Source: Shiller (2013)
Portfolio growth is governed by the mathematics of compounding, which means that, for example, a 100% gain is erased by a 50% loss, and a 50% loss requires a 100% gain to get back to even. Applying the same principles to where we are in the current bull/bear cycle is illuminating.
If we assume that the next bear market will deliver losses in-line with what we have experienced from bear markets through history, then….”
If you enjoy the content at iBankCoin, please follow us on Twitter
