iBankCoin
Home / Tag Archives: SPY (page 3)

Tag Archives: SPY

Bat-Damned: A Portent of Doom Is Confirmed

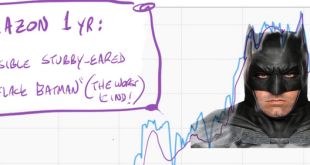
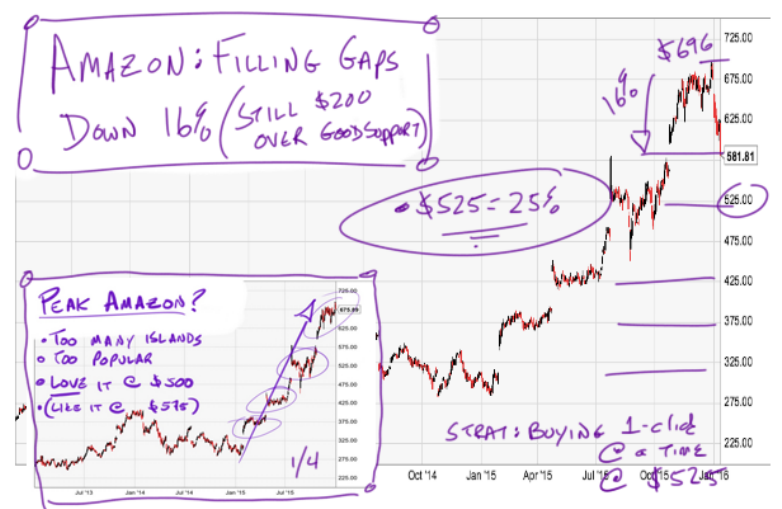
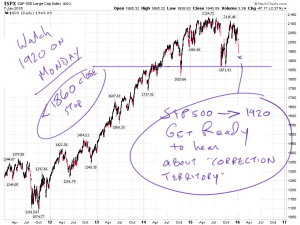
Yesterday I said Amazon’s chart was forming a “Brooding Affleck Batman; the worst kind!“.

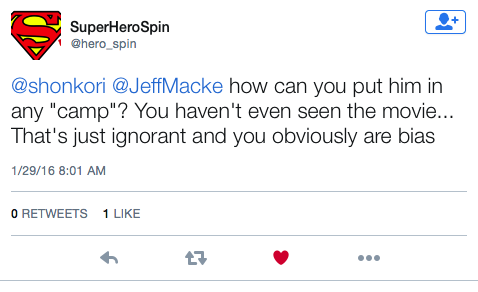
Because this is the Internet someone had to take this the wrong way and start whining. In this case that was awesome because what the person was upset about had nothing to do with Amazon or stocks at all. @Hero_Spin on Twitter was upset at me for besmirching the reputation of the upcoming Batman vs. Superman: Dawn of Justice movie.

Screen Shot 2016-01-30 at 11.52.52 AM


This gave me the rare opportunity to mix film and stocks while using my basso profondo “I’m Batman” hiss for the voice of my inner monologue. I was an accidental film studies and Psych dual major in college. I unwittingly took all the required electives required for a degree, just because I love movies.

I also happen to already have a theory about the length of Batman’s ears and the economy.

@Hero_Spin tugged on the wrong guy’s cape, is what I’m saying.

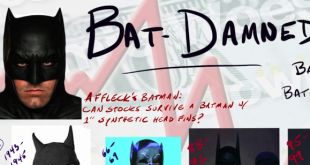
First I’ll pre-review the film then I”ll share single most important scientific discovery since Calculus: the Batman Ear Indicator.

The Movie

Screen Shot 2016-01-30 at 11.56.49 AM

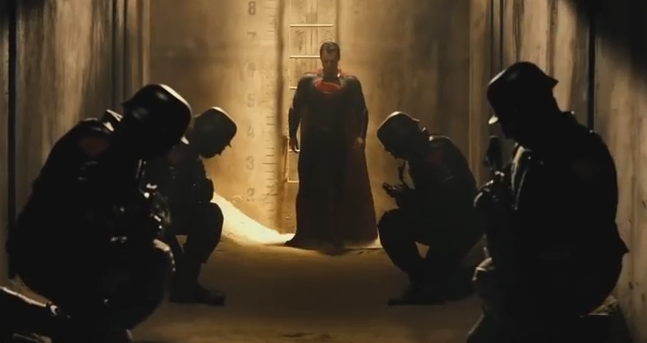
Screw Superman. Just as a blanket statement. No one likes him. And enough with the Nazi Propaganda visuals. This is a comic book movie. It shouldn’t have the same score as Schindler’s List. Based on the trailers, DC’s twist on the Avengers was to take out the jokes but keep the training staff and pharmacists.

image

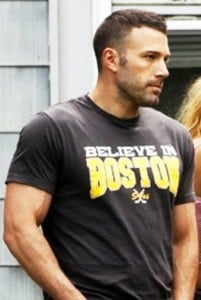
No judgements. He looks great. Affleck’s real Batman body looks like the suit they made George Clooney wear. Ben looks like a professional wrestler delivering a promo in the cuts of him as Bruce Wayne. I’m good with that but let us be clear:  The only way a guy in his 40s can replace 30lbs of dad body with muscle is through both insanely hard work and a wife suffering from human growth hormone deficiency. Finding a Low-T friendly doctor would help as well.

I love Affleck’s movies, for the most part. He’s somehow underrated despite a monster career. But this isn’t his movie. He shares it with Superman and Wonder Woman and the guy who played Zuckerberg and who knows what else. This thing has train-wreck written all over it.

Oh, I’ll go see Ben Affleck as Batman in this ponderous, overwrought piece of garbage, @Hero_Spin. I’ll probably even enjoy it. But don’t tell me it’s good.

Which brings me to the theory:

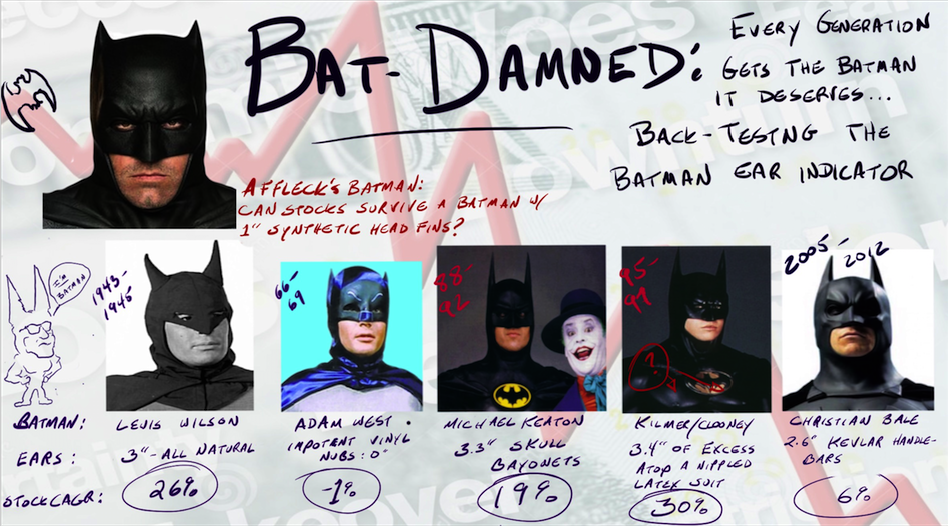
The Length of Batman’s Ears is Correlated to Future Stock Market Returns

Art reflects the values of the generation that produces it. Just as we build the most garish buildings during times of peak mania, the super heroes which resonate with an era express the values and desires of their day. Batman’s ears are the mercury in phallic thermometers measuring the heat of our national ambition. They are economic indicators.

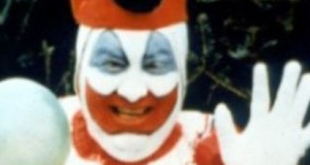
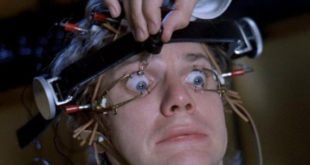
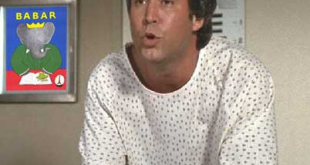
Which broadly fits if you work backwards from the 1960’s being the nadir of recent existence for both America and Batman. Vietnam. Race riots. Assassinations. And, starting in 1966 just in time for a bear market, the world was introduced to this:

Screen Shot 2016-01-30 at 12.36.38 PM


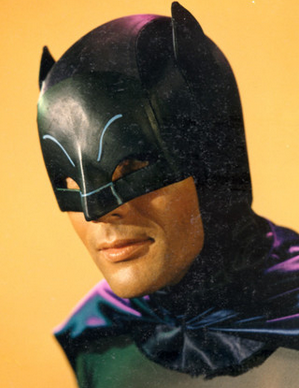
Stocks fell 22% over 8 wrenching months.

This morning my son and I watched Keaton Batman while I calculated the length of every major television and cinematic Batman’s ears, relative to his skull. I then ran stock market returns during each of the 5-distinct Batman reigns.

As it turns out, the Batman Ear Length Indicator is a balls-on stock market tell for 80 years. The longer Batman’s ears are the better the stock market during the period. Note I’m not talking art. Just size. The most bullish Batman was Joel Schumacher’s nipped Clooney / Kilmer outfits, with their ears like stout Viking horns. Perfect for a run of 30% CAGR in Bill Clinton’s America.

That’s not a trading call. Trading based on Batman’s ears would be insane. Yet it is fact. It’s also fact that Batman vs. Superman hits theaters March 25th. Do with that information what you will.

Screen Shot 2016-01-30 at 12.39.20 PM


Comments »

Amazon Destroyed! What You Need to Know $AMZN

As I suspected might happen, Amazon shares are being clubbed mercilessly after the company missed Q4 estimates and issued laughably broad guidance.

Amazon stock is down about 10% early and the chart is frankly sort of ugly. There’s a combination head and shoulders / Brooding Affleck Batman (the worst kind) forming. Yesterday’s rally was a cruel trap, driving shares into weak hands. There’s some support on Batman’s shoulder but the current shareholder base most likely gets scared out lower.

image

Is it a buy? If you’re patient but you have to understand what that means with Amazon. Yesterday I showed a chart of Amazon stock pullbacks over the last 10 years. Her’s what the long-term looks like (hide the women and children):

image

To capture Amazon’s gains you’ve have to ride it out periods like the 95% spelunking after the dot-com bubble burst. Doing so is all but impossible for most investors. Investors with stomachs made of iron (or who were lucky enough to forget about owning the stock entirely) have been insanely well rewarded for their faith:

image


Amazon Has One Job

In many ways last night was quintessential Amazon. The company demonstrated total disregard for short-term planning in favor of growing the business. They don’t care about anything except customers. They never have. This tunnel vision often creates a cultural divide between execs and analysts during conference calls.

Here for instance is CFO Brian Olsavsky on what’s happening in China:

image

To me that’s a perfect response. Every retail CFO should have exactly the same answer. As for estimates, Olsavsky cautioned that nuanced predictions of even the ongoing quarter are “impossible” then said Amazon will earn somewhere between $100 million and $700 million in Q1 versus $255 million last year. That puts the earnings growth rate for this quarter at somewhere between -60% and 155%. Best of luck plugging that into a spread sheet.

Amazon’s indifferent approach to guidance should have been exactly in line with expectations. Amazon has done precisely the same thing literally every quarter since its IPO. Here’s a clip from the Amazon S-1 in 1997:

image

20 years ago Amazon set the goals of “(i) Extending its brand position (ii) Provide its customers with outstanding value and a superior shopping experience” then says achieving those goals will incur “substantial operating losses for the foreseeable future”.

Amazon has spent 20 years living up to that vision. Anyone who was surprised by the quarter or that Amazon is going to spend billions killing the shipping industry because same day shipping is the future (and Amazon is already doing it in 25 markets) simply hasn’t been paying attention.

Amazon is like the Grateful Dead or Opera. You either get it or you don’t. Even if you love it, and I freaking Love Amazon, you don’t need to be there all the time. I’ve been out of Amazon for a while but I’m looking to start to nibble. In other words, I’m following the plan I laid out at at the beginning of the year (from Jan 4):

Facebook

If not I’ll wait. They’ll be back.

Value-Trap?

The quarter was fantastic as far as I was concerned. North America revenue grew 24% to $21.5b in the fourth quarter. For the sake of comparison, Amazon started this year with about the same top-line as Target. Target is expected to do $21.9b total in Q4 which represents a growth rate of ~0% (zero percent).

Amazon gets a lot of abuse for being over-valued. Some of that is deserved and some is because Amazon is often covered by tech analysts who typically don’t know (or care to know) much about retail. Let me put Amazon’s US growth into context. The NRF says holiday retail sales grew a meh 3% in 2015. Online grew about 9%. Again, Amazon grew 24% year over year just in North America. Of the top-10 mass merchants in the country CostCo has the next fastest top line expansion. For the Holiday quarter Cost might grow 5%.

Amazon is playing a different game than the rest of the industry. There is no “correct” valuation for Amazon because nothing like this has ever existed. No retailer has ever been this big relative to the industry and still growing anywhere near this fast. Amazon’s numbers look like young Gretzky getting 200 points in one NHL season or Barry Bond’s “Big Head Era” stats. That’s just as a retailer. No one on earth knows what AWS could be worth but it’s a lot.

Amazon makes money. Not much but remember even really good US retailers are only netting 6 or 7 cents of profit on every dollar. Between breaking even while sucking up billions of dollars in market share a year or grinding out 5% growth and net margins I’ll take the former. Any valuation work beyond that is just doodling.

If you get a 50% pullback back up the truck. Anything less than that is almost noise as far as Amazon sees the world.


Comments »

Rally Hats! $SPX Price Targets

On Wednesday with the world crashing down upon our heads I wrote:

Screen Shot 2016-01-22 at 5.32.04 AM

For those of you who question God, the Plunge Protection Team or both I offer once again the full day chart:

Greatest Comeback since the first Easter


40 S&P handles in 3 hours Wednesday afternoon. At the highs yesterday near 1890 the S&P500’s market cap had increased a cool $700 billion in 24-hours, give or take (100 S&P500 points is roughly equal to $890b). The consensus explanation (mocked in real time here) was ECB Capo Mario Draghi muttering something about Europe being open to the idea of additional stimulus.

In case I haven’t been clear on this point it’s ok to go ahead and assume every Central Bank on earth is going to do everything they can to keep their personal empires from crumbling. You can call it a conspiracy. I tend to think the explanation is far more simple. No one wants to go down in history as Nero or even Herbert Hoover*. Spending more of other people’s money to avoid such a fate is a small price to pay.

The idea of some Ayn Rand world where the government allows crashes to unfold “naturally” is crap. It’s the expression of a dream where everyone is John Galt and we all make our own roads, deliver our own mail and fight to the death for the natural spoils of earth.

Governments always intervene. If you expect them to stop because it doesn’t work you’re either insane or selling a newsletter.

Stocks already knew Draghi was ready to spend money he doesn’t have. Keep it simple. The market rallied because Bear markets are hard and the bears over-reached. Don’t dwell. Set targets.


Special Guest: Leonardo Fibonacci!

Fibonacci was the greatest mathematician of the Dark Ages. Dead for nearly 800 years, his theory of natural patterns is still used on a daily basis in trading pits. That wasn’t Fibonacci’s original intent but he’s been dead far too long to get a vote.

Per Leo as understood by traders, bear market rallies tend to retrace specific percentages of recent losses. Most notable among these levels for our purposes are .62 and .38. In this case I used the peak of 2080 on December 29th and the lows of 1812 for a total drop of 268pts. 38% retracement works out to about 1915-1920 (also the “official correction” level). 62% works to 1980.

Screen Shot 2016-01-22 at 5.29.36 AM

You can read about the details elsewhere.

For our purposes know this:

  • Not even Leo sets this stuff in stone. He was just a mathematician with odd taste in hats, not Moses. 1920 makes sense as a target but any idea that’s 800 years old is to be considered at least as much art as science.
  • Unless or until the above levels are recovered this rally is to be considered more a bounce than bottom.
  • We are still reliant on crude and China but going into the meat of US earnings season will be a useful distraction. Things just aren’t that bad in the US. If you want to add “yet” to that observation go ahead but it’s not a great trade.
  • 1850 is a great stop but it won’t save you on a gap lower. Just know a close below that level is still toxic to bulls.
  • Finally, and this is absolutely the last time I’ll reference myself this morning, I promise, screaming rallies are perfectly normal in literally every bear market in history. One last time consider the list of biggest intraday moves in history and note the Fall 2008 rallies. Citi was up 24% the day the SEC banned short-selling banks. To this day C is still down 90% from pre-crash peaks.
  • Nothing is over until Leo decides it is..

Screen-Shot-2016-01-05-at-5.55.33-AM

* Both Nero and Hoover got a bum rap. We can discuss another time.

Comments »

Crash! Nowhere to Hide.

I’m not here to lie to you.

We’re pretty screwed.

As I type we’re at 1817 on the S&P500. That’s below the neckline of a huge head and shoulders pattern. It doesn’t matter how you personally feel about charts. Incremental selling will be done unless by some hand of God and the Plunge Protection Team we close back above 1850.


Screen Shot 2016-01-20 at 7.22.13 AM


In just a couple weeks the market has been kind enough to offer me grist for a brief course in Macke’s Personal Rules for Sell-Offs:

Here’s the core problem with Crude and Currency going crazy, boiled down as far as I can rend it, and why it might lead to the Worst. Year. Ever.

I think there’s a massive underlying problem with balance sheets. Cash has been thrown away buying back shares instead of making improvements in core operations. Both at Macy’s and IBM. Watch for this to become a bigger issue as margins get tighter and all that “cheap” debt becomes more expensive.

Here’s a Crash Survival Guide and some case studies of past misery.

None of which matters because China Has Us By the Balls.


Which reminds me of a story. Two guys are camping. They get hammered and leave some meat sitting out overnight. In the morning a bear is ripping open their tent.

While one guy frantically smacks the bear with a lantern he notices his friend lacing up his shoes.

“You idiot! You can’t outrun a bear!” screams the fighter as fangs sink into his hand.

“I don’t have to outrun the bear” replies the second camper. “I just have to outrun you”.

Point: Don’t try to make money here. Let other people lose money. Then we’ll pick through the scraps.


Stocks are collapsing as I type. My thoughts remain these:

  • The S&P500 needs to close above 1850
  • It doesn’t really matter where we close because the market is broken. No one will buy stocks when they can wake up to this type of selling every day.
  • This isn’t the time to learn how to short.
  • If you know how to short, I’m not going to tell you your business. But I will point out that the hugest, angriest, face-rippiest rallies happen in Bear markets. Consider the Fall of 2008:

Screen-Shot-2016-01-05-at-5.55.33-AM


  • Bear markets kill everyone. 99% of investors should be liquid enough to not have night terrors. I’m serious. If you can’t sleep you’re going to puke up your whole portfolio at the exact bottom.
  • Respect the Panic. My show is called Panic out of respect, not advice. Sir Isaac Newton blew up investing in stocks. Really. Sir Isaac Newton was super, duper smart.
  • There will be opportunity. It will come. I like a lot of individual stocks at their August lows (Come to me at $72, Facebook).
  • No one knows anything. I’ve done this professionally for 2 decades. I know as much as anyone who will talk to you right now, on TV or in print, and I don’t know shit.
  • This market is a human flesh thresher turned up to 11. Just back away from it and wait.

Comments »

Buybacks Blow-up Macy’s. Psycho Mkt $M $SPX

S&P500: A Genuinely terrible chart…


There was a little bounce on Friday. Which is to say we didn’t close on the lows.

The bullish scenario is we’re oversold, sentiment is “wetting myself” and it wouldn’t be a bear market if it didn’t squeeze the hell out of bears every once in a while. We’re down 10% in a straight line. That doesn’t mean tomorrow is “due” to move higher. That’s not how odds work.

Market days are independent, for betting purposes. Like a roulette table. Sharp reversals can and do occur within larger trends but by definition they have to be random.

A face-ripping, explosion of a rally is coming but there aren’t any cheap ways to wager on it. Calls are still expensive. Stocks aren’t cheap, or even possible to value, in theory until oil stabilizes AND China gets done having to kick traders in the ass with jackboots to get them to buy stocks in the Shanghai Comp ($SSEC). (see: China Has Us By the Wontons).

Head and shoulders, only scarier...
Head and shoulders, only scarier…


You want to get long ordinary stocks? Yeah. All bullshit aside. It’s a terrible stock market. That’s an awful chart, even without the monster.

Buybacks Bite

The fundamentals are just as bad. I’ve been doing some work on buybacks. To bring you up to speed; companies have borrowing a lot of money to buy back shares. Corporations aren’t stockpiling cash, at least not in the US. They’ve levered up to inflate short term EPS. Leverage taken on to do buybacks is about to be a Big Freaking Deal. Other folks have noticed this (a couple in the comment section). It’s very bad.

Buybacks are this era’s Greenmail. Just a different way for activists to generate short term performance. They work in up cycles. As long-term plans buybacks are a short-sighted, indefensibly cynical allocation of capital to appease hedge funds. Since this opinion runs contrary to the Word of Saint Buffett of Omaha I’ve taken endless abuse for  mocking buybacks of the last few years.

I’m about to be right in a huge way. Which sort of sucks.

Ive been looking at these things all weekend. I’ll use Macy’s as an example but they’re far from alone

Here’s what Macy’s has done in buybacks since 2011:

Screen Shot 2016-01-18 at 7.34.01 AM


Forgive my handwriting.  It’s a little sloppy. I’ve been looking at this stuff since 2am.

The scribbling says Macy’s spent $7.2b buying 148.1 million shares at an average of $48.54 from 2011 through last October 15. The stock is down 50% in 6 months, well below $40.

Some very basic accounting: Repurchased shares aren’t “bought and held”. They are retired to reduce the share count. Effectively the shares, and money spent on them are just lit on fire.

Because all repurchased shares go to zero (with the weird approval of investors) it technically doesn’t matter that Macy’s would be down $1.6b on its Macy’s position of repurchased shares. Again, if they had any value at all. That’s a loss of 22% against a 45% gain in the S&P500. Buybacks are tantamount to a group of executives running a hedge fund that buys only one stock, on which it has limitless inside information and Macy’s lost 22%.

The simple numerical fact of this makes the idea that buybacks “are an expression of confidence” laughably obtuse. When a buddy brags about his kid being a great athlete do you take him at face value? Of course not. CEOs always like their chances. That’s what makes them good CEOs. It also makes them shitty stock pickers.

Like most companies Macy’s always thinks its own stock is a buy. In the short term, buybacks boost earnings per share, often triggering CEO bonuses and delighting activists! For a while

It’s a predictable sequence

For a while EPS looks awesome because of the share reduction but net income lags. The whole time enterprise value is erodes. Long-term investors get a bigger chunk of a lesser business and no cash at all. Then the earnings (orange line) rolls over and takes the stock with it:

Screen Shot 2016-01-18 at 8.20.26 AM

Oh yeah. “Money is returned to shareholders!”

(Dispense with this quickly: When Wall Street tells you it’s giving you cash and you don’t see any money in your hand you’ve been had.)

Debt is a cruel mistress.

Retail is an insanely low margin business that requires constant investment. Macy’s has a 4.9% net margin. So when Macy’s borrows $500,000,000 at 3.7% to buy back stock it sounds cheap but it’s just about the company’s entire margin on $500,000,000 in sales in a growing economy.

Bookie or banker, loan givers don’t care about your personal problems. “No winter so coats didn’t sell? Screw you, give me my money. Bought your own shares at $50 and now you don’t have the shares or the cash? TS, give me my money.”

Now business has turned down, stores haven’t gotten any attention. Activists are prodding mercilessly. Macy’s is sitting on billions of dollars in winter coats in some sort of monumental inventory screw up that we’ll never know the full story on. Seriously, they could do hands across America tying coat sleeves together. It’s insane.

Oh yeah, Macy’s is on credit watch.

So earnings, both on a net and per share basis are going to end up much, much lower than expected. Shareholders have no cash. Macy’s has no cash. They just have 80% of the world’s down and impatient bankers.

The activists have the cash. Because they sold their shares to Macy’s and the rest of the muppets.

Macy’s and its shareholders have been conned. Everyone buying into buybacks has been. Corporate America borrowed cheap and bought itself. According to FactSet as of Q3 180 S&P500 companies have spent more on buybacks than they’ve earned in the last 12 months.

It’s not a story across the whole market yet. It will be.

Comments »

Grim Technical Indicators

On the opening trading day of 2016 I suggested making some charts to take the emotion out of the then-looming crash.

For those of you who’ve been understandably avoiding your portfolio, the crash is here. At least it for some stocks it is (RIP: GoPro).

As I type futures are higher but yesterday started strong and ended in tears. Bear markets, and we are in a bear market, don’t so much have “trends” as thrashing convulsions. Deal with these things as one would an enormous living fish in the bottom of a canoe. It’s caught you as much as you’ve caught it. Caution is advised.

Here are some charts from earlier this year, updated to represent the ongoing nightmare. Back later. Try not to rock the boat…

S&P500: Support at 1860 is too obvious… Headed for 1,700?

1708 is an official Bear Market. If you wait for someone on TV to tell you when a bear market has started you’re going to end up in the Bear’s stomach. I’m telling you it’s a Bear. I’m as qualified as anyone.

The dreaded John Wayne Gacy's Basement formation...
The dreaded John Wayne Gacy’s Basement formation…


Amazon: Filling gaps, as it does…

“Peak Amazon” was pretty good, as graph titles go. Shares are off 16%. History suggests about $525 is a decent spot to start building positions.

Amazon: Overloved
Amazon: Overloved


Amazon crashes all the time


Apple: Honk if you’ve lowered your Q4 iPhone estimates!


Screen Shot 2016-01-14 at 4.51.50 AM


Rough Day for Facebook

Screen Shot 2016-01-14 at 5.08.59 AM


Twitter is like GoPro without the cool cameras… (Yes, I’m still long)

Screen Shot 2016-01-14 at 5.14.15 AM

The Red Menace at Summer Lows

Screen Shot 2016-01-14 at 5.00.40 AM

Comments »

Sell-Off! Welcome to Crazytown

No need to update this morning’s chart. It’ll be out of date by the time you see it, anyway, given that stocks are falling about 1pt every 20-seconds.

As of this instant the S&P500 is 60pts off the highs of the day at around 1890. I would expect (but am not betting on) stocks regaining 1900 by the close.

At 1870 I am a buyer in some size of equities across the board. Sell-offs are about emotion. If bear markets went down in a straight line they wouldn’t be at all scary. You could just short everything. There is going to be a hellaciously vigorous rally very soon. The question is whether it’s from here or 10% lower.

Today is the first day I’ve heard (felt) real concern from the bulls. That’s the start of a bottom.

Earlier this week I said the time to buy would be when getting long felt completely insane. Being a contrarian is overrated but there’s a 20-minute wait to buy a PowerBall ticket but it would take a nanosecond to get filled on $250,000 worth of Amazon $100 lower than where it was 2 weeks ago.

It’s time to start getting constructive on stocks.


Probe
Probe

Comments »

Don’t Get Cute: Trading the $SPX

There’s a science to cute. It’s all about ratios and proportions.

The picture below is scientifically cute. If you disagree you’re a psychopath. Trust me, I was a Psych major.

Screen Shot 2016-01-13 at 5.38.36 AM

Cute isn’t for everyone. You can choose to ignore it entirely but its existence is undeniable.

Which brings us to the S&P 500. On December 29th it closed at 2078. Last Friday stocks closed at 1922 and on Monday they probed lower before ending the day up 1pt at 1923. Yesterday we closed at 1938:

Stuck in the middle
Stuck in the middle

Here’s where it gets adorable. The Book of Trading says this rally-lette will hit resistance at 1981 (38.2% retracement) and again at 2017 (61.8%). Those are almost exactly the levels we’ve been dealing with for almost 6 months.

Here’s a chart from mid-September, highlighting support at 1989 (the title of Taylor Swift’s album… hence the picture):

Screen Shot 2016-01-13 at 6.13.42 AM

A month later we broke out above resistance at 2020 (the exact high from Yellen’s September presser):

Screen Shot 2016-01-13 at 6.13.20 AM
Mid-October’s short-lived Breakout Set-up

As of today’s open the S&P 500 is almost exactly in the middle between resistance at 1980 and 2020 and support at 1900 and 1860. The trading risk-reward set-up on a strictly technical basis is ~4% potential upside and ~4% downside. That’s a cute trade, so called because you can play with it all day but ultimately it’s a lot of work and very expensive. Just like a baby.

There are times to go for the jugular on a macro trading call. This isn’t one of those times. If you’re day-trading the $SPY you’ve got a chart with no clear direction and the crazy Chinese hanging over your head like the Sword of Damocles. Everything in the range is pretty much random as far as traders are concerned. A 30pt move in the S&P500 today would mean nothing for tomorrow.

It’s less expensive to play PowerBall for $2 than trade noise for real money.

If you want to get cute, lean long with a 1895 stop. If you want to stay sane stick with the positions you like on a fundamental basis and stop betting on market static.

Comments »

Brace for a Monday Probe

Stocks don’t bottom on Fridays.

That’s almost literally true. Sell-offs larger than 5% have made lows on a Friday twice in the last 15 years.

Key Levels: 1920 on the S&P 500 is a 10% correction. 1865-1870 is a double bottom from August and October.

Make your list of buys over the weekend. The bottom will come when buying stocks seems completely insane.


Screen Shot 2016-01-08 at 12.25.36 PM

Comments »