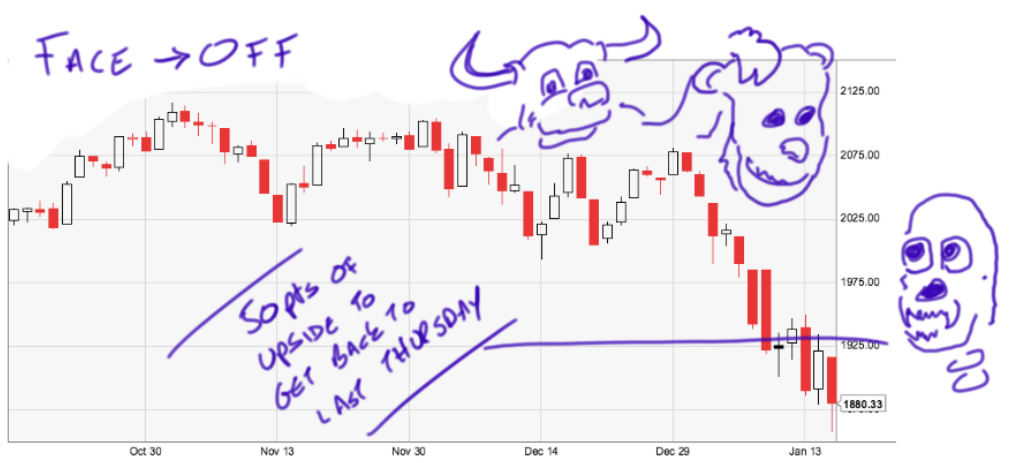
Reminder: The S&P500 was 1934 last Thursday.
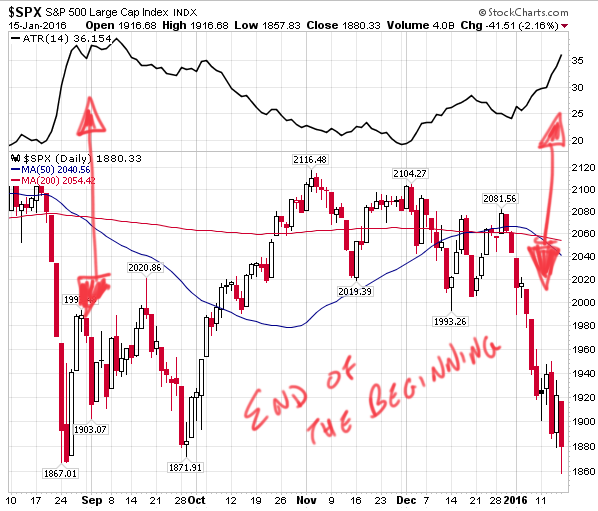
Today makes 3 straight trading days of chaos. One of the indicators I like to watch is the Average True Range (ATR). It’s simply a measure of how much a market is moving, from top to bottom, on an intraday level.
Anything over 1% is unusual. Right now it’s at almost exactly 2%. As you can see from a 6 month chart, it doesn’t mean we’ve bottomed but it’s a start. Bull markets trade in smaller ranges.
Video with more thoughts up shortly. Be cool out there…
If you enjoy the content at iBankCoin, please follow us on Twitter

Hi Jeff, thanks for posting this. Quick question, what are you comparing the over 1% move to in your ATR? Are you saying that any move higher than 1% from the previous day is unusual? Thanks for clearing this up.
ATR is the 14 day average of actual trades made during a day (so it takes out gap opens). A bull market is more predictable… so smaller trading ranges. A chaotic state is unsustainable (and usually bearish).
Today has been higher by more than 1% and now we just went red. That reflects a ton of uncertainty. I don’t want to make too much of this one indicator bc it tends to be a coincident indicator. Meaning the range will move lower in synch with stocks recovering. I use the ATR as a double-check indicator.
Just trying to give folks as many tools as possible.
That makes sense; always important to be able to tell a story, not just say what you see. As usual, I appreciate the response and insight.