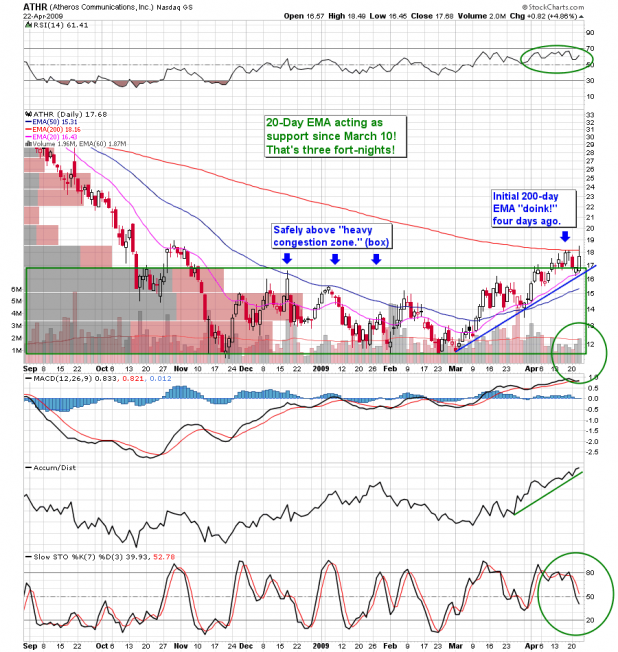
Just a little later night study. Fly put me on to this Atheros Communications (NASD: ATHR) tonight as he likes it for the various 4G and blue-tusked wireless affrontery he’s been on about for days now. For myself, I just liked the stock symbol, which put me into mind of the Holy Grail scene from above with the Karl Marx God. I figured that was a fair enough trade off to have a look, at least.
Anyway, you can see my annotations. This bugger has been testing the 200-day for about four days now, and may actually get a nice rip above it with all the great rejoicing we heard tonight regarding the bigger techs. Tomorrow should tell the tale, one way or another, I should think.
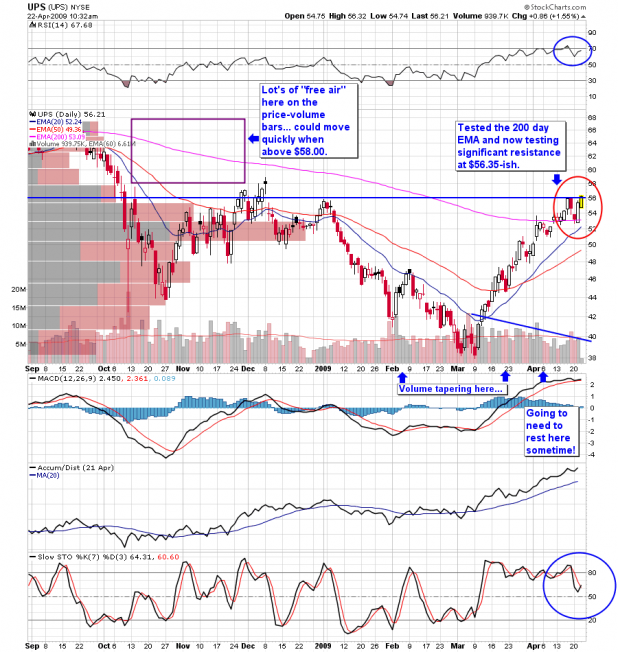
First, let’s be clear that I don’t consider United Parcel Service (NYSE:UPS) a Jacksonian Holding, although for other reasons I’ve got enough of it in my portfolio that I have to keep a sharp eye on it. I do consider the name, however, to be a great market tell for a couple of reasons. First, it’s one of the core (and largest by market cap) names in the Dow Transportation Index, called sportingly about these parts “the Trannies.” Second, as the number one shipper of packages (by far) in the U.S., it’s a great gauge of direct-to-home and business-to-business product transfers. This is increasingly important given the ubiquity of internet commerce in these modern times. Last, as one of the last supporting pillars of the Teamsters Union (heaven help me), UPS gives a decent insight into the relative power of Labor in the market place.
In regard to UPS being a core of the transports index, Basic Dow Theory tells us “the Transports lead” and that hoary theory, ginned up over 110 years ago, was what got me out of the market by Thanksgiving of 2007. There’s a lot of common sense to “transports lead” as even today, an economy is measured by the amount of products and inventories being carried by trucks, trains, and air freighters. Much like the Baltic Dry Index, the Transportation Index ($TRAN) gives us an idea of how healthy the economy is looking from a market standpoint. As a result, if the Transports are rising, or flagging, you can be reasonably assured the rest of the market will be close behind. Since I consider UPS to be “the leading edge” of the Trannies, I think we can get an even sooner tell on the market by studying its price movement.
That leads us to our UPS daily chart, which has “Vee’d” almost directly north since our March low:
As much as UPS’s recent rise been good for the port, I really think this sucker needs a rest here, and it may get one very soon. Note the resistance we are hitting here at $56.35 or so? (Note: As of this writing we are at $56.72!) If we can lift off above that on volume, we may have a “next phase” of this mini-bull in hand. As you can see, north of $58.00, UPS has a lot of “free air” where there was not much trading (see the price-volume bars to the left for confirmation). If she can move above there, we should see some clear sailing all the way to $67.50, or almost ten buck higher.
That said, I do expect a rest here, and I am hedging my portfolio by selling some UPS May calls here. We’ll see what we shall see. Right now, we are above my mentioned resistance line, but below the “free air” at $58.00 … stay tuned!
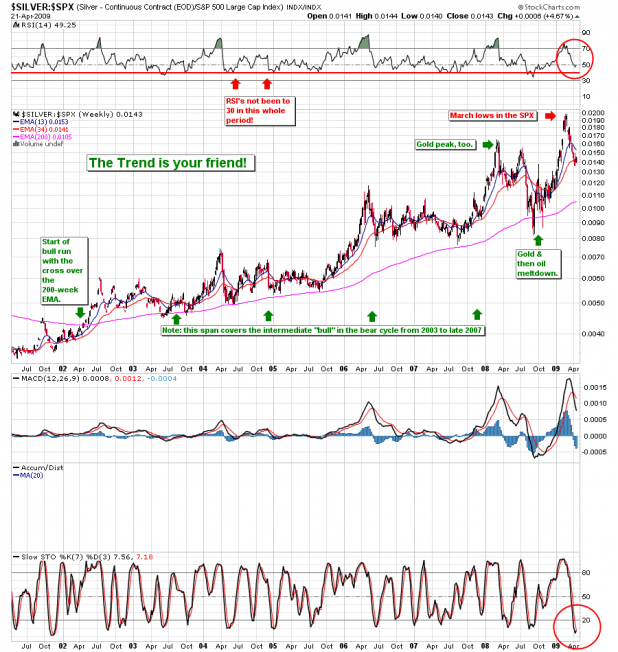
A reader asked me about Silver Wheaton (SLW) on the pull-back today, so I figured I’d take a second to show you why I like silver here for the “secular bear run.” Let’s start out with an interesting chart {$SILVER:$SPX} which plots silver against the S&P 500 since the start of the dot-com meltdown:
As you can see, silver has been on a bull run since about April of 2002, when it crossed over the 200-week moving average. Even through the subsequent four year bull cycle of 2003-2007, it continued to outperform the S&P 500 on a trending basis. What’s more, this ratio has never become oversold on an RSI basis (below 30), with only two trips in that period below 40. The ratio is also showing a possible turn (vs. the $SPX) on the slow stochastic as well. Silver is also cheap compared to gold, with gold currently priced at 73 times the price of silver (as of 3:00 today). The traditional “classic” gold/silver ratio was that held from the 17th to the 19th centuries was 16 times, and in 1980 the ratio at their respective heights was about 17 x, when silver spiked to $48 an oz, and gold to $850. Inflation adjusted, we’d need to get back to $129 and $2,200 an oz. respectively to re-acquire those heights. At double the 16 ratio (ie, 32x), however silver would still trade at almost $28 an oz. even with gold remaining at it’s current price!
Now to a silver mining stock dear to my heart. Let’s face it, most publicly traded silver mining companies are run by inbred families of feuding Romanian dwarves more interested in “Friday Night Rasslin'” and trading silver shaving for Natural Light 30-packs than they are those boring “balance sheets” and “income statements.” As a result most silver mining companies tend to frustrate investors even in good times for precious metals.
Silver Wheaton is different. It’s run by the same cockney Canuckistanian cads that brought us Wheaton River Gold, the successful gold startup that eventually took over Goldcorp (GG). The Wheaton River Gold guys have done what they’ve said they’d do now for almost ten years running, which in precious metal mining circles is the equivalent of a weekend full of “36, Winnah!”s on the roulette wheel in Vegas. It so much doesn’t happen that I’m researching the theory that they are in fact, Raelians sent to make those of us worthy enough (and who purchase the proper sneakers), rich. Ack! Ack! Ack-Ack!
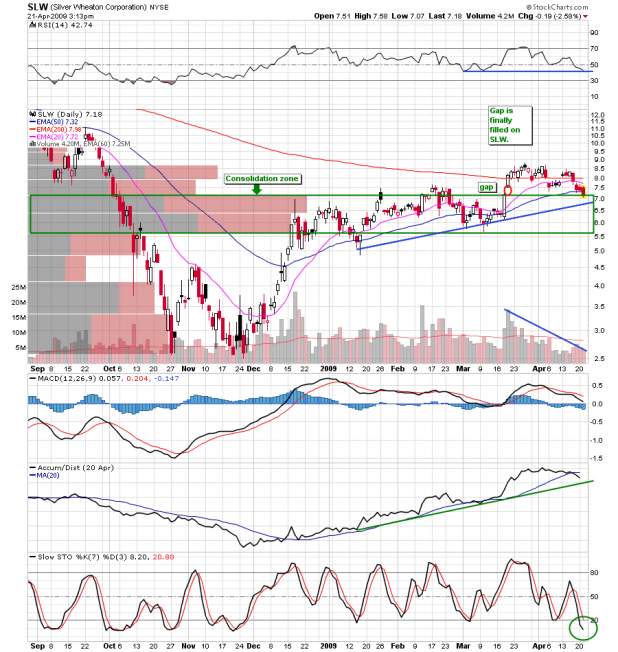
See the annotated chart below — where SLW has finally filled that gap that’s been driving me crazy for weeks:
CAUTION! Investing in Precious metal miners is NOT for the faint of heart. While I think that SLW and PAAS are two of the best out there, that’s like saying I find the Phillipino black mamba and the South Rhodesian Stuttering Asp the most appealing of deadly poisonous snakes. I recommend a basket of miners in both gold and silver, as well as a core position in SLV and GLD, and the “fizzical” metals themselves. These are shelters in the storm, but they must also be watched. Build positions judiciously, and sloooowly. I will go over additional miners as we move forward with the Silver Surfer. Best to you all.
Some of you treat the market like she’s the buxom head cheerleader at your junior high who has finally deigned to give you that “one shot” date for which you have been hounding her for weeks and –damnit — you are going to make that “one shot” count!
But you know what happens… “Mr. Smoove” gets a little too hasty and that “one shot” devolves into an embarrassing “fail episode” which necessitates a “strangely soiled jeans” story for Mom on Laundry Day. That’s never good for the psyche.
However, neither is getting hasty with the ever enticing Ms. Market good for your long term mental health. Take iBC’s very own “Exhibit A“: our friend the Hell Hound. Be cautioned, friend– too many hasty market calls and you too could find yourself warily napping in a tin foil sleeping bag.
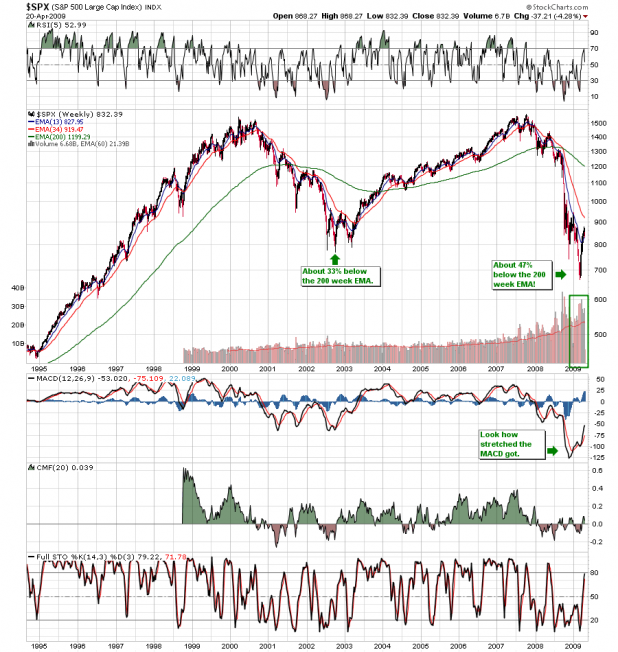
So instead of racing off to go do something ungodly after this 90% down day we had yesterday, why not take a gander at something I like to call my “Perspective Chart” —
Here I go again with my “reversion to the mean” theme. Note the contrast between the “normal” bear low’s distance from its 200-day EMA in 2002, and that of the recent low we just experienced in early March. Quite a bit more stretched, isn’t it? That’s what gave us our violent “snapback” we’ve been experiencing for the last number of weeks. The market will revert to the mean, that’s just what it does. And the more stretched out it becomes going away, the harder it will careen back. After that massive plunge illustrated above, can we be dead sure this market’s done careening?
And let’s be open-minded and admit it — today may have marked a new rollover point… or not. 90% down days like today are more often followed by at least temporary reversals, or frustrating grind days. My point is your best bet here is to do as Fly has cautioned — hold fire a moment while you wait to see if you’ve a better place to short.
I’d be surprised if you did not find one at a point higher than today’s close, and maybe even when we meet the 34-week EMA in the low 900’s. For downside, I’m looking for support at the 13-week EMA — 828, and then 800.
**************
Hopefully some silver and gold talk tomorrow. FYI — I mentioned on the comments I had bot some more RGLD last week. Well I also added another 20% to my SLW position at the close today, and will be looking hard at PAAS and GDX tomorrow. Stay tuned and be well.
From time to time I’m going to bring up holdings that I consider “core” to the Jacksonian Survival Strategy (TM). These positions, I hope, will be your ports in the storm for the coming (continuing?) rough seas.
… seek(ing) daily investment results, before fees and expenses and interest income earned on cash and financial instruments, that correspond to twice (200%) the inverse (opposite) of the daily performance of the Barclays Capital 20+ Year U.S. Treasury Index.
One of the basic theses of my Jacksoniananalysis is that the Federal Reserve and its supervisory Congresses will eventually destroy the functional markets they’re charged to protect by repeatedly choosing the politically easy route over that of longer term system-wide financial integrity. Consider that the last truly “hard choice” taken by the Fed was back in the early eighties when Chairman Paul Volcker brought the Fed Funds rate to 20% in the summer of 1981 — which in itself was a hail Mary pass to stave off economy-crushing inflation rates.
The subsequent combination of a “cured” inflation problem, expansionary fiscal policy (read: increasing debt), lowered marginal tax rates, subdued energy prices and — most important– the financial peaking of the largest demographic bubble in this country’s history ignited a 17- year “boom” that culminated in the 2000 market crash and subsequent recession.
In the meantime, the Fed’s answer to any economic trouble remains “continue easing via lower rates.” Unfortunately, the conditions that allowed that solution to work from 1983-2007 (yes, they even worked after the dot-com meltdown), have begun to fall away, as the prosperity cycle gives way to the demographic shift of retiring baby boomers with fewer workers filling in behind them to support increasing government expenditures, not to mention debt service.
Combine that demographic turnover with the results of 22 years of moral hazard (Greenspan’s first “money flood” was a response to the 1987 crash), and we have a recipe for a turn in this aging two and half decade bull in US Treasury paper. Note the following chart (which — my apologies– I could only get Stockcharts to show from 1990) of the 20-year US Treasury Yield:
As you can see, we just had a break of the long term downtrending channel in November of ’08, which coincided with the gigantic selloff in the stock market as money fled to a safe haven. Could this huge breakdown and rebound mark the bottom of our bond bull? You can see that we’re back in the channel again, and have already tested the lower boundary on the monthly chart. As well, we’ve got a Democrat Congress and POTUS, just as we did back in 1993 (see first box), and the Chinese are making noise about buying less U.S. paper and letting the yuan rise (finally) against the dollar. Last, we need to issue more debt in order to pay for this unprecedented “stimulus” spending recently signed into law.
If anything, this bodes well for bond bears in the short term, despite our current “safety haven” status. Let’s see what TLT (Lehman Bros. 20+Year Treasury i-Shares ETF) is telling us:
Note how TLT soared as a result of the first fear induced drop in the stock market? Now notice how it made no such similar move when the market ground down to a lower low? In fact, after a month of increases after the November 21st market lows, TLT peaked on the day after Christmas, and has largely ground lower ever since. This despite a new low on the stock markets. Whether or not the US long bond has been given up as a safe haven we won’t know until we see a decisive break of that fast-approaching 200-day EMA, but I think TLT is telling us something here.
That brings us up to TLT’s double inverse, TBT:
Note the steady accumulation since late December of ’08, even as the MACD took it’s sweet time to eventually turn north again? Now all of our oscillators are telling us similar story. I see TBT as a core holding for the long term here– and I’ve been accumulating it from $50 all the way down to the $37’s — but for our more short term oriented folks, I believe that a break of the above noted “congestion area” will bring us very quickly to the 200-day EMA. This lift-off may even be in conjunction with the rest of the market, as low yields are abandoned for stock market lucre (however fleetingly). We should be watching the TLT 200-day EMA here and our congestion zones. In the meantime, I see TBT as an “accumulation pick” going forward, keeping in mind the usual precautions we should always employ while holding volatile double ETF’s.
More “ports in the storm” to come. Best to you all.