iBankCoin
Joined Oct 26, 2011
153 Blog Posts

Primary Bull Market Remains Intact

In the book Trader Vic there was a chapter on Dow Theory. The author went over some lesser known aspects of early dow theorists.I plan to look this up if I can get around to finding the book when I get a chance to look for it.

From memory, the aspects of importance here are that when declaring a change in the primary trend ALL major indices must agree. It is not enough for the dow to break below the most recent primary low, but all major indices must break these levels.

While the all world index, the dow and the nasdaq and others broke below the October 2014 primary low, the S&P and Russel 2000 did not.

As such, this confusion and “breakdown” could very well be a fakeout. According to this aspect of the early dow theorists, it should NOT be treatet as anything but “primary bull still intact”.

The disagreement by the markets or “divergence” of course can certainly mean EITHER that the other major indicies overreacted to the recent selloff, or that the dow and russel under reacted. One approach is, “when in doubt, stick with the prior trend”.

Another which Vic also advocated was treating the market sort of like an insurance premium. The insurance company should expect that the older a person gets, the more vulnerable they are to a medical problem. Similarly, the older the bull market the more susceptible it should be to declines and economic problems.

However, he also stated that the closer it got to the extreme, the more likely it was to be an “outlier”. It wasn’t really clear how he would treat “outliers”. Would he give up on his thesis of positioning more cautiously after the market entered “outlier” territory”? Would he position more neutral? Would he just remain more vigilant in watching for signs of tops technically? Would he just trade different timeframes and avoid trying to position one way or another for the longer term until it ended?

Nevertheless, he would handicap the duration and magnitude of the move as well as the probability that the moves reached certain thresholds in the primary markets. He also would look at moves in different durations. The moves as an active swing trader would not be classified as the same as a longer term investor who held for years. So a breach of a minor low made in July of 2015 for example would have a different duration, move expectancy and timing approach to the October 2014 low.

If you believe in this theory of examining moves median and mean length and magnitude, you’d probably also enjoy Bulkowski’s Encyclopedia of Chart Patterns, and/or Encyclopedia of Candlestick Charts where he loads it with statistics like this relative to individual patterns on individual stocks rather than studying broad market moves in general like Trader Vic and Trader Vic II.

The main reason I want to pull up a copy of the book out when I get a chance to reexamine these differences between how he defined “swing trader”, “position trader” and “Investor” and the statistics on each move.

Nevertheless, considering the implied volatility of the VIX, the liquidity concerns following brokerage outages and the nature of a fast selloff I’m putting my money on the low holding. I believe that using the criteria of the VIX spike surpassing 2011 highs that the “panic” was filled with over exaggeration rather than under exaggeration. Over exaggeration means we can rebound in all markets and continue the primary bull market with these levels representing the next primary low.

Due to the volume profile of stocks below, if we somehow don’t manage to hold volume profile support at around S&P 1825-1880, I think you can be pretty confident that the last recent primary low will not hold and look to find an entry to the downside; ideally on a rip higher and retest of those support ranges

For those keeping track, I said in the last post that if I had to make a trade when we were in “no man’s land” I’d side on selling premium and selling a call spread. That was because I looked at the volume profiles to define a range that provided the potential for loose and fast action from the range of just north of 205 and just under 190 when at the time SPY was around 200. With changes in price action and support, your position should change as well. I think you can manage a long entry, or sell a put spread as the upside outweighs the downside in terms of price and overall management of the position would provide a positive return on risk. Meanwhile, the VIX is still high so you can profit from a decline in volatility if prices don’t move much.


Comments »

illiquid panic

Last week the volume on the panic was as significant as we’ve seen since the 2011 crash that coincided with a credit downgrade that was later given an “oops, sorry, didn’t mean it” and a debt ceiling battle that was later extended until September 31st.
spy

What’s different about last week is that the VIX actually briefly surpassed the panic highs of 2011 and 2012.
vix

I believe that this can be explained by a lack of liquidity.

Most panics have little liquidity to begin with as people constantly seek a bid to try to identify some buyers from which they can sell and there simply aren’t any buyers that show up.

Option contracts are often theoretically priced according to the Black-Scholes model which says that there is a theoretical amount of volatility that an option is pricing in.

The problem is that option contracts just like the regular market are subject to liquidity. It’s the lack of liquidity in a panic and inability to stress test throughout time at more than a few decades at more significant panics that lead to the collapse of long term capital management in the late 90s following the Russian Bond collapse.

When liquidity declines as the market declines there is greater uncertainty at where the market is actually priced at due to widening bid/ask in the underlying. This makes it difficult for option traders to even determine a theoretical price that they can agree on. The person selling the premium wants to receive more, and the person buying the premium wants it for less. When the market itself is filled with uncertainty on price as well the price of at the money options in this instance was absurdly far apart.

The less participation, the greater of a problem it is and the more susceptible to wild swings in both stocks and options and implied volatility.

The panic last week coincided with brokerage platform outages. The implied volatility OF the VIX or “implied volatility squared” that measures the expected change in the implied volatility was off the charts and even surpassed October 2008, the worst of the financial storm.

vixvix
The Study below the VIX chart shows the implied volatility of the VIX.

So although the market was already overburdened with holders of shares that wanted out, it was the increasing uncertainty that came with a lack of liquidity that explains the reason behind the VIX.

Clearly something happened with the servers that run the major platforms as has been alleged by many, and this lead to crazy bid/ask spreads that were wide enough to drive a truck through.


So what does this mean for the market?

For starters, most retail traders and investors missed out on the best prices.

volume

That’s not all that uncommon for a panic for the majority to miss out, but there still is a detatchment from the volatility you might have seen if fewer people had log on troubles and transaction troubles and difficulty even placing an order, much less getting it filled.

What it means though is those that did buy the dip had to chase it higher or were not able to grab a position of the size they desired.

I believe that means there’s a greater support underneath than advertised, but a retest will still create greater uncertainty because we didn’t have that price history that we should have.

In the contrarian philosophy of the “market moves to hurt the most amount of people” theory, enough people chased that I think at this point a retest of these lows will get even intelligent traders to be convinced that the bears are right, there’s no support below and that is the location by which you can get a lot of people who in 2011 finally swore they’d never participate in the market again until another crash that ended up buying the dip who will at the first sign things are going wrong sell and go away for quite awhile.

I think liquidity of the market in general is still not anywhere near 2007 levels and that most people are still risk adverse to stock ownership.

The longer term volume profile can give a clue of what’s to come.
volume profile

We are trapped in a sea of iliquidity. History of every recent panic suggests that it should last a lot more than a week. We should also see more volume come in for awhile and some price gyrations. Tat seems consistent with the charts and profiles. There is no real conclusive edge here on either side at these prices. The cost of hedging is too high. The option sellers are probably the way to go if you must pick a direction. A lack of price history and volume. Resistance above, support below. We certainly could see some wild moves ahead. But mostly I’d suspect that we won’t have a week that closes much below the 1875 area in S&P (187.50 in the SPY). Certainly those that bought back in the SPY 133 area have to feel good being up 50%, but there isn’t enough liquidity for them to sell. They need a mania high and euphoric press and the headlines that inspire the dumb money to jump in with both feet in order to start selling. If they do try to sell here for some reason, which isn’t entirely out of question but it’s less likely, they’ll have a lot of difficulty liquidating all of their shares based upon price history and prices would probably end up approaching 133 where there’d be plenty of buyers once again. There’s not really going to be smart money with significant assets that would sell only to re-initiate positions back at where they started because the institutional sized funds take weeks and months to acquire a position.

To emphasize, I could be wrong if a week does close 1875 range and if so and you don’t see capitulation and major volume, there’s no price reference for support until the 1330 range. I think that’s really low probability.

Until then just north of 205.00 should be resistance and just below 190 will be support. Standing at 200 that doesn’t leave a very profitable trade on either side.

We are in no man’s land. If I had to guess I’d say we stall and move back down to test support based upon the idea that eveyone missed out on the prices and chased higher and those who did chase higher aren’t going to continue to chase for much longer and the probably isn’t going to be a catalyst to get us above resistance with headline risk ahead.

I suspect the debt ceiling battle will be of major significance to the result of the election. If it goes off without a hitch, then confidence will be restored to the establishment candidates like Jeb Bush and Hillary Clinton. If not, the Ben Carson and Donald Trump or Bernie Sanders and Elizabeth Warren types will continue to surge in popularity. Martin Armstrong’s ECM date before the debt ceiling battle was scheduled for Sept 31st was October 1st and he predicted a rise in 3rd party and possibly 4th from within existing parties long before now. It is represented by the antiestablishment candidates, which may lead to a divide within an existing party.

If I had to make a trade I would buy OCT 210 call and sell calls at a strike of 205. You’re risking 5 to get about 1.5 (2.33-0.86=1.48, the spread between the two) if you hold trade till expiration. You need to be right more than 77% of the time to profit. It’s not that great of trade but Neither is selling a put spread up here after a bounce, and buying premium is out of the question.

I would look to sell a put spread on a decline and rise in the vix. If we approach support it’s okay to sell an at the money or in the money put and buy one close to support. A decline in price may see a rise in the vix which is usually good for selling premium.

Otherwise, I’d buy some XIV with a retest of support and possibly some TNA for a trade and I don’t think the toolbox of stock picking is available until the VIX declines.


update: sentiment
I don’t know If I have a great read on sentiment. I think it’s fair to say that this panic was outside the “standard deviation” of prior panic if only measured by the VIX and implied volatility of the VIX. As such, it’s fair to suggest that the “panic” portion of sentiment will result in the absolute low and discouragement can still exist without necessarily breaking that low. I don’t think it’s fair to consider the recent low as the “discouragement low” when clearly the market was in full blown “panic” mode as measured by the VIX at that time.

WITH that caveat, if I had to guess I think we’re in the discouragement phase now.  However, it needs to be emphasized that the lack of liquidity and price history should provide less predictability and greater potential for surprise moves at least within the range of say 187.5 to 207.5; take my sentiment outlook with a grain of salt. But with that being said, I think there’s a reasonable roadmap to follow here that may emerge moving forward

sentiment

Comments »

Support Tested

Zoomed in 10 yr weekly chart showing the uptrend from 2009 bottom.
channel test of support

Looks to me like a classic retest of the lower end of the price channel. So far we held and are oversold from RSI 14,2 weekly perspective if the week ended today.

Comments »

Option Trading Systems Part 3: Implied Odds

In trading systems there are the first set of expectations based upon the upside if you hit the target, and the probability of that upside measured against the expectation and probability of the downside. This was discussed using the metaphor of “pot odds” in Trading Systems part 1. But does it really end there? What about trades you close that neither hit the target NOR hit the full max downside? What about trades that exceed the upside target?

I believe you can structure a system and understand expectations with mathematics, but where things get fun is in estimations of math based upon conditions. Your read of the situation, the players involved, the possible alternative options, having contingency options and adapting to circumstance is what gives any game “character” and turns it less into a math equation and more into a balance of intuitive “feel” combined with a mathematical equation.

Back to the poker parallel, you may have pot odds to continue on a flush draw, but what about the value that comes in hitting the flush? If you know once you hit your flush that you can expect on average to get paid more and not lose any when you miss? More value. If you also can potentially win with an ace high if your opponent doesn’t put an additional bet in on a bluff? You may have more profitable situations than can be calculated by simple pot odds. As a result there my be situations even where “pot odds” doesn’t accurately describe the true upside.

When trading options, you are not trading a binary system. Even if you choose to cap your winnings by writing a call spread and sell the call at the strike price equal to the target price to cap your potential, you still have some trades that made less than the target amount but still make money, or trades that lose money but don’t lose the maximum. As such, just about anyone trading options is going to have to think beyond “pot odds”.

In trading it important to allow yourself to have that big payoff as a result of letting winners run beyond the target, particularly if there is little resistance once you get past said target. A good situation in an individual trade is if you have a clear volume pocket up to say $50 before substantial resistance but then the price history thins out above $52 all the way up to $60. If the stock’s upward momentum charges right through $50 and gets above 52, you now have new support and potentially could march to $60. Even though the trade plan called for $50, the system can be flexible and call for an audible and instead try to milk the trade for all you can. Even though you might think you can only get a small bet out of opponent you may pick up a tell that the card helped him, so you might try a check-raise to lure him to commit more chips. Fortunately, the “expected value” calculation mentioned in Trading Systems part 2 still is relevant as an AVERAGE when planning the system, but less so on individual trades.

There is a concept in statistics known as “variable change” that was popularized in the movie “21” about the MIT blackjack team. I will cover the details later, but basically by adapting to new information, you may be able to gain an edge by adjusting your decision as the trade plays out. In this case, “Variable change” is relevant because rather than apply a general baseline statistical data to what our expectations are based upon the average risk/reward of 3:1 that we target, or even say the R/R at $50 that we initially planned on the trade, we can take into account the most recent action of the stock and “call an audible” to maximize our results.

In blackjack “variable change” is more concrete as you can adjust to the “count” by calculating how your odds have changed as a result of several face cards being dealt already or several small cards being dealt. In poker implied odds can’t be known since the depend upon our opponent. In trading the upside and probability of hitting cannot be known with any sort of large sample size and small margin of error. Hence, it is more intuitive and up to the “read” of the individual. While that may seem sensitive to the individual trade and highly subjective which leaves room for mistakes, you can manage it such that the confidence level that “calling an audible” is more profitable than not is extremely high. Over time your skill and results may influence the profitability of the trading system, and your confidence will improve in your ability to correctly call an audible that adds value to the system.

The “implied odds” calculation is basically very much like pot odds since once a stock reaches the target price, you have a risk of continuing to hold plus a reward of continuing to hold. Once the expected value of holding no longer adds value,you can sell so as long as you keep in mind the overall context of the trading system must still be intact such that overall on average you reach your target often enough to offset losses and profit besides. Since you have hit the target, you will more actively manage the option and have an idea of under what conditions you will sell, and on average how much you lose when wrong by continuing to hold.

Where implied odds can get most confusing is in factoring it in before you start your trade, just as an intelligent poker player would not call on the flop without first intuitively considering the possible actions that may follow and the overall expected value as a result of betting on all streets. When trading a weekly option (or “yolo” as they are known around here), It often is easier to identify a price level whereby if price passes, the stock should run as those in a position get squeezed out. Often times yolo trades may have a strikeprice that is at the target and the reward is in getting beyond it and running as the shorts are squeezed out and past sellers look to get back in.

Comments »

Wired To Lose – The Psychology of Trading

You may not know this, but the human autonomic nervous system is not wired to handle stressful mental activities when there is any sort of perceived threat. The fight or flight response occurs as a means to avoiding physical threats, but stress and fight or flight can be activated simply based on any threats such as mental or financial ones. Any stress physical or mental is likely to affect your body the same way. Perhaps it is a stressful work environment. Can you deal with the threat the same way that an uncivilized society would? Probably not. If a boss is putting pressure on what needs to be done, you probably have to resist the urge to fight or run away. If you’re a professional QB while 300 pound lineman are rushing at you, stress happens. If you are sitting in a chair playing poker trying to bluff, stress happens. If you are sitting in front of a computer screen watching price go down and account value erode, perceived threats are still there. Once your fight or flight response hits, you won’t always behave logically and rationally.

fight or flight response
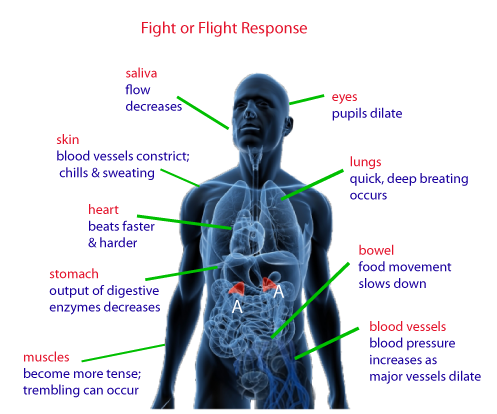
source:http://www.thinklikeahorse.org/images3/fight%202.png
After the fact you will have hindsight bias and recognize how obvious it was that you made a mistake. Not only will you know you shouldn’t have done that, but it’s possible you may have reminded yourself not to before you did anyways. Fight or flight makes it so your autonomic nervous system doesn’t care about your past logically sound plans. We make decisions first, and justify them afterwards. This is why poker players will say “I knew I shouldn’t have done that” why capable, talented professional QBs will still occasionally make an INT throw that is so bad that a 5 year old can see it was the wrong decision, and why intelligent traders can blow up their accounts or make a series of very bad decisions.

stress on mind

A bit on the psychology of it.

Fight or flight response is triggered in the brain which releases certain chemicals and hormones into the bloodstream, triggers increased blood pressure and anxiety, and redirects the blood flow towards your legs where you can take a defensive fighting position or be prepared to flee. In fact, the rapid rush of blood out of just about everything especially the skin and directing it towards the muscles, particularly the legs can lower skin temperature on our hands dramatically in seconds. This is actually what deception experts may use as an additional filter to detect deception. They may shake someone’s hand before and after they grill someone on something and detect extreme stress caused by lying, or not. It is unavoidable.

Although in some cases, fight or flight can increase awareness; it also makes you focused on identifying a threat to the point of being hypersensitive and irrational. Particularly if the right chemicals aren’t released to absorb the adrenaline and cortisol in the brain. The fight or flight relies on the reactive (instinctive) parts of the brain, rather than the reflective (logical). It diverts conscious awareness and kicks in subconscious via the autonomic nervous system. The subconscious is focused on alleviating the short term pressures of stress, rather than make decisions consistent with your long term financial well-being.

saber1

The primary jobs of the amygdalae are to screen the environment for a potential threat. Neurons in the amygdalae are activated even before we are consciously aware of a threat. In the face of real danger, this is a good thing, however, in modern life, most of the time there is no real danger, leading to feelings of self-doubt and therefore, undermining our attempts for survival by setting us up to ignore that one time when the danger is real.

Although the hypothalamus is the sensory switching station, where it sends visual information to the visual cortex, sounds to the auditory cortex, etc., that information is filtered through the amygdalae before it continues on to its final destination. If the amygdalae sense danger, it immediately activates the brain’s emergency response system. This causes us to react even before we consciously know why (by releasing excitatory hormones into the bloodstream, raising our heartbeat, breathing faster and shallower, sweaty palms, etc.), followed by conscious thought (the information being interpreted and analyzed)

http://www.neilslade.com/Papers/stimulation.html

In English, we will react to a perceived threat instinctively, not logically. Any attempt to explain why we behaved in a way was only done afterwards, never in the moment. This is why a trader might make a decision and regret it, he is only functioning as he is wired to. This is why someone will wrongly try to justify their reasons for holding. You must associate following a preconceived set of rules with survival, or your beliefs will prevent you from behaving properly.

People who are able to remain calm in an emergency situation and act appropriately without panicking, and in the process save their and other’s lives (or prevent injury to whomever involved) will benefit. They have the ability to activate their prefrontal cortex. That allows them to analyze, judge, reason, plan, solve problems, make decisions, and control impulses. What a powerful combination: activation of the brain’s emergency response system (to get us ready to fight or flee) and the prefrontal cortex to help us strategize and control dangerous impulses.

The neurophysiological mechanism as researched by Dr. T.D.A. Lingo at his research lab in Colorado, also called the amygdalae clicking technique results in the ability to activate the prefrontal cortex at will.  With enough practice, the user will automatically activate the prefrontal cortex in all activities, including those instances where the amygdalae have activated the brain’s emergency response system.  The amygdalae will be so busy activating all necessary systems that it won’t have time for any kidnapping J!!  The prefrontal cortex also helps in control such dangerous impulses.

People who are able to remain calm in an emergency situation and act appropriately without panicking, and in the process save their and other’s lives (or prevent injury to whomever involved), have the ability to also activate their prefrontal cortex with its abilities to analyze, judge, reason, plan, solve problems, make decisions, and control impulses. What a powerful combination: activation of the brain’s emergency response system (to get us ready to fight or flee) and the prefrontal cortex to help us strategize and control dangerous impulses.

Brain hack resource:http://www.neilslade.com/chart.html

Brain hack resource:http://www.neilslade.com/art/Brain/brainrev2.html#%22Greetings

When things are going well and stocks are holding up just fine, we actually will enter into more of a relaxed state, stimulated by computers and a still body that sits dormant in a desk. In fact, there have been some that conclude that television and computers puts you in a relaxed state

Scientific study looking at alpha (relaxed) brain wave state and television

http://www.thedryingroom.com/tv/Brin%20Wave%20Measures%20of%20Media%20Involvement%20-%20Herbert%20E.%20Krugman.pdf

As a result, you probably are less aware of and concerned with potential threats when stocks are doing well, and are hypersensitive to them when they are doing poorly. You may not stop out as early as you should because you get complacent when you should be vigilant and prepared to act, and then you may be triggered into “survival mode” and sell immediately when you are most fearful to alleviate the stressors. In other words, you may as a trader, behave exactly the wrong way because you are hardwired to do so.

When our fight or flight system is activated, we tend to perceive everything in our environment as a possible threat to our survival. Our impulses quicken. Our perception of pain diminishes. By its very nature, the fight or flight system bypasses our rational mind—where our more well thought out beliefs exist—and moves us into “attack” mode. This state of alert causes us to perceive almost everything in our world as a possible threat to our survival. Our thinking is distorted. We see everything through the filter of possible danger. We narrow our focus to those things that can harm us. Fear becomes the lens through which we see the world. Making clear choices and recognizing the consequences of those choices is unfeasible. We are focused on short-term survival, not the long-term consequences of our beliefs and choices.

Our fight or flight response is designed to protect us from the proverbial saber tooth tigers that once lurked in the woods and fields around us, threatening our physical survival. At times when our actual physical survival is threatened, there is no greater response to have on our side. When activated, the fight or flight response causes a surge of adrenaline and other stress hormones to pump through our body. This surge is the force responsible for mothers lifting cars off their trapped children and for firemen heroically running into blazing houses to save endangered victims. The surge of adrenaline imbues us with heroism and courage at times when we are called upon to protect and defend the lives and values we cherish.

In most cases today, once our fight or flight response is activated, we cannot flee. We cannot fight. We cannot physically run from our perceived threats. When we are faced with modern day, saber tooth tigers, we have to sit in our office and “control ourselves.” We have to sit in traffic and “deal with it.” We have to wait until the bank opens to “handle” the bounced check. In short, many of the major stresses today trigger the full activation of our fight or flight response, causing us to become aggressive, hyper-vigilant and over-reactive. This aggressiveness, over-reactivity and hyper-vigilance cause us to act or respond in ways that are actually counter-productive to our survival.

Wired To Win – Putting Psychology In Your Favor

“Hacking” Your Mind For Success

Perhaps the simplest, best way to turn down the activity of our fight or flight response is by physical exercise. Remember that the natural conclusion of fight or flight is vigorous physical activity. When we exercise, we metabolize excessive stress hormones—restoring our body and mind to a calmer, more relaxed state. We release mood enhancing neurochemicals that absorb the excess adrenaline in our bloodstreams and result in returning our mental state back to normal.

Exercise increases our natural neurochemicals, which help us to feel better. When we feel good, our thoughts are clearer, our positive beliefs are more accessible and our perceptions are more open. When we feel tired and physically run down, we tend to focus on what’s not working in our lives—similar to a cranky child needing a nap. It is difficult to be, feel or think positive when we are exhausted, sleep deprived or physically out of condition

However, this may be an insufficient response if the person is lacking the brain chemicals to respond normally. Proper brain functioning can be “hacked” also by nutrition. Optimizing mental health through nutrition means getting enough of the amino acids to support synthesis of neurochemicals. Diet should have a significant role in mental health. In other words, with the right foods, your body will make a proper balance of brain chemicals to support sound mental health. However, you still will need the exercise to “trigger” your body to resolve the stressful situation. Survival in uncivilized times required man to handle the threat. One possible explanation is simply evolution of civilization at a rate faster than the human genome.

Since the mental faculty tends to be temporary impaired when dealing with “fight or flight”, and most behavior tends to be “subconscious“, another one of the ways to deal with it is by getting into a subconscious habit of reading a checklist or flow chart that determines the actions for you before trading. When you are not in fight or flight you can set up all the logical systems you can imagine needing to come up with the correct and logical conclusions. You can practice it in an unemotional environment such as paper trading until it becomes automatic. Once you are looking at a screen and are prepared to act, you can refer back to your checklist notes verbatim and have your past logical systems stand in since your current ones may be temporary impaired. This will help you determine if the decision is rational or not since you will not personally be able to be a good judge at the time if any sort of stress or adrenaline is involved.

Another area for hacking your mind for higher level of functioning and focus will be a bit more controversial as it can be very dangerous is “nootropics” or “smart drugs”. Most common nootropic is caffeine followed by other stimulants. They can range from simply using certain vitamins and amino acids in supplementation to prescription drugs. The dangerous side of course is those who use drugs intended for people with anything from A.D.D., alzheimers and narcoleptics when they don’t actually have those conditions. Nootropics will likely not help the underlying cause of stress which requires a biological response coupled with sufficient production of neurochemicals to resolve it.

Capitalizing Off of Psychology

The good news is that other traders are also “wired to lose” at trading. This means that if you can come up with methods for bypassing the instinctive responses, you can actually have a substantial advantage.

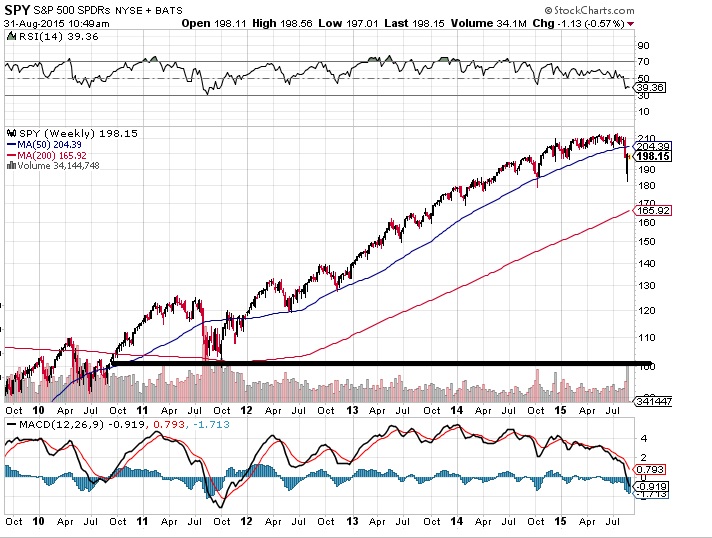
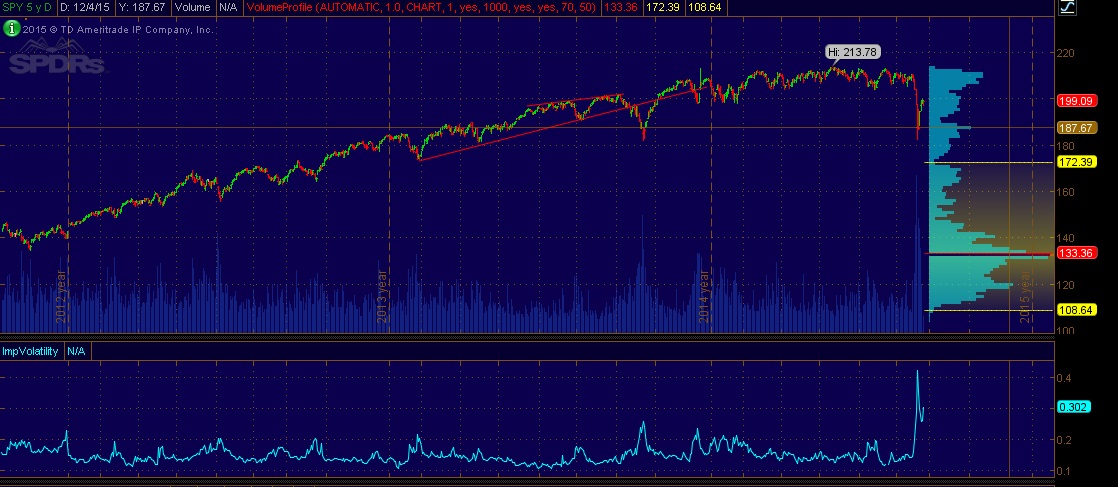
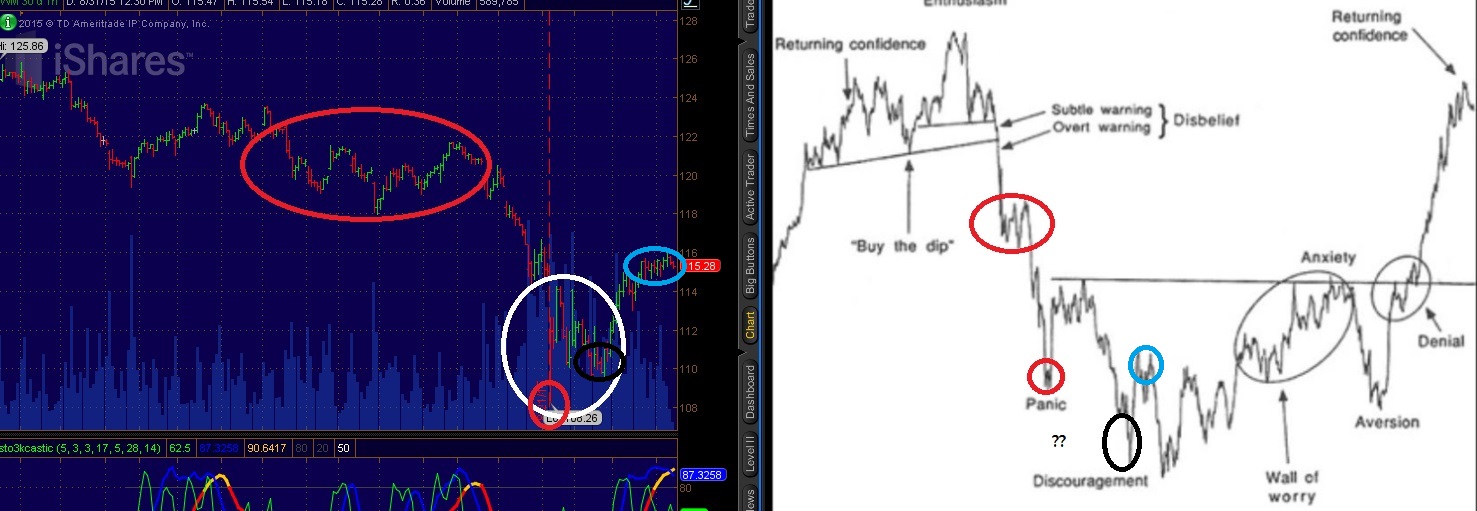
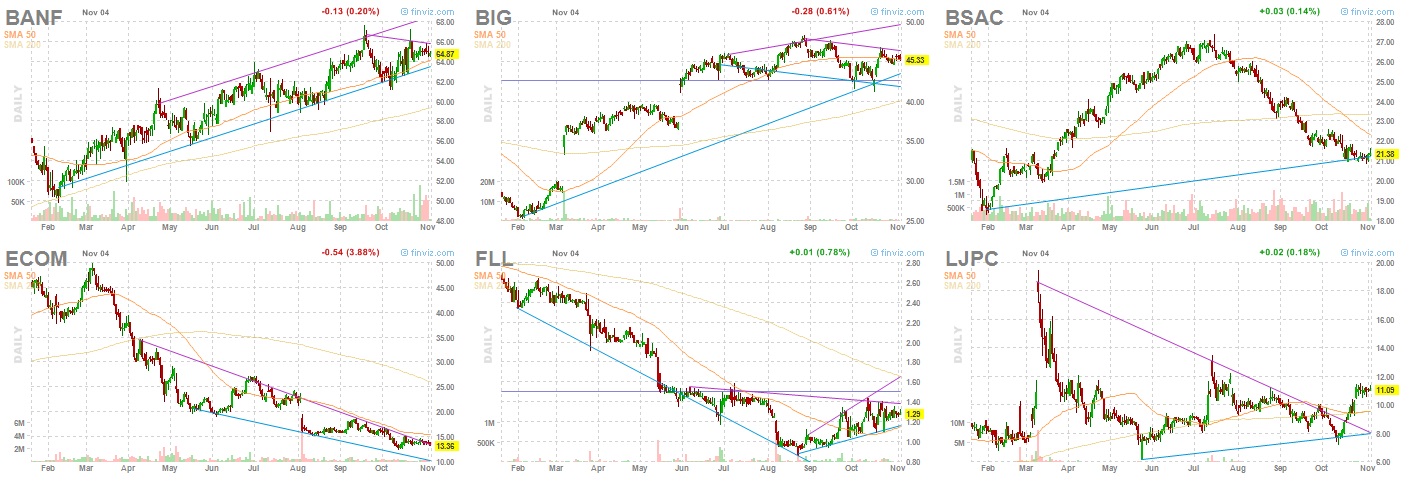
Many of you may have recognized Jeff “Option Addict” pulling up the sentiment chart:
sentiment chart
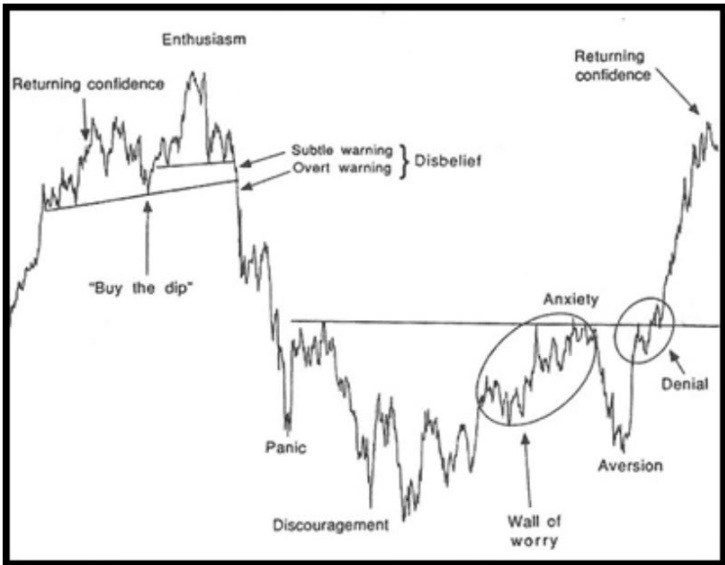
Original Source: The Nature of Risk: Stock Market Survival and the Meaning of Life by Justin Mamis (1991).

This shows how a market’s behavior displays the emotions that go on when trading. That is another way to be one who capitalizes and recognizes the market’s emotion and responding to it, rather than being a part of it and reacting with it. I certainly have noticed that it helps get you into a stock and sometimes avoid the emotions other people are feeling altogether. At a minimum it helps you recognize your own weaknesses, and by doing so, be a bit more patient. Knowing your perceived threat is not “real”, but instead your own emotional response to an imagined threat can allow you to wait it out. With less uncertainty about the process, there is a bit more comfort, particularly if you have a logical, structured plan that you believe in. At other times it can help you recognize more objective decisions about what the market is going to do next based upon the emotional cycles of the other traders and prevent you from becoming fearful or emotional to begin with.

Using Statistics as a Mental Hack

Statistics can be a great tool to help with psychology but it doesn’t always work for everyone entirely. The first problem with statistics is getting a large enough sample size. It’s important to realize that individual seasonality may be extremely relevant data as it applies to one particular stock, but probably does not have a large enough sample size to provide you with confidence that your past performance wasn’t just due to randomness.  Conversely, look at the entire sector of technology during October outperforming. It gives you hundreds or thousands of data points every year verifying each year that over half of all of the individual stocks not only traded higher on average over several years for a particular month, but outperformed the market as well.

Resources:

http://Charts.equityclock.com

Http://seasonalodds.com/

Candlestick can be analyzed over thousands of stocks over only a year and you still will have millions of data points that can be entirely objective if you make sure to define the candlestick pattern a specific way.

Individual price patterns are usually pretty subjective, but can be defined and analyzed statistically anyways, but individual bias or hindsight bias may still get in the way. Also, developing a program that can datamine the markets for chart patterns isn’t very easy.

See Thomas Bulkowski’s books: Encyclopedia of Candlestick Charts and Encyclopedia of Chart Patterns for reference. Also be aware that statistical patterns tend to also be cyclical. What worked well in 2002-2006 may not have worked well in 2007-2009 or in 2010-2014. Still, having the statistical background as ONE filter for selecting stocks can add objectivity and skew the confidence range of possible outcomes to be more in your favor.

Statistics help you think of stocks more objectively rather than “what feels right” as well, but for some people that won’t work. Poker players for example may know decisions that are mathematically correct but still battle the internal conflicts of their own emotions and make incorrect decisions. Math and statistics may help decision making when there is no stress. It may also help you to avoid thinking about results in a way that are too short term focus and it may reduce some of the pressures. However, it won’t help you avoid stress completely and probably won’t help you deal with it entirely either. Fortunately though it may reinforce the idea that the threat is imagined. If you are aware that your emotions are just hypersensitive because of fight or flight, it may allow some to rationalize and over-ride them, as uncomfortable as it may be.

Remember your subconscious is looking for a solution to the stress, the same as your conscious mind, but it prefers to make a decision that ends the stress, rather than just “deals with it and remains long in the position”

Disassociating Your Threats

saber2
The first picture of the saber tooth was very scary and perhaps you may have even noticed your heart racing, even though consciously you know that it is impossible for the image to jump out of the computer screen. Unfortunately your brain is hardwired to fire off when it recognizes any pattern that may be a threat. This one you’ll notice is almost comical. This is because the perceived danger has been disassociated in multiple ways. It is a picture of an object with a picture on it, and the picture itself is not seen as threatening. The problems can be disassociated in your mind to appear less threatening in a similar manner. Memories and imaginations of things can be transformed to become less traumatic through visualization as well.

Your conscious mind uses mental representations of reality to perceive and understand the world, rather than perceiving reality itself. Anything you think you see is really just a mind’s projection after taking in the input sent to your brain from your eyes and providing it in your “mind’s eye” and is not a direct feed of what your eyes see which is why you have blind spots and optical illusions that can work. You see with the brain, not with your eyes.

Your mind actually filters out as much as 50% of the information your eyes still take in to make processing more efficient. Famous psychological experiments involving inverted glasses with mirrors that flip the information taken in upside down was done and the result is that eventually the mind adjusts. Even with the glasses with mirrors on them where everything should be upside-down, they will learn to see things right side up again. After weeks when they have acclimated, once the glasses are off, things appear upside down again (until days later when the effect subsided). This is further proof (if you need it) that your eyes don’t see, they merely are the messenger to the brain. Optical illusions provide evidence as well. Since the subconscious cannot distinguish from a real and imagined event, visual imaginations can help re-frame and reduce any effect a situation psychologically has on you.

This is what’s behind another interesting tool to relieve stress or uncomfortable feelings and associations you may have from any ongoing event or memory of an event is the following mental exercise to disassociate from the situation.

Metal Exercise for Disassociating From Emotion

The way you can disassociate a memory or visual input you have is imagining a picture of yourself in an image rather than seeing exactly what you saw. This is a mental exercise psychologist and NLP modeler Van Tharp introduces to trading. This puts you from the perspective of “seeing someone else” reacting the way and being able to be more objective about the situation. Then you can also picture yourself as someone more consistent with the way you would like to be (in this case, imagine how a very profitable mistake-free winning trader would behave). You can imagine the body language and the way he does things. Then you can imagine stepping into that person and becoming them and then going about your day behaving in that way. It may help some people if they walk away from their desk and physically “step back in” into the image so they are “becoming” that person.

If you lack confidence, you can imagine yourself more confidence and also imagine a trumpet fanfare or whatever sound makes you feel more confident.  If it is a physical emotion you can imagine the feeling spinning in one direction and you can imagine pulling something spinning out and turning it around so it spins in the other direction and imagine it going back into the old spot and supposedly this makes you feel different about the experience if you are a more kinesthetic based thinker.

Some people may prefer a routine of sorts getting them in the proper state of mind to trade at their peak abilities. It’s all a question of how important you are willing to make it to you and what works best for you. You may want to approach this as a scientific experiment trying a month or two doing a different routine and determining results compared to the others by measuring the number of mistakes made (trading without respect to a particular plan, violating your position sizing principals,etc). Once you can trade a few months with zero mistakes, you’ve found something that works very well for you.

The primary purpose of this post was not to get wrapped up in the different ways to deal with it, but is more about getting you aware of it and giving you a few examples that can help. I hope this article was enlightening and can help you to refrain the way you approach or think about trading to understand that there are some basic challenges that every trader faces by no fault of their own, because of the way they are wired.

sources/citations:

http://en.wikipedia.org/wiki/Fight-or-flight_response

http://www.cracked.com/article_20432_5-illusions-that-prove-your-sense-reality-full-s232125.html

http://www.scientificamerican.com/article.cfm?id=when-blindness-is-in-the-mind

See also this wired to lose document.

Comments »

Cheaper commodities… Good or bad for stocks? Lower Yields good or bad?

There are two sides to any argument. Right now the question is: “Are cheaper commodities good or bad for stocks?” The answer is not so easy to explain. In part because it has to do with not only direction of price but speed of price and what other markets are saying which leads to how people react to the information at any given moment. Also, there are those that park their money, and those that move it around… There are those that move fast, and those that have too much to move to be able to move quickly. Looking at investing like an ocean… There are big waves which engulf smaller waves, and there are the faster, smaller waves.
The following is only a primer on how I have learned to attempt to make better sender of things.

When commodities are down fast overnight that is the sort of action that may very well trigger margin calls which creates forced selling. If someone (or some entity) is long oil futures or leveraged in oil stocks and overnight there is large drop they have to sell a lot to raise equity or selling will be done for them. (Not to mention those that sell in anticipation of margin calls of others and/or to avoid it themselves if selling were to persist or to maintain certain allocation percentages).

That selling will often trickle over into other areas and the temporary fear and forced selling creates more selling pressure than buying and sellers seeking a buyer leads to lower prices.

Especially true if multiple commodities are down fast simultaneously along with strong dollar and fast action in bonds in either direction signaling the perception of desperation to stimulate demand and shift of capital to “safety” or tightening borrowing requirements signaling the perception of difficulty borrowing and fears it may lead to deflation. It need not matter on what direction is good and bad for the market, the perception of it among enough people that believe in it and a large magnitude of a move is real enough to cause short term selling pressure that leads to more. Anything interpreted as a possible sign of deflation can be enough to cause selling pressure and a shift into “safety” or “quality”. Since there are many players with different ideas, theory, reactions, emotions, behaviors, motives, responsibilities, risk tolerance, goals, amount of leverage, strategies, etc… There is a lot of chaos within the market. It can be tough to decipher how many moving parts will react over time. To say one thing is good or bad for something else is looking at it too linearly. It depends not only upon context of other information, but in the context of your own timeframe and strategies as well. It also matters where market has accepted price before and how much capital is desperate. (Hard to articulate this since it is not the number of people that matter, but the total amount of capital behind each person’s reactions seeking buy or sell orders)

Someone that is long oil but off margin and has a lot of cash and intends building a position as just an allocation to a long term portfolio that contains other asset classes including bonds and stocks over the next several months would perhaps cheer oil going lower as they can lower the cost basis as they buy lower and they have only just started building it. Someone on margin long oil and stocks who suddenly has to make adjustments will only be able to look at it from a win/loss perspective.

One person’s mindset might be to buy at a discount and sell it at a target with time only variable that cannot be control or predict but playing for a big win and never taking a loss. They must buy at a deep enough discount or they cannot lose since they already are risking a low ROI if it takes more time than anticipated. Another might focus on both price and time and they are much less certain about whether they will be right or wrong but they will manage the price they take the loss and gain so that the system is likely to win over time. Rather than wait potentially years for something to turn around, they have to take a loss and the sooner, the better.

On the face of it one may be right that cheap oil and commodities are good for business and the consumer. But deflation is very bad for the business and consumer. If the market interprets cheaper oil and commodities as capital flow out of commodities and into stocks and happening wishing the context of expansion of money supply AND increase of the velocity of money (and circulation or concentration of it) then cheaper oil is an increase in disposable income for the consumer and will contribute to lower costs, higher growth. BUT if you interpret it as a sign deflation is near or already here, then prices of everything drops.

The cheap oil and commodities overnight are enough to trigger the believable fear for enough people to buy the story of deflation to make the reactions on that fear cause price movement and margin calls at least on the short term. Sometimes it is an over reaction. Sometimes not. Sometimes the very act of over reacting causes it to be real enough to last for awhile and be more violent than most anticipated as it puts enough people in a position where there is more forced selling and that forced selling changes entire moods and confidence in “the system” and that mood changes economic behaviors such as banks not lending and people unwilling to borrow. In other words, it can at times create a self-fulfilling prophesy.

Then there is “capitulation” selling or “selling exhaustion” which is another story.

Comments »

About The OABOT

I haven’t posted all that much on the OABOT. Regrettably I haven’t put the kind of time into the development of it in quite some time. Fortunately I still have a lot of prepared material on it. First off you have to consider “what makes a stock worth buying?” Such a question is what got me started on the OABOT.

Here is a link to the Spreadsheet mapping out my early concept for OABOT. Reading it you may have a better understanding at how I was able to construct the OABOT and what my thoughts and planning was going into it. I have dramatically changed the criteria and is nothing like what I have provided of how to define a stock in a cycle or how to score it, but it should give you the idea.

Past posts on OABOT:

OABOT demonstration

A vision for the future of OABOT

I also constructed an OABOT document to explain what it is and how it works. oops, can’t upload right now due to the size, and the site I uploaded it to is down.

Lately the way I like to use it is grab 80 names from each “risk category” then put it into finviz and scan 400 stocks and narrow the list. There are two ways to rank stocks either taking into account “what’s working” to boost stocks that are in the right group, and just by ranking by overall setup score. Usually I like maybe 10% of the setups when doing it this way which gives me a pretty good list. If I use the summary tab to find the best themes, and then categorize the exact industry in that theme and determine what phase of the risk cycle is working in that idea or the next one, I have a very concentrated list that in a couple examples I liked about 30-40% of the names I picked. This really confirmed for me that finding a group that sets up together and finding the right classification of stock within that group will really boost the accuracy of what I’m doing and definitely will be a major part of improving the tool in the future.  Unfortunately adding a multiplier combining setup score AND which groups are working ran into problems since it over rated a lot of very small industry groups with less then half a dozen stocks in them.
update 3/15: I think I forgot to attach this document back when I first made this post so I’m adding it now.
OABOT and NEO: The Next Stage

Comments »

What Makes A Stock Worth Buying?

It is a simple question but the answer is very difficult to answer in a way that a computer can understand. Attempting to do so allowed me to learn a lot. When I started the task of trying to put Option Addict’s teaching into code almost a year ago, I wanted to explain it in a way that a computer could understand and assist me in speeding up the process. In doing so I had to put the process under a microscope and learn to think about things in a different way. The only thing all stocks should have in common is the upside should significantly outweigh the downside. However, telling a computer how to determine that isn’t likely. One commonality that I like is contracting volatility. Unfortunately the dataset I am using only has performance and volatility on set intervals such as weekly or monthly so just because price as moved up or sideways from point A to point B as volatility contracted from monthly basis to weekly basis doesn’t mean the setup is good right now. Additionally, what makes a stock worth buying near the highs is totally different than what makes a stock worth buying near the lows.


buy

Ultimately a good stock to buy is simply one with asymmetric risk. (a risk/reward ratio that works in your favor). We typically look for a spot where the volatility is contracted severely in a stock and a break one way or another is likely to occur soon. The resolution of that break tends to result in explosive price swings in on direction or another often enough for us to capture big winners. If it goes against us we can salvage premium or sell stock minimizing the loss while letting winners run. There of course is more taught by option addict on how to know what type of stocks to focus on but subscribers of after hours already know that. I chose these 6 stocks among others on 11/4 (see comment in OA’s post 60% in 24 hours) with a lot of help from the “OABOT” which attempts to put much of Option Addict’s teachings into code. I wanted to show these 6 because it is enough to illustrate the drastic difference in a stock’s characteristics near the highs, near the lows, and everywhere between. Each of these stocks were at least in the top 80 of their respective “categories” and were selected out of nearly 7000 different stocks total. Not every stock can be given a rating and not every stock ends up in the right classification and not every stock with the right classification and high rating turns out like you hope. However, by characterizing a few things and breaking the stocks up into groups you can at least treat stocks with certain characteristics differently, and have EACH classification scored individually. Although it is no certainty that a stock with no dramatic moves over past month or week, with contracting volatility and daily move less than 2.5 times the ATR (you want to buy something currently in a tight range relative to the last several days as well as contracting in volatility over the entire week.) That tends to be a very good starting point. Rather than filter OUT all stocks that don’t meet these characteristics points can be awarded IF a stock meets criteria A OR B and you can program the excel spreadsheet using IF (Criteria A) AND (B),OR (C) AND (D) THEN (add X points) type language. But stocks near the low need to see a sign of bottoming and be such that it is starting to curl up and then consolidate where as stocks with strong trends you wait for recent weakness and for it to consolidate without taking out prior lows. In terms of what you tell the program this is drastically different so you must code it such that IF criteria such as percentage off the highs or lows is met THEN classify the stock differently.

For example, a “trash” stock that has been chronically underperforming should ideally see some recent short term strength and be turning the corner on the short term and consolidating upwards off the lows and short term be showing signs of a new uptrend such as a stock not being far below, and ideally being above the 20 day moving average. A laggard stock’s who’s just recently been dumped on the other hand will probably be below the 20 day moving average so that criteria might not even be used. It should either still be in a strong long term uptrend and/or be seeing some sign of selling exhaustion, oversold condition and perhaps some short term consolidation along with it still being up from it’s 52 week low and possibly above the 50 day low so that it is likely to be making prior lows. The laggard was the most difficult stock to classify and rank as it represented almost all of the “leftovers” that were not close enough to highs or institutionally owned enough to be considered “quality or “momentum” but were not so illiquid and chronically underperforming enough to be labeled “trash stocks”. Ultimately I had to break it up into 3 separate categories to be able to apply different scoring metrics while still lumping all 3 of them in the laggard category.

I knew that every stock should be consolidating in some way, however in some cases consolidation could be more of a continuation pattern to the downside where as others it could be reversal pattern from the upside back down. The fact that it is consolidating on it’s own might not be useful. So each metric of consolidation must be first evaluated and scored individually and manually looked at within the context of other evaluation.

I decided to integrate fundamentals at first but in hindsight I wish I would have kept that separate and have separate classifications for fundamental scores as well so that it would be easier to filter out at will. At some point I will probably end up undoing the fundamentals. For example, for “momentum stocks” I had rewarded accelerating earnings growth substantially and as a result it is a lot more difficult to use the ranking to find good technical setups in “momentum stocks” unless they also are showing earnings growth. For “quality stocks” I decided to look at stocks that had plenty of liquidity, and insider and institutional ownership along with positive earnings growth.  The problem with that of course is there can be biotech and speculative companies with high quality charts which are still leading their respective industries without positive earnings. There are many challenges faced with classifying stocks. Do you neglect some stocks and have some good stocks that you miss or get miscategorized? Or do you risk grabbing too many stocks including those you don’t really have any interest in. Of course with additional complexity it would be possible to only set up a score relative to the sector or relative to the industry or both. I didn’t involve fundamentals for any other classification as I realized at some point I may want a separate ranking. Plus I didn’t want to have a ton of uncategorized stocks that I couldn’t rank.


Comments »

Feel The Weight of a Thousand Tonnes of Gold on Your Chest!

goldsuit

gold
Gold under $1200 is at a tipping point. The weight of all those who own gold at a higher price and want out will begin to weigh on those who want in and the stock price will likely behave like gold in water… sinking. Volume profiles provide context for the collective psychology of any market. People tend to fear loss more than they appreciate or are anxious for gain. When they are under water they are looking to sell and break even or reduce the loss and they are not thinking about gains. For this reason you can anticipate speed and direction with volume profiles.
Once everyone gets in a market in a mania and there is no longer any bid to support higher prices, prices begin to decline. As they decline eventually buyer after buyer ends up under water and soon it is only a matter of time before it is a race for the exits. This by no means is a certainty, just an edge that you can gain. However, allow me to show why the odds are heavily in the gold seller’s favor and why the man in the gold suit may be like someone in a goldsuit literally underwater, unable to shed gold soon enough to reduce the weight and swim to the surface.

goldpsychology

You can see why gold under 1600 led to a sharp decline as there were fewer people likely to step in and buy and a lot of bagholders. Some of those sold to those who bought between 1200-1400 and new players entered the game. Some of those who bought above 1600 are still in the game. But now those who bought between 1200-1400 are now feeling the pain as well and those who bought into the mania top are in deep trouble. It’s likely only a matter of time before panic sets in. Failing to panic will only prolong the malaise in this market that lasts years, as after enough time, those in gold will be sick of its underperformance, but it could very well trap new players in the meantime and grind sideways for a very long time. The best thing the gold longs will have going for them is the possibility of a panic to flush out as many gold bugs as possible where new money can enter and the psychology can invert and flip in the bulls favor.

One interesting thing to note is gold is an international asset and the dollar is rising. The other thing the bulls may have going for them is that the dollar is strong. That seems to run contrary to what most gold bugs have been “pitched” but if gold can panic on a strong dollar and form a bottom on a strong dollar, it will have the majority of other currency behind it followed by the dollar. When the dollar is strong other currencies are weak and other countries may seek the dollar AND GOLD as a hedge to their declining currencies. When you price the gold in yen or euro for example, gold is not looking as bearish as the yen has also declined sharply. If gold can flush and panic can take over, volume can spike as the headline prints “gold under $1000!” and every gold bug capitulates you will have a short term constructive volume pocket above at that point and depending on the volume when gold hits around $1000, you may just begin to see the scales begin to tip in the favor of the gold buyer. However, right now it would appear the odds are in favor of the gold bears by around maybe 8 to 1 or more. And if $900 gives way, the weight will be CRUSHING to the gold bugs. Personally I think gold under $1000 is the low because that will attract the attention of a ton of new buyers and cause panic among soccer mom’s and dad’s. However, if there aren’t enough new buyers to SUBSTANTIALLY tip the scales back the other way, you could see a lot of sideways action again and an eventual decline again that is only made WORSE by all the new buyers who eventually find themselves underwater and become sellers.

Of course, buyers could still come in but if they enter they would have to come from somewhere else. The people that are supposed to stay short or stay away could cover and come back in and the buyers that are supposed to panic could double down and buy more. There’s tons of money in other markets relative to gold so liquidation of bonds or stocks to buy gold, or another market would have to grow or wealth in India would have to skyrocket as buying gold is part of their culture could save it. But it would need to happen quick and gold would need to quickly reject new lows and retake 1300 before it could start to have the odds in the bulls favor. But anything is possible.

However, being long gold is playing some theory without respect to the odds and payout. HOPE is not an investment strategy, unless you want your strong dollar and crashing gold leaving you with very little remaining CHANGE.


Comments »

Primer on Breadth

As some of you know, I created a little research tool that with a press of a button updates the latest finviz data and runs some calculations. I can use it to do a lot of different things but it is really an unfinished project to narrow the list of stock picks but I added other features. One of them is that it updates market breadth data.
breadth tracking

Market breadth is some form of measurement of total advancing stocks vs declining stocks. There are many ways to look at breadth but in it’s simplest form it basically is a way of offsetting the market cap weighted average by telling you if participation is broad among all stocks on more of an equal weighted basis and a way to tell if market momentum favors the bulls or bears. I have set up these different measurements of breadth to focus on some of the more extreme movers in the market only. By focusing on the extreme moves I get a better litmus of what has moved substantially enough for one to conclusively say that the movement is more than just “noise” or temporary emotion. I am focusing on the conviction moves where people chased the stock one direction or another. Although the logic is simple behind breadth, there are a variety of ways to use it. There are longer term signals and shorter term signals, and there are breadth as a contrarian signal, or breadth to confirm a shift in sentiment.

% movers indicate momentum and sentiment shifts

We will start with the % movers.This focuses on stocks that have moved beyond a minimum threshold in either direction. To be fair, I created an adjustment so that if a stock has moved up 150%, the down equivalent was the amount needed to bring the stock back to it’s starting point after a 150% move upwards, or a 60% decline. Initial thrusts of breadth upwards after bearish conditions are the proverbial “green shoots” that may begin to trigger/signal a shift in sentiment. One or two of them might happen in a bear market too as the rips higher are fast and violent. So depending on how aggressive you are with trying to time every move and whether you try to anticipate the next move by buying the oversold conditions, or waiting for the shift in sentiment to take place, you may or may not want to wait for more substantial confirmation. Tracking these results on a daily basis and creating a 5 and/or 10 day moving average is one way to go about monitoring the movements for fast rips and sustainable shifts in sentiment. Typically the more bearish and greater declines that precede such a shift sets up more bullish conditions once sentiment flips to bullish and all the cash on the side and value created will trigger value buying plus growth and momentum buyers and retail trader chasing higher following conditions where everyone that was ever going to sell already had done so.

new highs/lows as contrarian signal

Tracking new 52week highs and lows (or in this case, within 1% of those marks, is a way to look at longer term accumulation vs declines and can be useful as a contrarian indicator or early-middle bull market/ middle-late bear market indicator. When there are little to no stocks at or near their lows, you may want to consider raising a bit of cash, position sizing a bit smaller, and being a bit more cautious and/or hedging. Tops are gradual, but short-intermeidate declines can be sharp and painful if they are correlated and violent. New 50 day high/low is the same principal, but can be used to confirm the longer term signal or on a shorter term basis for a more active signal. If stocks are 90% near highs vs lows but those within 1% of their 50 day high/low does not confirm, there are still perhaps some stocks near intermediate term lows offering buy the dip opportunities as opposed to a euphoric mania. If stocks are over 90% near 50 day high/low but perhaps on a 52week high/low they aren’t giving a signal, you could be near a temporary swing high and perhaps some minor caution in preparation to buy at a better price might be warranted.

Moving average breadth as trending indicator

So another form of breadth is looking at moving averages. You can use moving averages to indicate either a recent reaction and mean/reversion or as trending indicators depending on how you set them up. You can use these at whatever duration of moving averages that you want. I have just set up the standard 20 day 50 day and 200 day moving averages. I want to look at the % of stocks above each moving average (uptrend) vs the % below each moving average (downtrend) If instead you only look at those significantly above each moving average, you can look at it as the % of stocks at overbought or oversold extremes as well for mean reversion and a more contrarian oriented signal.

Then I looked at stocks with accelerating trends or an indication of a more convincing trend as it lines up on multiple time frames to be trending. To do this I looked at stocks with their 20 day moving average above their 50 day moving averages AND the price above their 20 day moving averages… vs stocks with 20 day average below their 50 day moving average and price below the 20 day moving averages. Most likely this would often produce very similar results as saying the 5 day moving average must be above the 20 day and 20 above the 50, or 5 day below the 20 day and 20 below the 50. I repeated the process with 50 day and 200 in place for the 20 day and 50 day for longer term trends.

Breadth Divergences of leadership:

One of the reasons I track TWO moves of each timeframe on the % movers is to look for leadership. One of the movers is a significant, but lesser extreme than the other. When I look at 4% movers I like to see these MORE bullish than the 1% movers and if there is to be a shift off lows, I like to see it on increased leadership/aggressive chasing that is more indicative of a paradigm shift than just your increase in buying equally due to temporary emotion on news without any clear leaders. If the 1+% movers are for example at 30% and the 4% start to creep up towards and above 50% first, this to me tells me there is a shift of sentiment and people are willing to chase a select few stocks higher, which may become the leaders of the future. A healthy market will have leadership emerge first, and that will give you an opportunity to get in before the leaders lift the rest of the stocks.

Breadth Divergences of TIME:The other kind of divergence is one of time. This is when the breadth signal on monthly data is bearish and the shorter term signal on the week and/or day shift bullish. The problem here will be how to interpret the data… Either it is a rip to sell into, or the start of a shift which will turn the weekly and monthly data positive and lead to a greater, longer term sustainable move. This signal in and of itself is not useful unless you can put it into proper context.

Breadth Intraday Shift:Tracking these results a few times a day can illustrate how things change over the course of the day, particularly when held in context. The best signal I have got since tracking this was when the Russian invasion of Ukraine took place. First everything was down as one might suspect, but the 4% movers were less bearish. This started to drag down even the 4% movers to become slightly more bearish at first as panic selling spilled over to whatever whas up and those down moderately spilled to more substantial losses. Interpreting this was initially difficult. Was it that the smart money that had a lot of capital to move accumulating on the fear and wasn’t believing in the decline but the broad sentiment and panic caused them to sell off, or did the smart money begin to shift as well, recognizing that things could get worse. But then towards the end of the day the 4% movers started ripping first, and turned very bullish, followed by the 1% movers turning moderately bullish. That signaled that all the fear based selling was over and the market began to recognize it for what it was… a buying opportunity on fears of a world war that may not materialize. This continued into the next day along with the news that came that Russia was withdrawing their invasion and for the time being the signal got you near a nice swing market low and if you followed along with OA’s risk cycle, it was a fortunate situation as you knew what to buy and you had a signal to get in the market ahead of the big part of the move.


Adding Volume Filters: One thing you may want to do is only look for stocks that are up or down on the day on volume that is significantly greater than usual 1.5x, 2x,3x. This signals more active participation than usual and will better measure of participation as opposed to thin volume movements that may not be as telling of an aggressive change in sentiment as when all the stocks advancing are doing so on increased volume. The problem with this is you can only really use it for the daily moves as far as I am aware of as it is more difficult to track volume on a weekly, monthly and quarterly basis.


Comments »