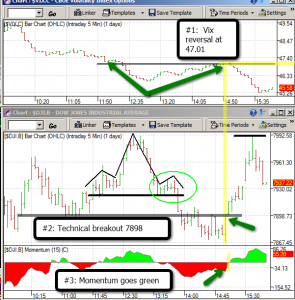
I used the following indicators to short FAZ at the close. Priority was given to technical breakout, then momentum, then VIX. For now, I think that is the proper order for indicators.
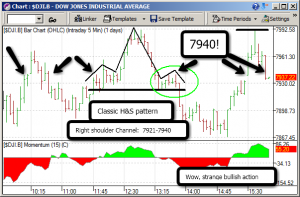
Here’s the snapshot of today’s H&S pattern intraday on the DJI/SPX I mentioned to take note of over on StockTwits. Notice the golden 7940 spot. I’ll be using this, plus that tail on the close to trade the rest of the week:
Here’s how I spotted the reversal at the close… a rare 1-2-3 punch with VIX reversal (hardest to spot), technical breakout, and momentum shift green ( = selling has stopped). Shorted FAZ with a few twittererrrerererrrrs. However, I capped my gains at 3%… I was too afraid of the 7940 checkpoint.
Here out, I will use the 15-minute tail on the SPX/Dow to see where we go. I don’t mind shorting FAZ again if market can hold that 7940 with VIX flat. I think in the next few days the VIX will be tough to use, therefore I’m slowly switching back to technical and momentum indicators.
One last note… today we had divergence with the DJI/SPX versus the NDX. I’m not sure if the bears know how to deal with this. Last Wednesday IBD gave us a “Follow-through-day”… Ha! A series of bad economic news shut that FTD down fast. Let’s see if we can get back to that level.
aLoHa,
-gio-
If you enjoy the content at iBankCoin, please follow us on Twitter


Thanks for the comment on the blog! I was breezing through some technical indicators, and I happened to find something interesting with the Fast Stochastic %K and the RSI indicators. With every stock I’ve check, a combination of a 10 Day period on the %K and a 20 Day RSI gives some really good demarcation lines in relation to buy and sell points. Idk if this is something new or I’m simply repeating something old, but if the %K is above that RSI, the equity of choice still has strength. Until the crossover from a point above the RSI to a point below it, the stock doesn’t begin to drop. You could probably top this strategy off with a VIX trading set-up if the market trades off of volatility or an RMI indicator with a 20 Day period. Again, I could be stating something so ridiculously obvious, but it seems to work well. I’m waiting for the correct time to get into the market and test this, and with the $SPX where it is nearing its 805 support, it may be time to press my luck! Thoughts?
ZM
Radness. I liked how the VIX didn’t spike with the 10:15 market drop, that spoke to the overall vix down day. Market took out 11am support before running up, catching shorts, but not on vix..
Hey zMoose… u got a lot of indicators there. I think WoodShedder can help you better than me… he’s a master with RSI. even if it seems “obvious” that doesn’t mean its not going to work; actually, keeping it simple is often times the best thing to do. Right now I have two guys working on a VIX vs RSI strategy, and so far their back testing is real good.
Just one note, the market is in a tight range with little direction, so I’m not sure how skewed the “strength” in RSI will be.
I’m curious why you short FAZ instead of going long FAS ?