iBankCoin
Home / firehorsecaper (page 7)

firehorsecaper

Tokyo based, expat Cape Bretoner. Learning to live in a de-leveraging world. Better suited to the crusades. CFA & FRM charter holder. Disclaimer: @Firehorsecaper reminds investors to always perform their own due diligence on any investment, and to consult their own financial adviser or representative when warranted. Any material provided is intended as general information only, and should not be considered or relied upon as a formal investment recommendation.

TESLA – EV SUBSIDY TAPER TANTRUM ALERT

Tesla bears, Citron being the latest, have put forward many reasons why they think $TSLA is overvalued. Because it produces spectacular electric cars with Elon Musk at the helm (in the think tank) people are getting snowed into applying a sales multiple of upward of 6X while waiting for the required earnings (GAAP earning expected by Q4 2016) to apply more traditional P/E metrics. The forward P/E multiple of Tesla is currently approximately 150x. IF Tesla sold 90k cars per years (50,580 shipped in 2015) and made $10,000 per car (loss estimate is about $4,000), the P/E would be about 30 at their current market cap of $26.33bln.

As per trusty Exodus analytics, the average car company P/E is 9x and the average consumer good company trades at 23x. TSLA is the pure electric propulsion version of RACE. Ferarri was recently spun out by Fiat Chrysler, due in part to premium valuation as a consumer product company.

The Tesla bear case hinges on the company’s cash burn rate. Other concern items include recall risk, reliability issues, and Model 3 launch timing (their 1st “non 1%” model at <$50k),which is inextricably tied to the timing of their battery giga-factory. A very important item that has received very little coverage is the fact that electric vehicle incentives are being rolled back in key global markets. The demand side of the equation is where more focus should lie.

A full 23% of Norway’s cars are now electric vehicles (EV), link to chart below. Tesla Model S is the #1 EV model in Norway. The generous Norway program, funded by their enormous Norges Bank Investment Management (NBIM) sovereign wealth fund, is to be amended, replaced by a lower cost subsidy as there are now 50,000 EV’s on Norway’s roadways (target achieved 18 months early) and 3/5 vehicles in the bus lanes are EV’s. Perhaps too much of a good thing. Electric cars carry no VAT, no purchase tax (together typically 50% of the purchase cost), pay no road tolls, no tunnel usage fees, no ferry charges, free parking, free charging and are given full access to bus lanes.

The level of Norway’s subsidy is 2nd only to Hong Kong where EVs are not currently subject to motor vehicle FRT (First Registration Tax), which equates to a US$64,400 subsidy on a Tesla 70kWh Model S. In addition to the large purchase subsidy, Telsa also offers a very generous RVG (Resale Value Guarantee) in Hong Kong where Tesla floors the residuals value at the 36 months point at 75%. Conditions apply of course, with one of the biggest being a 35,000 km mileage cap, but this is not a huge issue in HK where there are only 2,100km (1,270 miles) of roads. With a net purchase price of HKD 529,000 (US$68,000), this makes a Tesla a Toyota Prius like value choice versus cars like the Mercedes E200 which has a comparable HKD 564,000 (purchase price), and a hefty FRT (first registration tax) of HKD506,100 for a total cost of HKG1,009,500 (US$130,050). There is no RVG on the Mercedes either. About 3% of new car sales in HK are electric (USA is 0.8%). Most expect the Tesla Model S to be subject to FRT from March 2017 as it will be placed in the “luxury” category. It is possible the Tesla Model 3 could still be exempt from FRT in HK, but it is conjecture to place odds on this outcome at this juncture.

The US Federal subsidy for electric cars is US$7,500 (some States kick in too, with $2,000 typical of those that do). The UK subsidy is GBP4,500 (US$6,400).

https://atlas.qz.com/charts/VyVRQEC7xhttps://atlas.qz.com/charts/VyVRQEC7x

Singapore is an interesting case. Tesla (or at least the owners/importers) have a strong case for feeling hard done by. Singapore is knicknamed the “Little Red Dot” for a reason, it is small with only 3,356km (2,000miles) of roads. One would think an ideal place for EVs where exorbitant car pricing keeps the automobile stock at approx. 1mm cars for 5.4mm inhabitants. In a case last week, a Singaporean was charged a S$15,000 (US$10,800) tax surcharge on a used Tesla Model S which was imported from HK. His all-in cost for this “previously enjoyed” Tesla Model S was just shy of US$300,000, quite a contrast to anywhere else on the globe (my 6 year old petrol fuelled Golf GTI was US$48k two year back). This is the first known case of a tail-pipe CO2 emission free vehicle being penalized in this fashion, as Singapore factors in emission at the electric power station to their carbon math. The electric energy consumption of the Tesla S when tested was 444 watt-hour/km and with a carbon allocation (grid emission factor) of 0.5g/watt-hour applied, the deemed carbon output was 222g/km of CO2 which placed the vehicle in the +S$15,000 band under the Carbon Emission-based Vehicle Scheme. Clearly, how your EV stacks up against the competition is an important metric in the purchase decision. Both the BMW i3 and the much pricier i8 qualify for a S$30,000 (US$21,600) carbon rebate, purchased new,  in Singapore. The frugal Peugeot Ion was assigned  a S$20,000 carbon rebate (US$14,400) after comparable testing to that the Tesla Model S.

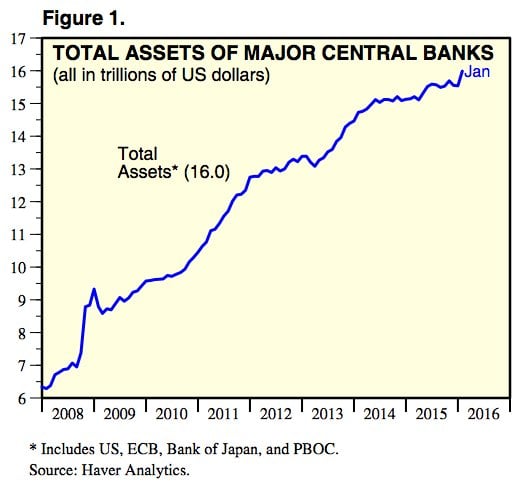
Equating electric vehicle subsidies to G10 quantitative easing:

CcqtBz9UMAAMkDP

atlas_EVIn the current environment, Tesla needs all the global QE (incentives) they can get. Norway is tapering EV credits, Hong Kong is tapering and considering a hike in early 2017, Singapore is hiking (Model S at least). A number of less critical markets continue with ZIRP, considering NIRP, but their numbers do not move the needle markedly.

The US has 6.4mm km (3.9mm miles of roads). The now aluminium bodied Ford F-150 is the best selling vehicle in the US, boasting better fuel economy than most 5 year old cars. With a range of 250 miles, under optimal conditions, Tesla is destined to be largely an urban focussed, 2nd-3rd vehicle phenomenon for the foreseeable future.

Ditto for China where charging stations are an issue. Surprisingly cost is not an issue is China with many thinking Tesla would sell more if they charged 1.5X more for them. Tesla works best in compact urban areas, but people typically do not own free standing homes in these markets. Soft infra like fibre has faced slow adoption due to cost making large scale EV parking space charging a Jetson’s like proposition.

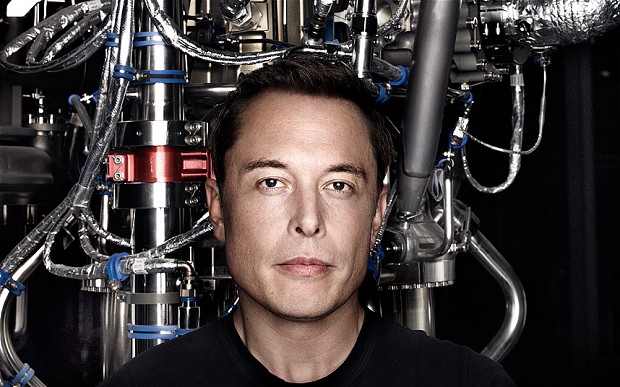
The Nissan Leaf EV surpassed the 200,000 unit sales metric in December 2015. This is double to nearest two competitors (Chevy Volt & Toyota Prius). Elon Musk was not put on planet Earth to duel with such pedestrian people delivery vehicles. Tesla, SpaceX, Hyperloop, SolarCity, the list goes on, but we think Jack Dorsey is spread too thin. I would love to play poker with this man. JCG

MUSKsum_2778344b

Note: Awesome product execution, top shelf, and never accomplished before from a standing start. I’ll likely own a Tesla vehicle some day, but my involvement with the publicly listed TSLA stock to date has been from the short side. Currently short, and nervous. 131mm shares authorized, 101.8mm issued, 29.4mm (22.5% owned by insiders) with a comparable (slightly higher %) number of shares held short. Nitroglycerin. Adult swim. Tight stops advised.

Follow me on Twitter @firehorsecaper as my 11 year old is gaining on me.


Comments »

INDIA BUDGET – GOOD AS GOLD

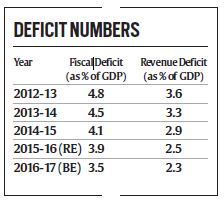
This week brought the highly anticipated Union Cabinet budget 2016 in India. Most were pleased, as India’s Finance Minister, Arun Jaitley largely kept to the fiscal deficit reduction roadmap previously outlined to the market.

fiscal-graph

Note: Trending in the right direction

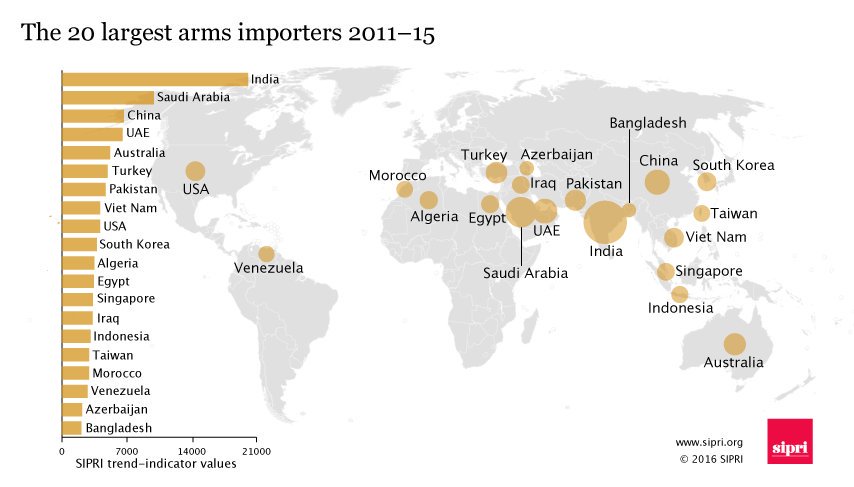
In India, the government financial year runs from 1 April to 31 March (like Japan). Increased spending plans include agriculture reforms, infrastructure spending, healthcare reform and rural development. Government workers got some love with a much overdue pay raise slated in the most recent budget, after a decade of flat pay. Corporate taxes were cut by 5% to 25% in the latest budget. Little coverage has been dedicated on this point, but defence spending was up 13% in the budget, with India already the 5th largest defence budget globally. India was the largest importer of arms over the 2011-15 period as outlined graphically below.

f3a74469-28dd-4543-aedc-35a403c5d5dc

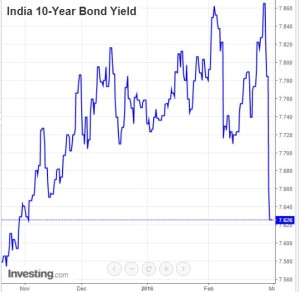
USD/INR (US Dollar to India Rupee) stands at 67.69 at present. The SENSEX is up nearly 2% today, but remains down almost 12% year to date in 2016. 10 year bond yield have rallied smartly this week on the fiscally restrained budget.

86eca39d-cd4a-46e4-8fa9-17cca279284f

India’s primary imports are crude oil, cooking oil and gold. The drop in oil prices provides a sizeable lift to India which already is growing at a near world leading 7.6% (2015/16). Gold imports have proven to be a tough one to manage for India. The populace has a near unsatiable demand for gold (42% jewelry demand, 50% investment driven and 8% industrial), consistently importing 1/4 of global production (>$50bln per annum). China and India have similar demand profiles, but China is also a major gold producer, hence the effect on their current account is less troublesome (along with the 5X+ bigger GDP thing). India would not be as concerned with running a current account deficit if it were from foreign direct investment, but gold (a non-essential) importation is something they have limited patience for and have shown little success in curtailing.

Duties and taxes have been the abatement weapons of choice. The import duty on refined product with purity > 0.995 is 10% and 8% for dore (unrefined) bars. Some expected India to cut import taxes on gold in this year’s budget, but they did the opposite, much to the chagrin of the many Indians. The tax on dore bars goes to 8.75%, lessening the tax arb with refined at 10% and a 1% tax on all gold sold in India was instituted (last removed 4 years back).

A lot of work goes into avoiding these taxes, as one might imagine. One alleged means is to import lower purity gold (i.e. 0.994) free of duty and refine it onshore back to 0.995 (good delivery standard). The India government has a Gold Monetization Scheme (GMS) and a Sovereign Gold Bond program where they are attempting to have greater numbers of retail holders and rich temples surrender their physical gold in exchange for gold-backed interest bearing investments. What one pledges get melted, hence not ideal for treasured heirlooms. As noted, a big segment of the gold market is held in jewelry form.

Caol2CNW4AAznHs

Note: Looks like about 600 grams or so

Prime Minister Modi also announced in November 2015 the intention of launching an Indian Gold Coin (and Indian bullion). The 24 karat purity (0.999 fineness) coin has the national symbol Ashok Chakra on one side and Mahatma Gandhi on the reverse.

proxy

As a point of reference, the American Eagle (USA) and Krugerrand (South Africa) are both 22 karat purity (0.9167 fineness) whereas the Panda (China) is 24 karat (0.999 fineness), with a new coin design on a annual basis since 1982 and the Maple Leaf (Canada) is also 24 carat with “quad 9”, 0.9999 fineness. Conjecture will begin on when Trump might “Make the Eagle Great Again” and move to 24 karat as well. In it’s current form the American Eagle gold coin is 91.67% gold, 3% silver and 5.33% copper.

After all, “Life is too short for 22 karat”. JCG

CchDoJBW4AAVxX_

Comments »

EXXON MOBIL $XOM $12BLN 8 TRANCHE DEBT DEAL – NO BEAR HERE

Exxon took advantage of ultra low absolute rates to build on their war chest of liquidity, keeping the rating agency wolves from the door. XOM is rated Aaa/AAA and this monster bond issue matches Apple for the 2nd largest of 2016 year to date. Issuance is down considerably year to date by number of issues, but is only down 3% by volume given the huge scale of the issuance that has been brought to market.

The two biggest tranches at $2.5bln each were the 10 year (spread of +130bp to UST)  and 30 year (+150 to UST from initial price talk as wide as +180 over). Apple (Aa1/AA+) as a reminder came at +150 (20bp wider than XOM) and +205 in longs (55bp wider).

Very little to complain about here. A non gas & oil name could have purportedly come 25bp tighter, but these are very attractive all-in funding levels. Japan issued 10 year at a negative yield for the first time ever. German 10 years are at 0.10% (10bp) so you would have to hold to maturity to make 1%. The folly of this will become evident with the passage of time.

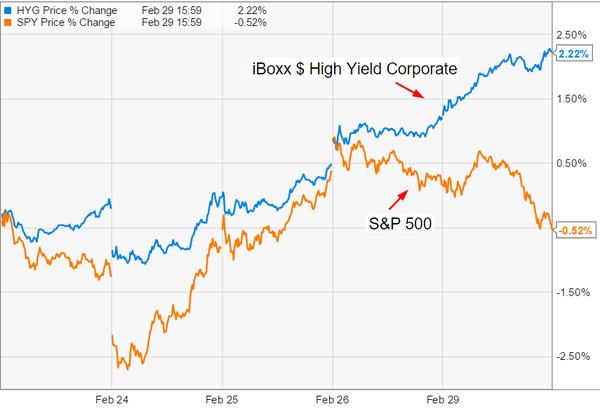
We stand with oil closer to $40 than $20 which is a good thing. High grade debt aside, we have seen a sizeable recovery in CCC rated debt and the high yield space has de-coupled from the equity market the last week of February (outperforming smartly with spreads tighter by 100bp in 2 weeks), a positive sign for risk assets for those focussed on looking forward. March is typically a positive month for risk assets.

91bf9f99-0d84-4eb6-aae1-bcbf5ddf2522

In related news, Goldman was finally able to get a challenging bond deal done for Solera, the Caa1 rated risk-management software company on the same day. The size was scaled back from $2bln to $1.73bln ($300mm in leveraged loan bump to make up the difference) on a 10.5% 8NC3 (8 year final, non-callable for 3 years) at a price of $95.00 for an effective yield of just under 11.50%.

Useful as a point of reference, as it gives you current “book ends” of what fixed income returns are achievable in the current market, Japan 10 year JGB -0.024%, 10 year German bunds 0.10%, 10 year US Treasuries 1.75%, 10 year XOM 3.05%, 8NC3 SOLERA 11.5%. JCG


Comments »

MAKE IN INDIA – CTRL ALT DEL

Most world Asia attention of late has been on China, for good reason. China is now the 2nd largest world economy after the US. India is the 9th largest economy in the world (GDP of $1.9tln, on par with Canada). China’s population is 1.38bln, India is 1.285bln (India per capita GDP US$1,500 or $6.00 per business day).

Trump’s advisors have chosen the “Idiot’s Guide to World Trade”  as their debate, if not pre-policy playbook and have equated imports to losing. Trump most recently expounded that  the US is losing $500bln a year to China. The USA’s net trade balance with China in 2015 was actually $366bln, made up of $482bln of losing (imports from China) and $116bln of export to China.

CcNSExCUYAAsgsU

Mexico ended up in the Trump campaign’s managers crosshairs by “winning” too much as well, to the tune of $50bln + per annum. The USA exports a sizeable 236bln to Mexico but imports almost $300bln for a $58bln balance of net losing. Oreos and car manufacturing aside, many more absolute jobs are being lost by the US to China than Mexico.

India does not rate on the losing metric it would appear. The net losing is only 2.5X Trump’s reported (waiting on US Federal tax filing) net worth at 23.2bln. The USA exports $21.5bln of goods to India and imports $44.7bln. India has 450,000 illegal immigrants in the USA (4% of total, most visa over-stays), well in excess of the 300,000 Chinese. No walls are possible of course, but a dam via the revised H1-B visa program (limiting Indian IT sector uptake) is under construction.

The USA only net lose $15bln presently to Canada, one of its largest trading partners at > 1/2 tln per annum (2-way). The trade balance is often in fact a “push” which will likely delay the North Wall, at least until Trump figures out how to get the wildlings to pay for it.

Incredible India is the successful tourism slogan currently in use. Modi’s “Make in India” program is meant to re-invigorate onshore manufacturing (the majority of the gains expected to come at the cost of China). With the domestic infrastructure issues in India, nobody expected a straight autobahn shot to success, but we have seen some interesting speed bumps as recently as this month. As with Africa, most of India has leapfrogged the PC era and gone directly to smartphones.

Freedom 251:

Cbr8RNLW4AIMhjD

Sometimes if it seems too good to be true, it likely is. This Make in India advertised Freedom 251 smartphone looks to be a hoax/scam. The sponsoring company is called Ringing Bells Pvt Ltd. The 251 hook is a reference to the price, Rs. 251 (US$3.65 at the current USD/INR exchange rate of 68.775 per US$1). Apparently over 700,000 eager Indian buyers have pre-ordered via paying the 251 Rupee to Ringing Bells. The alleged refurbished ADCOM handsets are made in China/Taiwan. The point of this post is not to highlight a $2.5mm phone scam, but rather to highlight that things are often not what they appear.

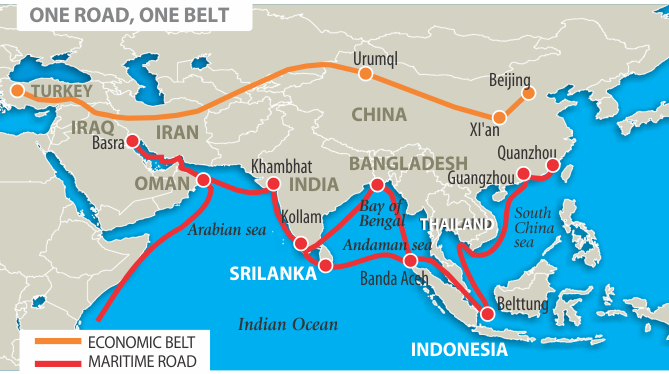
Even if China plays nice on the pace of RMB devaluation in 2016 and beyond, we are likely too see other forms of competitive devaluation via dumping of industrial goods (steel, etc.) via regional trade partners, facilitated by One Road, One Belt, aka the New Silk Road.

china-silk-road

They say that those who do not study history are bound to repeat it.

A full 30% of world trade comes through the Strait of Malacca (running between Malaysia, Indonesia and Singapore), a passageway between  India and China, used extensively for commercial trade. A full 80% of China’s energy imports come through the Strait of Malacca. Geopolitically, more concern has been evident on the activity of North Korea in the region. China’s chest pounding via naval build up in the South China Sea, as a means to mark their territory and expanding sphere of influence, is 2nd only to Putin’s free range aspirations in Eastern Europe in terms of import.

They say even the “Made in China” label is often “Made in India” these days. Major trading partners might be better served by setting a T-account for net losing with India/China as a trading block. JCG


search

Note: Freedom 251 background: (India – local press):

NEW DELHI:  As the makers of world’s cheapest Rs. 251 (less than $4) smartphone went gaga over being part of Prime Minister Narendra Modi’s “Make in India” and “Digital India” initiatives in last few days, a top government official clarified on Thursday that the government has nothing to do with “Freedom 251” smartphone.
“This is not a government project. ‘Make in India’ team has nothing to do with this,” wrote Amitabh Kant, secretary of department of industrial policy and promotion (DIPP), in a Twitter post.
The tweet comes on the heel of the fact that the government is already keeping a close watch on “Freedom 251” and its Noida-based maker Ringing Bells Pvt. Ltd.
On February 23, Communications Minister Ravi Shankar Prasad said his department is keeping a close watch on Ringing Bells. The minister said the Department of Telecommunications has inquired whether the company can provide phones at such a low price, which works out to less than US$ 4.
“This was done to ensure that there are no discrepancies later. If there are any, we will take action as per the law. Our department is keeping a watch,” Mr Prasad said in New Delhi.
Earlier, informed sources told IANS that the telecom ministry has done an internal assessment on viability of the handset ‘Freedom 251’ and found such a device cannot be offered for not less than Rs. 2,300-2,400.
Ringing Bells has promised to deliver 25 lakh handsets by June 30.
In an earlier chat with IANS over phone, Ringing Bells president Ashok Chadha said the company will hand over 25 lakh “Freedom 251” phones to the people who have registered for it online.
“I am hopeful that we will be able to start delivery latest by April 10 and finish well before the June 30 deadline,” Mr Chadha told IANS.
According to Mr Chadha, the company is looking to set up two more units – one each in Noida and Uttarakhand. But how fast the company is going to start the manufacturing and churn out devices is a big question.
Mr Chadha said that while the manufacturing cost of the phone is high, it will be recovered through a series of measures like economies of scale, innovative marketing, reduction in duties and creating an e-commerce marketplace.
However, how well is the little-known firm placed to achieve this task is not yet clear.
Taking the world by surprise, the company launched “Freedom 251” smartphone last week that, it said, has been developed “with immense support” from the government.
There are, however, some apprehensions about its final appearance and performance.
The Indian Cellular Association has also written to the telecom ministry, urging the government to get to the bottom of the issue as selling a smartphone this cheap is not possible.


Comments »
CONTINGENT CONVERTS – ANTI-CRISIS OR ANTI-CHRIST?

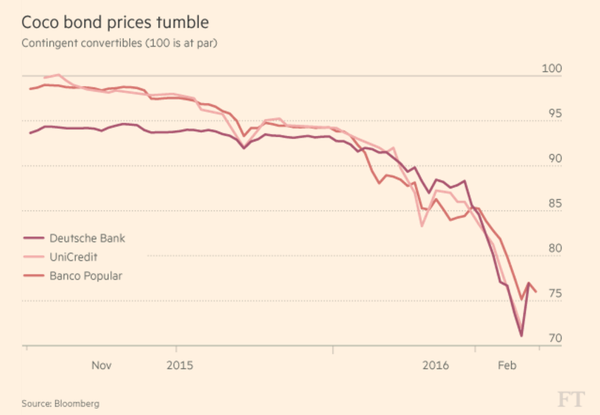
North American investors are likely still perplexed about CoCos, given the negative buzz (deserved) out of Europe in recent weeks.

CbBcDxAW4AAk03a

Note: Not good company to be keeping

Both the US and Canada banks issue preferred shares as their instrument of choice for AT1 (Additional Tier 1). In the case of Canada, rate reset preferred shares are the dominant instrument whereby the bonds carry a fixed rate for the initial 5 year period, then reset at a spread to the yield on the current Government of Canada 5 year bonds. These instruments have a non-viable contingent capital (NVCC) feature where they potentially get converted to equity. In the case of Canada, the bank regulator, the Office of the Superintendent of Financial Institutions (OSFI) is in the drivers seat. There are two triggers; i) a public statement by OSFI that the bank is or soon will be non-viable and ii) the acceptance of provincial or federal government support, without which OSFI would have declared the bank non-viable. This is an important distinction, NVCC securities convert at the point of non-viability (gone concern) whereas CoCos convert via set contractual triggers while the bank is still operating (going concern). At least some of the recent flow we have seen in European bank equity has likely been driven by CoCo hedging by institutional holders (the UK and others ban retail participation in CoCos). Canada’s aggregate bank issuer dominated preferred market is small at $57bln (versus a $1.4tln+ stock market), but dominated by retail, in part due to the preferable tax treatment (eligible Canadian dividends).

Under Basel 3 (B3), Tier 1 capital is split into 2 components; Common Equity Tier 1 (CET1) and Additional Tier 1 (AT1). Banks must maintain a minimum CET1 capital ratio of 4.5% and a minimum total Tier 1 capital requirement of 6%. The means by which AT1 is raised is not mandated. Banks could simply issue more CET1, but issuing AT1 securities in contingent form (CoCos) has been deemed more efficient from a capital perspective (cheaper than equity, and also counts toward regulatory capital buffers and leverage ratios).

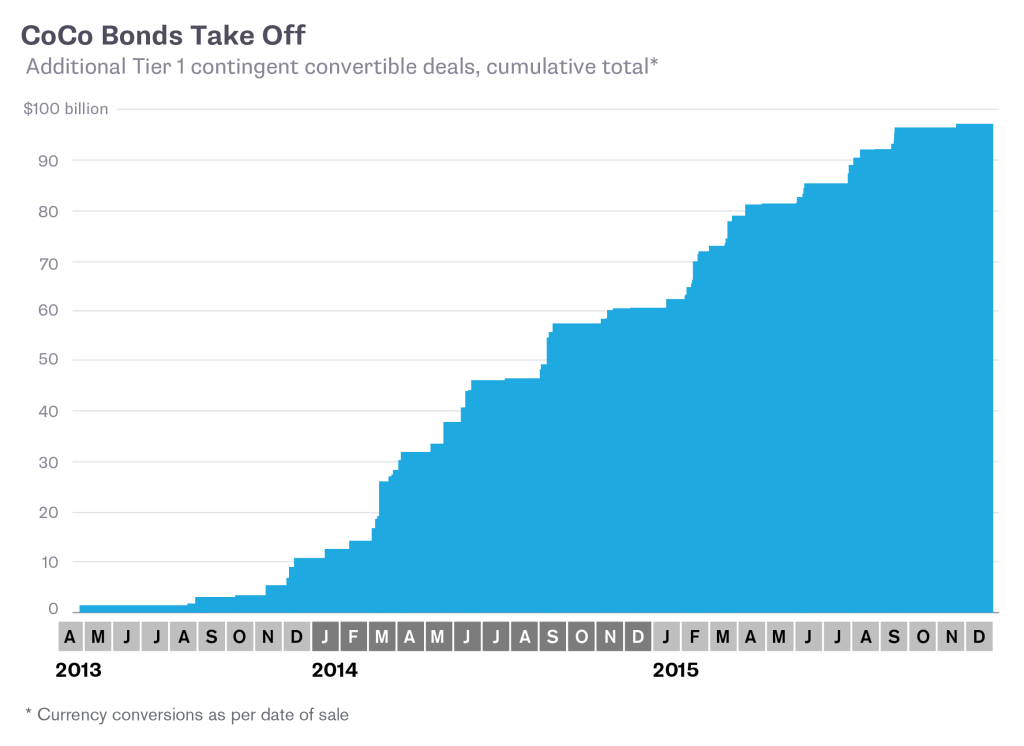
European banks have issued $97bln of CoCos since 04/2013 through the end of 2015. Of the EUR40bln incremental targeted for 2016, zero has been issued thus far in 2016 given the overall funk the markets are in and the particular pain for financials (Europe down 24% versus 19% for US and 36% for Japan).

CoCoThru2015

Contrarians looking to allocate fresh capital to this space should hunker down for some serious analysis. The legacy premium being offered for the “contingent convertible” feature was just too skinny in retrospect. The Canadian market has re-priced where relative value has emerged versus USD peer securities. Structurally there are differences in that US Bank prefs do not have explicit NVCC language. US prefs are issued at the holding company level, versus the operating company level for Canadian prefs, hence it is safe to surmise they are roughly comparable in terms of the potential for equity conversion in a tap out.

From a statistical modelling perspective we have had a negative 100 year event nearly every decade. This does not seem like an environment where you want to “sell the tails” too cheaply. Caveat Emptor. JCG

Comments »
APPLE DEBT: $12BLN 9 TRANCHE – GOOD TO THE CORE

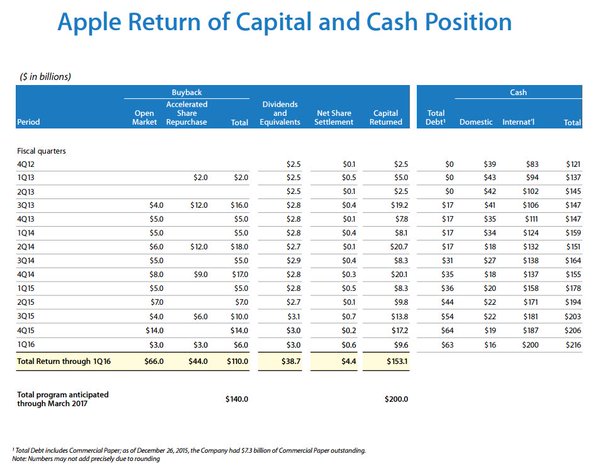
Apple brought a $12 bln debt offering today in 9 parts. This was the 2nd largest debt deal of this year after AB InBev’s $46bln deal. Many scratch their heads at why a company with as much cash as Apple has issues so much debt. The biggest reason is that Apple’s cash is largely held offshore, and to repatriate it would be costly from a US taxation perspective. Another reason is the pricing of the debt, due to the fact they had $26bln in orders (order book) for $12bln of bonds, which allowed them to issue at a tighter spread;

$500mm 2 year fixed printed at +60 US Treasuries (UST) versus guidance of +60 and initial price talk (IPT) of +75

$1bln 3 year fixed printed +80 UST  vs matching guidance and +90 IPT.

$500mm 3 year FRN printed L+80 versus matching guidance.

$2.5bln 5 year fixed +105 UST, in from +115 IPT.

$500mm 5 year FRN L+113.

$1.5bln 7 year green bond, +135 UST vs +145 IPT.

$2bln 10 year fixed +150 UST vs +160 IPT.

$1.25 20 year fixed +190 UST versus +200 IPT.

$2.5bln 30 year fixed +205 UST versus +215 IPT.

There is strong demand for high grade debt with no tithe to the oil & gas or mining & metals sectors. Apple is rated Aa1 by Moody’s.


The following details the split between domestic and offshore of Apple’s cash hoard, quite striking:

CbYfjUmW4AIPSlk

Moody’s noted that at the current issuance trajectory, Apple could have $100bln of debt by the end of 2017. There has been a great deal of debate on the merit of a tax amnesty on foreign profit for US corporates. It has been done before (5.25% instead of typical 35%), but it is not politically correct to suggest an election year is the time to do it again. There are risks to delaying. Tax inversions should be easier for cash rich tech companies that already outsource critical components overseas. JCG

Comments »

$20 OIL FALLOUT: RAPIDS – CLASS V, EXPERT

A betting man would likely place at least even odds on a $20 oil pendulum swing before we hit $50 again, if for no other reason to  its’ proximity to spot prices in the low 30’s.

oil_crash_660

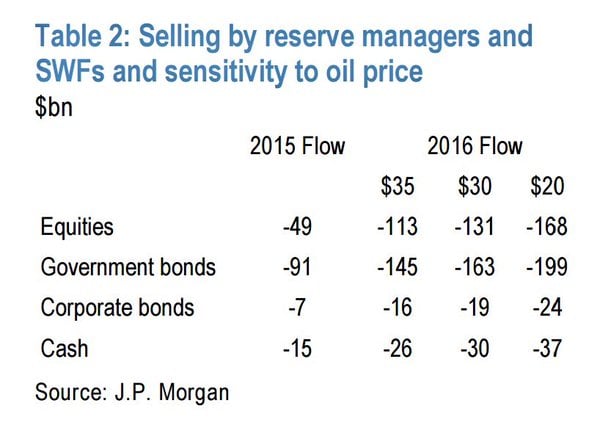
JP Morgan has issued some interesting research, modelling the asset divestitures (by asset class) likely seen from reserve managers and sovereign wealth funds (SWF) on a further downside trajectory in oil, to as low as $20 per barrel. Global FX reserves peaked at just over $12 trillion in August 2014. Reductions from that time have come primarily from China (approx. $700bln) and commodity levered economies. A decent current estimate is $11 trillion. SWF assets stand at $4.5 trillion, with 93% held by the top 10 funds, ranked by size. Half of the top 10 gained their girth via oil riches with the remainder plumped via long held general trade surpluses. If we were to see a $428bln divestiture in 2016 on a move to $20 oil by this approx $15 trillion war chest (2.9% of assets), I would characterize it as a “flesh wound”. Seems low. Check you VaR. Fat tail result observation likely (kurtotic distributions).

CbFIx-OW0AAgPfb

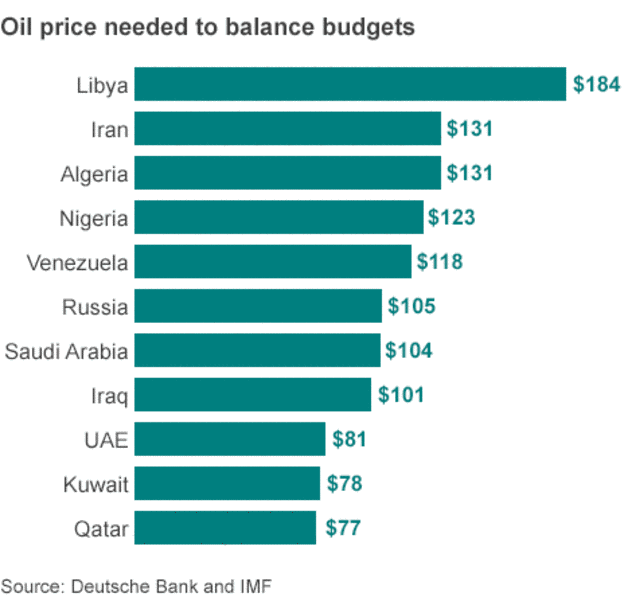
The stresses on oil dependent global economies had been well documented and as illustrated in the graph below,most need a snorkel if not a nitrox tank already. 4 of the “fiscally challenged” sovereigns below also have top 10 ranked SWF’s by size.

-Saudi Arabia. SAMA Foreign Holdings. Est. 1952. $762bln (14′), 100 of GDP, 2.6x expenditures, 65.0 x sovereign debt.

-UAE. Abu Dhabi Investment Authority. Est. 1976. $589bln (14′), 147% GDP, 4.8x expenditures, 5.3 x sovereign debt.

-Kuwait. Kuwait Investment Authority. Est. 1953. $548bln (14′), 321% GDP, 6.7X expenditures, 54.0 x sovereign debt.

-Qatar. Qatar Investment Authority. Est 2006. $304bln (14′), 144% GDP, 5.48X expenditures, 6.2X sovereign debt.

Source: Moody’s, IMF, SWFI

The most stressed nations at  current oil levels will be in straight jackets at $20bbl oil. As the dominoes of Venezuela, Nigeria and Libya wobble if not fall, it will likely make Arab Spring of 2011 look like a Tragically Hip concert.

_79755553_oil_breakeven_prices2_464gr

Many market pundits point to the fact that lower is oil is positive and will result in an eventual  GDP lift for most countries. MSCI World (-6%)  has significantly underperformed MSCI EM (-1.8%) over the last 3-4 weeks.

As James Grant recently put it, more eloquently than I might, “Surely, no such thing as a separate and distinct U.S. economy can be said to exist. There is rather the single dollarized and financialized and leveraged worldwide economy. Like it or not, we are all in this together – the Chinese communists, the European socialists, the Japanese statists and we the people.”

The amount of Gas & Oil related debt that will need to be re-structured and that will eventually default clearly ramps at $20 oil. Current default rate estimates are at 7%+ and it is difficult to envision that default rates do not get to the low teens if oil prices languish to $20 bbl from here. The list of global survivors left to pick up the pieces dwindles as well, impacting recovery rates. The public debt markets have been the funding avenue of choice in the latest energy build out cycle and while the Banks will certainly not escape unscathed, there will be enough pain to share with estimated industry debt at $700bln+.

USD denominated debt (non-bank) outside the contiguous states stood at $9.2 tln as at 09/14, +$3tln since 01/10.

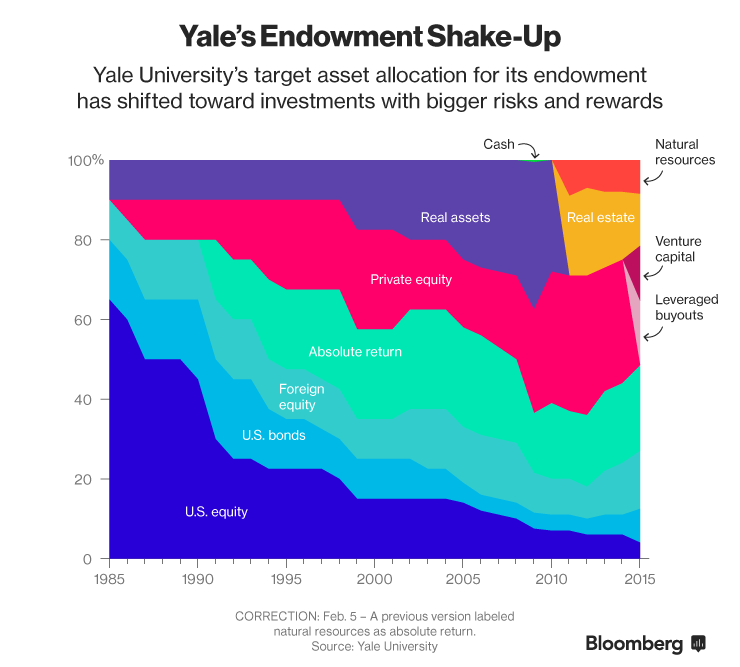
Cupped hands to make up for the reserve manager and SWFs asset divestitures are hard to find as the pension & endowment space revamp their asset allocation, largely away from the public markets in favour of private & specialty areas with higher alpha potential.

-1x-1

Liquidity is waning, and not likely to recover near term. Global regulations, regardless of intent, have had the effect of neutering the profit motive. The former commodity prop groups of the major global banks have largely been thrown to the winds with the most successful finding homes in the successful, albeit less stable trading houses (Mercuria, Vitol, Glencore, Trafigura, Noble, Gunvor, etc.).

Opportunities abound with so many cross currents, but the penalties for being wrong will be increasingly punitive. Asset redemptions, spikes is deficit spending/drawing down former surpluses, spikes in unfunded liabilities, credit downgrades (out of IG), increased civil unrest, increased protectionism and a ballooning global refugee crisis are all issues we will be dealing with in 2016 and beyond. JCG

Comments »
USD/JPY 100 – KATY BAR THE DOOR

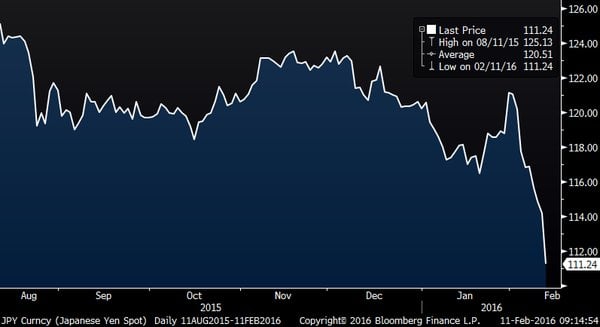
As a barometer for “risk off”, a rally in the Japanese Yen is spot on.

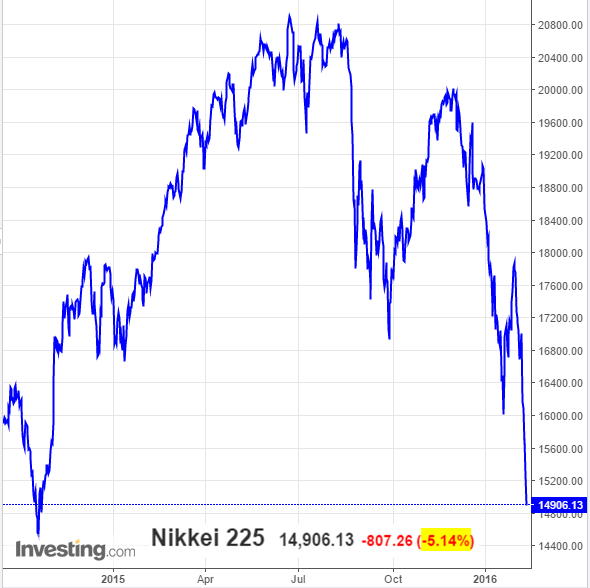
From the 121.70 USD/JPY euphoria level achieved post rate cut, we elevator shafted through 111 and even got into the 110’s before bouncing to the current 112.35. While 10 big figure moves in the world’s 3rd largest economy should be alarming to all, there is a good chance we get more. Barclay’s today forecast a further rally to 100 by the end of Q1 2016 and 95.00 by year end 2016 (prior YE 2016 estimate 120).

bcf3ec70-3388-4ab7-8eda-d2001a24c6ab

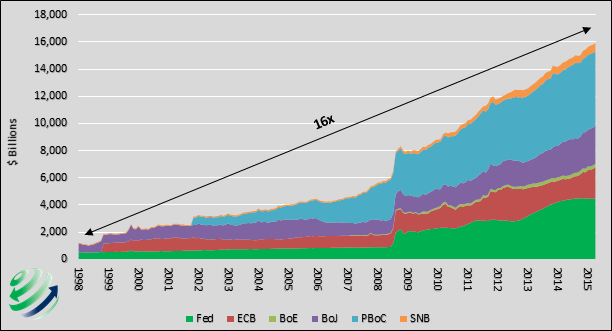
Central banks have officially run out of runway.

Bank-of-Japan

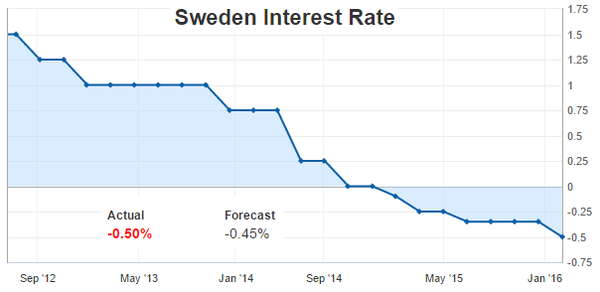
The Fed, EBC, BoJ, ECB, Riksbank (Sweden cut to -0.50 yesterday, submerged by 5bp more than the market expected and expanded QE purchases through reinvesting monies from maturities and coupon payments) & SNB’s goal of achieving 2.0% inflation in unison is not going to happen.

1f2e3a88-215b-4b23-ae56-ef4d8685e4d5

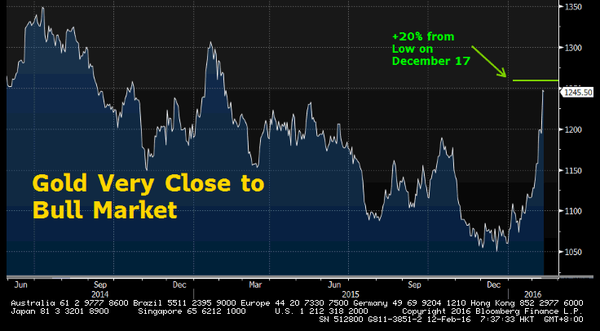
Gold has something different to infer from these moves it would appear. My modest allocation to gold miners will be tweaked (higher weighting) and DXJ (currency hedged Japan) jettisoned as wrong-footed folly. You have to trade what you see, not what you know (think you know).

4567c007-f231-4319-9068-5c4169747f9d

Japan Topix financials were down 24% since the very recent rate cut in Japan (the market is further dissolving today as they return back from vacation). Mitsubishi UFJ entered the jaws of today’s market trading at 49% of tangible book, Mizuho 66%, Sumitomo Mitsui 52%. For reference Bank of America trades  at 80% of tangible book. What is the liquidation value of a Japanese bank? Where does that bid come from? Not even Citi could make a go of it and sold their Japan franchise for less than $1bln. Even Ford is packing up their Japan tent and going home.

a306862e-03bf-4ac3-a3ce-2baa0f0303dc

The reasons for such apparent “distressed” bank valuations is clear, the lifeline of higher rates is further beyond the grasp of banks globally. Yellen, Gundlach, Bass, JP Morgan, etc. talk about and research negative rates as if it is a “normal” conversation to be having.

There is an ebb and flow to the relative valuation of financials, but historically the equity markets struggle without the participation of financials. Going forward, bank balance sheets will more fortress like, less levered, and more conservative in their make up. CoCos (Contingent Convertibles) will make up a bigger proportion of the capital structure as there will be no “put” to their respective governments. Credit ratings will be lower, as no “lift” from implicit government support should be implied or expected.

Coming back to the car analogy, gone are the days of the V8, 4 cylinders, hybrids and full on electric are in vogue. Adjust your return expectations accordingly. JCG

Comments »
OVERWEIGHT JAPAN

I am very bullish of the Japanese equity market, largely on a currency hedged basis. DXJ is my preferred means of garnering exposure. On a valuation metric, Japanese equities are cheap. In terms of weighting, a market capitalization weighting for Japan would be 8.02%, “Japan Lite” would be 6.02% (75% mkt cap weighting) and GDP weighted would be 5.33%. As I am underweight EM until further notice (est. 2020), I have also put this weighting in my Japan bucket for a round 10% (fully hedged as to currency). Exposure to Japan gives you a lot of EM exposure by default and increasingly Japanese firms are outsourcing the intermediate stages of production in favor of final stage and highest value add onshore. At USD/JPY 135.00 (est. Q1 2017), I’d be inclined to pare the currency hedge back to 50%, the “no remorse” hedge ratio.

The Japanese equity market peaked at 38,000 in 1989. The low was 7,400 in 2009 (17,191 currently). The Nikkei’s absolute level is often dictated more by foreign investor flows than onshore with a low 6% retail participation rate in the stocked market. The comparable participation level for the USA is 33%. Many foreign asset managers have at least moved from underweight to equal weight on Japan in the last 2 years. Beyond nitrous stock boosting QE, another sizeable catalyst is the monumental asset re-allocation of GPIF (Government Pension Investment Fund), the $1.25 trillion behemoth pension fund for Japanese Public Sector Employees (3X CalPERS size and $200bln bigger than NBIM, Norway’s colossal oil funded sovereign wealth fund). The big shift is largely from bonds to stocks (both domestic and international) and while “taper” in not yet in the Japanese jisho (dictionary), GPIF and the BoJ are likely sharing the play book, if you know what I mean.

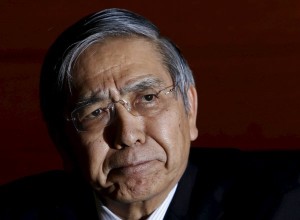
Bank of Japan (BoJ) Governor, Kuroda-san continues to deliver the QE goods and in addition to the spectre on negative rates, introduced for the first time on Bank reserves (-0.10% from 0.10% ) last week on potentially 250 trillion JPY of Bank reserves, new tools are being developed to achieve the BoJ’s price objectives (2.0% inflation or bust).

CaQjfCmUkAEjFlo

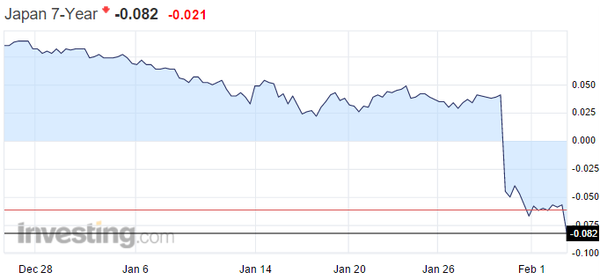
Having lived in Japan for 3 1/2 years (and visited on 25+ occasions since), I know what a perplexing market it can be. After 3 weeks of the ground one thinks they know, i) What is wrong with Japan and, ii) How to fix it. After 3 1/2  years all you can say is, I lived on Japan for 3 1/2 years. There is even a phrase for the folly of shorting JGB’s (Japanese Govt Bonds), the “widowmaker” for the number of traders that have been carried out employing the strategy over the years (definition of a Rates trader is someone who finds a trend and fights it). Even the doctrine of the time value of money has been exorcized by unconventional monetary policy (the Japanese curve is now negative to 8 years and 10’s have been in a 4-6 bp range this week, an all-time low yield for the 10 year maturity).

9616d902-590b-4821-873d-fd564623bf0c

Years ago, one would have thought the downside on a short position in bonds would be bound at zero, yet we now stand with trillions of government debt (>22% of global GDP equiv.) trading at negative yields. Japan’s QE has been unique not just in terms of its scale (a full 75% of GDP) but in terms of the asset classes they purchase under their broad mandate. The bulk of the G10 have their balance sheets bloated with bonds exclusively. Japan gorges on bonds as well of course, owning approx. >70% of the market, but they also but corporate bonds, REIT’s and equity ETF’s (estimated to now own 50% of the o/s ETF market).

search

Fuji-san: A worthy “bucket list” climb. An active volcano, hence note the Japanese expression, “Only a fool climbs it more than once.”

Global sovereign debt now stands at $59.7 tln. The US is the obligor on 29%, Europe 26%, Japan 20%, China 6% and Rest of World 19%. Metrics like debt to GDP are important, but who owns the debt is just as important. Before the Global Financial Crisis foreign ownership of JGB’s was a paltry 7%. The number for UST was 56% held by foreigners, but with a Fed balance sheet exceeding $4.5 trillion the percentage is comfortably below 50%. If the Fed’s balance sheet were the same relative size at the BoJ’s it would be in excess of $14 tln.

Japanese corporations are very selective about how they deploy their liquidity. Cash & equivalents held by Japanese listed corporations total $1.4tln versus $1.8tln for US Corporations (the Japanese economy is approx. 1/3 the size of the US). Japan is a highly innovative country, holding a full 1/3 of all global patents. Japan is highly homogeneous with 99.38% of the populace Japanese (less than a million foreigners out of a 127mm population).

There is always a great deal of discussion on the poor demographics of Japan. In 1910 Japan has 50mm people versus the current 127mm and with the current birth rate (1mm per annum) and immigration policies they will round trip to 50mm by 2110. Underlying trends are changing though. People are getting married later. There are more women entering the work force and entering the real estate market on their own instead of waiting it out for Mr. Right at their parent place in the burbs. Japan real estate has been hot, up > 20% over the last 2 years. Rentals yields have come off the highs (8-9%) but are still very attractive for a developed market. Foreigners are competing as the bid increasingly (often Chinese but the palette is broadening) against the local Japanese, and with 35 year mortgage rates at 1.35% this week, their is a clear domestic advantage. Tokyo is a sprawling metropolis, with Tokyo-Yokohama holding the record as the world’s most populated urban area.

imgres

The 2020 Summer Olympics are yet another catalyst for a more inviting and worldly Japan. Versus their “stretch” plan for 20mm @ tourists by 2020, Japan had 19.73mm in 2015, up 47.3% in number and 71.5% in spend (3.48 tln JPY) over 2014. Again, the Chinese dominate the flow at 40%. Japan is making great effort to further press the momentum coming into the olympics with 10,000 English signs being installed and more subtle tweaks like allowing tattoo sporting guests to enjoy the sprawling network of natural hot springs peppered throughout the land. Most establishment have a long standing ban on ink as “unclean” but it has more to do with the fact that in the old days only the Yakusa (organized crime) had tattoos.

Japan has < 2% of the world’s population and yet has 15-20% of world wealth (even after a 26 year bear market). As noted, traditional analysis can be daunting. I like to look at Japan as a big insurance company that uses its own currency. The drive is there, the work ethic is there, but if they were forced to annuitize, they would still be much better off than most of planet Earth.

These are the key reasons I’m bullish on the Japanese equity market, but the currency hedging decision is a critical component. JCG

Comments »
O’ CANADA – WE’RE GOING TO NEED A BIGGER GUN

As has been well chronicled on this web site, all is not well with the commodity complex. For a wealthy, developed nation Canada has a heavy reliance on primary industry. Canada is one of the few remaining AAA rated sovereigns credits. Canada is a 1st world country with a 3rd world currency. Much has to do with the high correlation with oil, it has always been high at 0.80, but has been running at 0.94 of late.

Combined, the Oil & Gas and Mining & Metals sectors make up 35% of the stock market in Canada, versus 16% in the US. Both Canada’s population and economy are about 1/10th of the US (34.75mm & $1.5tln respectively) and trade flows run predominantly North/South, 73% of exports and 63% of imports are with Uncle Sam.

“Just Like The States” is a compliment old timers still use for a job well done and approx. 85% of Canada’s 34.75mm people live within 100 miles (165 km for the bulk of the world on the metric system) of the US border. Canada’s unemployment rate stands at 7% (all US states are below 7% with the whole a low 5 handle) yet there is a high degree of regional disparity, with some in the double digits. There are only 4 cities in Canada with populations >1mm (Toronto, Vancouver, Calgary and Montreal).

Energy in the form of oil, primarily from Alberta (oil sands), Newfoundland (offshore), and Quebec (hydroelectric) along with metals, agricultural products, and forest products make up over 58% of exports. Autos, machinery and equipment make up 38%. Exports make up approx. 32% of GDP

The oil downdraft has had the largest effect on Alberta and the situation is not likely to improve in the near term. Much of the pipeline infrastructure focus has been on southbound KeyStone XL – Stage 4 which has been blocked by Obama (will Trump want naming rights to approve?). Part of the solution to the oil conundrum will be improving the mobility of trade across Provincial borders, with the added advantage of being able to settle in Canadian dollars. Justin Trudeau has arrived in the Prime Minister role (centerfold actually), bringing the Liberal party back to power with great fanfare and has promised spending of C$60bln over 10 years on infrastructure, with a front-end weighting. A portion of the infrastructure spend with likely be on critical intra-Canada linkages. While there are less viable road and rail options for this purpose, the Energy East pipeline and Trans Mountain pipeline twinning project are the two major proposed pipeline projects taking Alberta oil both East and West (in higher volume) respectively. New environmental hurdles have raised questions about the governments support for the pipelines, but in the end they make too much economic sense to not advance. This improved infrastructure would reduce and potentially eliminate the reliance on imported oil, which costs Canada > $20bln per annum. Venezuela and Nigeria are both on the watch list for major civil unrest in 2016, largely due to the swoon in oil prices. Canada also imports oil from the US (roughly 1/2 of the 630k bbl per day imported versus Canada’s 2.7mm bbl a day habit), Norway and the UK. Azerbaijan, requesting $4bln in aid this week is the canary in the oil well. Brazil and South Africa (who just hikes short rates by 50bp to 6.75% yesterday to put a finger in the ZAR dyke yesterday), are also markets to watch for 2106.

The structural decline of the auto segment in Canada is a much tougher nut and there is almost no degree of currency depreciation that can bring production back above the 49th parallel. The first wave of market share losses were dolled out by manufacturers establishing non-union plants in the Southern US States. More recently, Mexico has been growing significantly, no longer hampered by a perceived product quality gap. Canada’s unit automobile production (centred in Ontario) is down to 2.3mm unit per annum which is 24% below peak levels (99′).

No export discussion can leave out China. The Chinese Renminbi broke into the top 5 payment currencies in 2015, displacing the Canadian Dollar (CAD) to 6th rank. China had held the Yuan (CNY) steady in the face of significant easing by most of its trading partners up until August 2015 and still gained 3% world export share (to 13% from 10%). Read: China does not need a cheaper currency to be competitive. On the capital flight question, how much would China have to devalue the currency by to dissuade those so inclined  from moving? A lot is the answer, hence the worries of a 10-15% de-valuation by China is overblown. There will likely be modest depreciation versus the USD going forward (inside of 5%), and relatively sanguine fluctuations should be expected versus a basket of their trading partners (which is PBOC’s eventual intent). China runs a very large current account surplus (2%+ of GDP on a US$10tln+ economy) and there will likely be a spike going forward as the rate of domestic investment will fall at a much faster pace than the savings rate falls. Flooding the global markets with industrial goods when protectionism is on the rise is not a formula for getting along, but get along we must.

Canada has a vast advantage over the US in two key areas. Corporate taxes are a full 13% lower than in the US. Canada has the most educated population in the OECD with 51% of adults aged 25-64 having finished post secondary education (OECD avg. 31%). Canada heavily subsidises education and the world class ranking of the top schools attracts many foreign students.

As a developed market, birth rates are modest at 1.6 children per woman (2.1 required for a stable population base), but Canada has a long standing immigration policy that ensures, at least from a demographic perspective, that Canada keeps growing. Immigration to Canada is 260,000 per year (US is 1mm, 10x would be 2.6mm), 0.74% of the country’s population per annum (10% of those in the refugee category, 7% for the US). Life expectancy in Canada is 81.24 years versus 78.74 for the USA.

Canada is the 11th largest economy in the world, representing 2.9% of world GDP. Canada is home to 68 of the top 2000 companies in the world, for a tie for 5th with France.

Last week CAD and SGD, the Singapore Dollar traded at parity for the first time in 21 years, at 1.43 per USD. The commodity super cycle took CAD/SGD to near 1.60 over that 2 decade + period.  Singapore has none of the resource riches that Canada boasts, yet is has largely through will, minimizing graft and superior execution created the largest financial centre in South East Asia. The parallels to North America are strong, Hong Kong is like New York, Singapore is like Toronto. Singapore is one of the largest shipping centres in the world, depending on metric of throughput or value Singapore is often #1 (currently #2 to Shanghai). Singapore recently displaced Tokyo as the 3rd largest global fx trading centre after London and New York. Singapore boast > 30,000 multinationals that run their regional treasury centres for Asia (and in many cases broadened to include Europe and MENA) from a Singapore base.

Faced with the opportunity Canada has at hand, Singapore would have a crack team of government officials on tactical missions to entice multinational firms to relocate to Canada. Based on corporate taxation differentials alone (-13%), tax inversions make abundant sense. The grass is greener on the other side largely because it is fertilized with bull*hit, but in Canada’s case, the merits are largely beyond assail. The cash laden US tech sector in particular would be fertile with targets to entice to Canada’s Silicon Valley, Kitchener-Waterloo, Ontario. EDC, The Export Development Corporation of Canada, an Agent  of her Majesty in right of Canada (AAA/Aaa) stands at the ready to insure global trade.

Resident of Canada’s largest cities (Vancouver & Toronto) are admittedly over their skis with respect to residential property valuation at present (by 20% at Fitch’s latest tally), but even a modicum of success in leading a migration north of corporate America would make it look dirt cheap 3-5 year out.

Why did the Canadian cross the road? Answer: To get to the middle. Trade accordingly. JCG

Note: Author is a Singapore based Canadian, originally hailing from Cape Breton, Nova Scotia. Follow me on Twitter @firehorsecaper


Comments »