iBankCoin
Home / firehorsecaper (page 6)

firehorsecaper

Tokyo based, expat Cape Bretoner. Learning to live in a de-leveraging world. Better suited to the crusades. CFA & FRM charter holder. Disclaimer: @Firehorsecaper reminds investors to always perform their own due diligence on any investment, and to consult their own financial adviser or representative when warranted. Any material provided is intended as general information only, and should not be considered or relied upon as a formal investment recommendation.

RBS G SERIES PREFS: I READ THE TEA LEAVES – I BUY

RBSPRG2016041817399

Pref shares are not everyone’s bag, especially is an equity centric investment world. Regardless, prefs hold an important place in the capital structure, ahead of equity in terms of ranking, but behind debt. Prefs are typically issued with a par value of $25.

Bank equity has has an awful start in 2016, globally. Instrument selection can be as important as sector selection.

ServletCharts

Royal Bank of Scotland (RBS) had issues well ahead of the 2008-2009 Global Financial Crisis (GFC). RBS devoured ABN Amro in 2007 (then the 8th largest bank in Europe), which was the equivalent of a python eating an antelope (hooves and all). In truth, other hyena were recruited in the pursuit, namely Fortis and Santander, but the bulk of the kill fell to RBS to digest. By the end of 2007 the RBS balance sheet was US$3.7tln (at GBP/USD exchange rates at the time). Enter the GFC. Enter the cavalry, enter the Queen. Between Dec. 2008 and Dec. 2009 The United Kingdom infused £45bln (US$64bln) into RBS, more than 40% more than the US Treasury pumped into Citi (US$45bln),to keep financial Earth from spinning off its axis.

I had been partial to the 7.25% RBS T Series prefs since coupons were restarted a couple of years back. I have a 4% allocation. As the T series prefs are trading in line with the issuance price of $25, yielding 7.23%, a call by the issuer is effectively a “wash” aside from re-investment risk.

RBSPRT2016041819498

A learned ex-colleague asked about the relative merit of the RBS 6.08% G Series prefs a few weeks back, first leading me to scoff at the sub-optimal current yield versus the 7.25% coupon  T’s. Further analysis yielded much more information, and a timely Grant’s article in the April 8, 2016 issues titled “Least to Beast” with detailed input from Daniel O’Keefe, PM at Artisan Global Value Fund led me on the path to clarity.

The UK would like to show further progress on repayment of their bail out of RBS. The USA has since extricated itself from Citi ownership and even Lloyd’s has started paying a common dividend again. While some progress has been made, the UK government still owns >72% of RBS (down from 90% +).

The crux of the superiority of the 6.08% G series prefs at $24.03 over the 7.25% T at $25.06 lies deeper in the capital structure of RBS. The G’s were issued by RBS Capital Funding Trust VII. RBS Holdings N.V. (NV) is a wholly owned sub of RBS Group PLC (The issuer of the T’s) and holds the legacy assets of the 2007 ABN acquisition. Asset sales over the last 7 years have taken the NV unit assets to £19bln from £667bln. NV is better capitalized than the parent with tier 1 at 17% (parent tier 1 was 15.5% at 12/31/2015), a total capital ratio at 35% and common equity representing 19%+ of assets. NV carries a very high regulatory cost. Post-crisis protocols call for each regulated entity of RBS to have its own recovery and resolution plan. In summary, too much capital tied up in what is now an insignificant Amsterdam subsidiary. RBS’s total assets as at 12/31/2015 were £815bln, NV 2.3% of the total.

RBS has a total of US$3.3bln in prefs issued by NV, G, E & F (G series US$1.8bln). The play is to buy the G series pref on a potential take out at $25 by 05/18/2017 for a yield to call of 10.29%. The prefs are callable anytime after 05/16/2016. While you wait, the 6.08% coupon (6.33% yield) is a qualified dividend for US tax purposes. RBS could of course tender for the G series for less than $25 (par), but at $24+, it is not likely, given the negative signalling effect. RBS recently (Mar. 22, 2016) returned another £1.2bln owed to Her Majesty’s Treasury (HMT) and retired a class of prefs called the “Dividend Access Share”, paving the way for a common dividend in the not too distant future. JCG

Note: Long RBSPR 7.25% T Series (4% weighting), long RBSPR 6.08% G Series (2% weighting) from last week ($23.68-23.75) and long LYG common on recent resumption of common dividends. No wht (UK) and interest not taxable in Singapore on RBS prefs. Core holding.


Comments »

OBAMA 15′ TAX RETURN – THE TAX MAN IS GLOBAL

President and First Lady Obama have filed and disclosed their 2015 US tax returns. On 2015 income of US$436,065, the Obama’s paid US$97,489 in taxes (the bulk Federal at $81,472) for a tax rate of 22.4%. Charitable contributions were a sizeable $64,000 (15% of their adjusted gross income) which skews the numbers considerably for those ready to skewer their tax accountants (you pay a lot more). The Illinois State Tax rate was recently as high as 5% but sunset back to a 3.75% rate as of Jan. 1, 2015. The Obama’s paid $16,017 in State tax to Illinois (3.7%).

There are many jurisdictions where state tax bite would have been a lot higher. NJ is a timely example, which has the 3rd highest taxes in the US (income taxes, property taxes, estate taxes and inheritance taxes). 40% of the NJ budget is funded by personal income taxes with a full 1/3 collected from the top 1%. The highest personal income tax rate is currently 8.97%. A special 10.75% millionaire bracket has been proposed but Gov. Chris Christie has vetoed repeatedly. Only a small percentage of the 1% have cement shoes, even in NJ, and they have lost a high profile golden goose to Florida for the coming tax year. NJ’s #1 taxpayer, David Tepper (58, has a net worth estimated at $11.4bln), has taken flight after 2 decades, setting up a branch of his Appaloosa fund in South Beach, Miami and listing his condo there as his primary residence. People can vote in many ways in a Democratic society and New Jersey should fully expect more to vote with their feet. Florida has no state income tax or estate tax.

I thought it would be instructive to show what the Obama’s 2015 tax bill would have been in other world jurisdictions.

who-pays-the-most-tax

France up is first, Paris of course. Tax rates are very high. For the level of income the Obama’s report on their joint filing, France would extract $185,057 in taxes for a tax rate of 42.4%. Over half of France’s inhabitants pay no income tax. 14% pay 30% for EUR26,792-71,826 band of income and only 1% pay the 45% rate, applicable to income above EUR151,108. There is a 66% credit (up to 20% of income) for charitable giving which greatly reduced the tax liability in the Obama’s case.

Canada is not far behind, but remember this analysis is for the 2015 tax year. The new Liberal government has raised taxes on the wealthy, defined as those making > C$200,000 (US$155,083) by 4% to 33% (Federal). Provincial taxes are high in Canada as well, with Ontario’s highest rate at 13.16%. Assuming the Obama’s hung their touques in Toronto, the tax bill would be US$165,179, for a tax rate of 37.9%, again tempered by the charitable donation of C$82.560. The top marginal tax rate in Ontario for taxpayers making > $200,000 for the 2016 taxation year is 53.53%.

-1x-1

United Kingdom, sunny London of course. The tax bill would be US$181,470 for a tax rate of 41.6%.

Singapore, Republic of Singapore. With no charitable deduction, the Obama’s tax bill for 2015 would have been US$71,293 or 16.3%, but a generous incentive program was in place for charitable giving in 2015, Singapore’s 50 year Anniversary year. The amount of the qualifying gift is grossed up by a factor of 300% for 2015 donations (normally 250% through 2018) which would have resulted in the Obama’s tax bill being $32,893, for a 7.5% tax rate (lower than NJ State tax for reference).

The US Federal tax code stands at 74,608 pages, by far the most complex of the countries mentioned. The average tax prep cost in 2014 was $273. The cost for all parties, including collection (IRS) calls for simplification of the tax code.

While a progressive tax system on balance makes the most sense globally, for developed economies, there are limits to the tax freight paid by the 1%. It is difficult to determine the exact breaking point, but when it comes, the golden goose can take to the skies for friendlier climes through both legal means (relocation) and via “structuring solutions” mired in the complexity of global tax policy (Mossack Fonseca et al). JCG

Note: The charitable laws of the US and of other nations reflect the notion of territoriality or the restriction of tax relief to those charitable contributions made only to domestic charities.

FX rates used; USD/CAD 1.29, USD/SGD 1.36, GBP/USD 1.42, EUR/USD 1.128.

Comments »

FRANCO-NEVADA CORPORATION – A GOLD ROYALTY PLAY TO PONDER

Franco-Nevada Corporation (FNV)

Gold has kicked off 2016 with the strongest rally in 25+ years,

Franco-Nevada, has a market cap of > $10bln and is up 45% in the last quarter (56% of Barrick’s $18bln market cap and 72% of Goldcorp Inc.’s $13.75bln) . Those looking to basis trade in the gold space, or those vetting new exposure to the precious metals space should dig deep into the 26 page slide deck by Pierre Lassonde, Franco-Nevada’s Chairman, which was just presented at the most recent Grant’s Spring (April) Conference in New York. Much of the information contained was in their March 2016 Corporate presentation, but the manner in which all naysayers are neutered via this enlightening presentation is impressive indeed. For one, few will be aware the degree of demand emanating from Europe, now the largest bar and coin market in the world. China and India are typically all that anyone hears in terms of the demand equation.

The case for FNV versus ETF’s like GLD are perhaps most compelling where a running ETF fee of 0.40% (40bp) is upgraded to an instrument with a dividend of > 1.2%. Like the GLD ETF, FNV investment protects investors from the risk of operating companies as Franco-Nevada achieve their exposure to the space via securing royalty streams. In terms of focus FNV is 95% precious metals (73% gold and 16% silver) and would not likely deviate much from this level to retain “pure play” status. Geographically 84% of their royalty income if from the America’s, lessening the risks inherent in frontier markets. FNV currently carries no debt and when they opportunistically do take on leverage, like the most recent $500mm Precious Metals Stream purchased from Glencore (Antapaccay, Peru gold mine output underlying), it is typically paid back promptly from free cash flow. A total of $1.2bln in facilities are at their avail which allows FNV to scout for the best opportunities in terms of both price and fit with their broad existing portfolio.

Lassonde, Pierre Spring 2016 (1)

As discussed in prior post, the merits of precious metals as a component to a diversified investment portfolio can be argued, but are compelling overall. Personally, I tend to trade in the asset class on a tactical basis, rather than as a core holding. A 10% allocation (via Fidelity Select Gold, FSAGX) in one of my larger accounts allowed other equity beta risk to be retained through a rough Q1 resulting in a 6.45% ytd return (versus 1.9% for the S&P through Friday).

The gold, gold miners, and gold royalty trajectory has been near straight up for a quarter, hence caution is warranted on allocating fresh monies. Both GDX and FNV are up 46% ytd including dividends. FNV is within 4.34% of its all-time high. Even a modest retracement of the recent USD weakness could see gold trade down to sub $1,200 an ounce, which could create an entry point. FNV’s Exodus hybrid score is a neutral 2.32 at present. When the time is right to re-enter, I think I have found my instrument of choice. JCG

Note: Other players in the gold royalty space include Royal Gold Inc. (RGLD) which is about one third the size of FNV and has a matching Exodus hybrid score of 2.36. Osisko Gold Royalty (OR.TO) trades on the TSX (trades in Canadian Dollars) and has a market cap of about US$1.2bln. FNV trades on both the NYSE and the TSX, but with more volume of the USD denominated NYSE counter.


Comments »

PUERTO RICO – THE SPOILS OF WAR

“Puerto Rico’s Sinking and I Don’t Want to Swim” was the other top candidate as a header. The current maelstrom has many questioning how the US got into this mess in the first place. Spain controlled Puerto Rico for 4 centuries, from 1493-1898. US victory in the Spanish-American war of 1898 saw Spain cede the Island of Puerto Rico to the US under the terms of the Treaty of Paris. The Spanish relinquished control of Cuba, Guam and the Philippines as part of the same conflict, which lasted a compact 10 weeks (fought in the Pacific and the Atlantic, obviously).

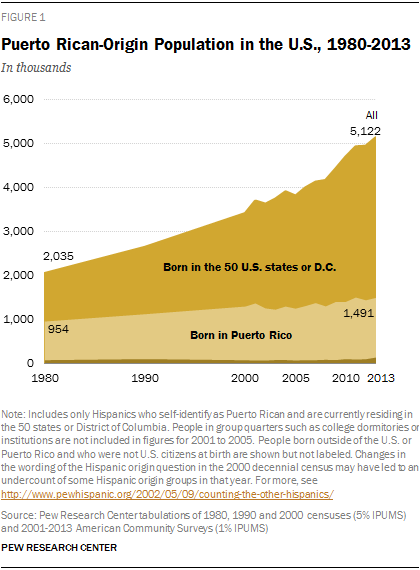
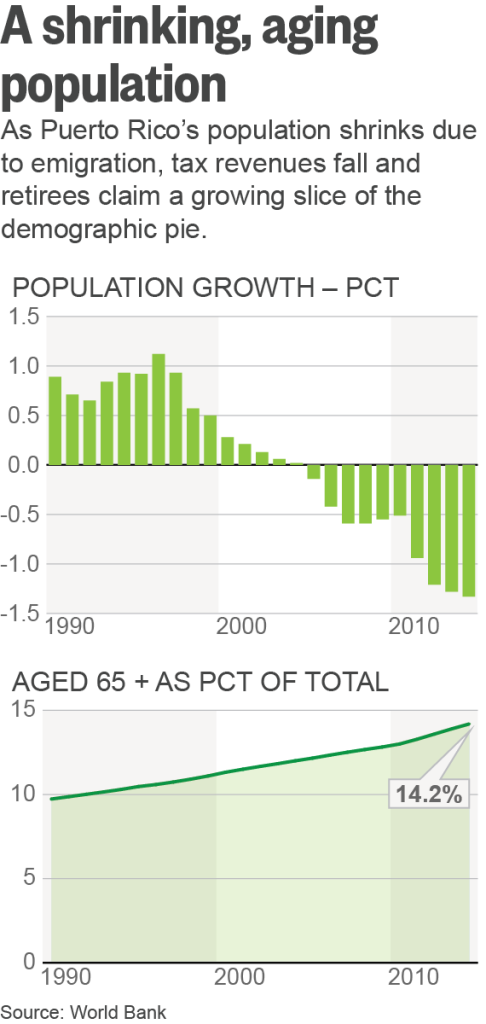
At the time of the 1898 handover, Puerto Rico (PR) had a population of under 1 million (Florida’s Puerto Rican American population is now >1mm). The island population is now 3.6mm, and it has been dropping drastically, as the prospects for the Commonwealth (notably not yet a State) have deteriorated markedly. The 10 year phased roll off of Section 936 tax exemptions for PR domiciled manufacturing under Bill Clinton in 1996 was a partial catalyst. The poverty rate stands at 45%. Labor force participation is low with 41% of the working population opting out (choosing not to work). A full 30% of the employed work for the government. Official unemployment is in the mid teen’s. 40% of personal income in PR comes from transfer payments from Uncle Sam and further 27% of the population is on food stamps.

The US$10bln plus in annual US subsidies to the Commonwealth of Puerto Rico (officially termed “stimulus”) is clearly not the long term solution. An unbroken chain of 7 year of PR recessions (shrinkage in GDP is entering the 8th consecutive year) has been the recent reward. Clearly, allowing an unincorporated US Territory admission to the Union as a State is not the path to salvation either.

There are now more Puerto Ricans living Stateside that there are living in PR (60%/40% split as of 2014). 5mm (including those of Puerto Rican descent), Puerto Ricans live in the US, 29% of them having been born in Puerto Rico. Worthy of note is the fact that the Jones Act of 1917 made all Puerto Ricans natural born citizens of the United States. The last thing we need at this juncture is a sea wall.

PH_2015-09-15_hispanic-origins-puerto-rico-01

PR-POPULATION

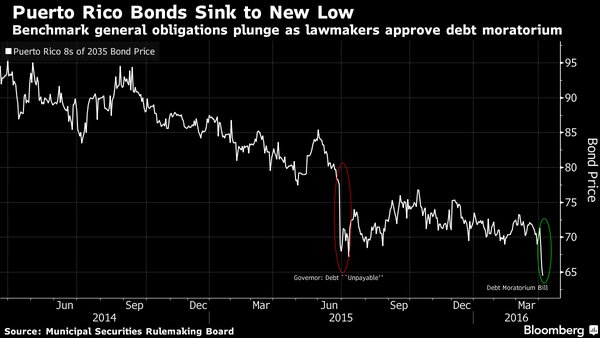
Puerto Rico is all over the press this week on the actions of the PR government to halt payments on their debt through declaring an “Emergency Period” for the GDB (Government Development Bank for Puerto Rico), their financial nerve centre. Governor Padilla previously termed the debt as “not payable” in June 2015. There is a $400mm + interest payment due May 1st hence the “come to Jesus” moment will be soon upon us. There have been efforts to restructure for certain. PREPA (PR Electric Utility) bond holders took a flesh wound haircut of 15% in November 2015. The Commonwealth of Puerto Rico has issued debt via 18 different issuers over the years. COFINA, linking bonds to sales tax receipts has been a popular credit (both insured and uninsured).

While not currently allowed by law (US Congress is working on giving PR the same rights that other US municipalities have under US Bankruptcy laws) a full white flag surrender by Puerto Rico would result in the 7th largest debt default in history. The effects would be far reaching. The full debt tally is pegged at US$160bln or about $44,000 per capita. California, as a comp, is at $11,000 per capita in debt. Ontario, Canada is US$15,600. Detroit was $28,600 before they filed for Ch. 9 bankruptcy protection.

Direct debt of PR stands at $72bln, 80% of GDP. The benchmark Puerto Rico 8% July 1, 2035 GO’s (General Obligation Bonds) are trading in the mid 60’s in price terms (CUSIP 74514LE86 rated Caa3/CC with both ratings on negative watch) . The yield at $66.625 is 12.663%. GO’s are tax exempt securities for US tax purposes and Puerto Rico bonds are triple tax exempt (i.e. not subject to taxation at the municipal, State or Federal level). Muni debt is also not subject to the 3.8% Obamacare investment tax, making it effectively “quad tax exempt”. Converting the low teens tax exempt security yield to a taxable equivalent basis gets you to a 43.40% yield (assuming a 43.4% tax rate and a 23.8% capital gain tax rate). Obviously many bad outcomes are factored in at such distressed levels. Even the bond king, Jeff Gundlach has drunk the cool-aid in moderation (approx. 2-3% weighting in Commonwealth of Puerto Rico 2035 GO’s in his $1.73bln Income Solutions Fund).

http://www.emma.msrb.org/  The official repository for information on virtually all muni bonds (official disclosures, trade data, etc.). An awesome resource for municipal credit.

CfXinrVWQAApmfs

Pension Plan Woes:

Arguably a bigger problem is the underfunded pensions in Puerto Rico. The total underfunded tally is $42bln at present.The pension plans stand on the brink of insolvency. The funded portion is approximately 10% whereas the worst in the contiguous states is Illinois at 40%. $25bln+ of the PR pension shortfall is from laughably generous legacy (pre 1990) pensions  (grandfathered) that call for a 75% pension, based on the retirees best 3 years, drawn as early as 55 years of age (with 30 years of service). Tweaks made to the system over time have resulted in the defined benefit model being replaced with a less costly defined contribution plan for participants joining after the year 2000. Full tap out of the pension plans would see conversion to a pay-as-you-go system with a draw of $1bln per annum (a full 11% of the annual PR budget). A full 1/3 of revenue currently goes to debt service.

All eyes are on the US Treasury and Obama, who have signalled support for the preservation of pensions over bondholders by potentially giving pensioners priority of payment over bondholders. This is a very important precedent for municipal finance in the USA and beyond.

330,000 current PR pensioners versus deep pocketed bond investors (many 1%ers, incl. hedge funds) is not that hard to handicap. As Puerto Rico goes, so goes Illinois and California, would be the thought.

Broader market implications:

The US Muni bond market is immense at $3.7tln-$4.1tln (estimates vary). Given the tax exemption, the bulk of muni debt is held by the top 10% of US taxpayers, either held directly or through investment funds. Upwards of 75% of the US fund complexes own Puerto Rican debt. Given the current distressed status of the credit (investment grade ratings are a distant memory) there are few new buyers, as on a suitability metric, there is a skull and cross-bones on the credit. What are termed cross-over buyers, primarily hedge funds, are the ones with the fin piercing the water’s surface recently. Estimates peg hedge fund ownership of PR debt at >20% (par amount). It should be noted many hedge funds call Puerto Rico home as well, fully gated as one would expect in an environment reminiscent of The Wire (without the clever police work). Acts 20 & 22 circa 2012 tax hedge funds at 4%. As an aside, crime has been a big factor in the travails of PR, with the crime index tracing in the mid 60’s versus 50 for the USA. That said, the murder rate in 2014 touched a 15 year low of 681 (down 40% from the official high of 1,164, but some pegged the high at 2,000, more than 5 homicides per day).
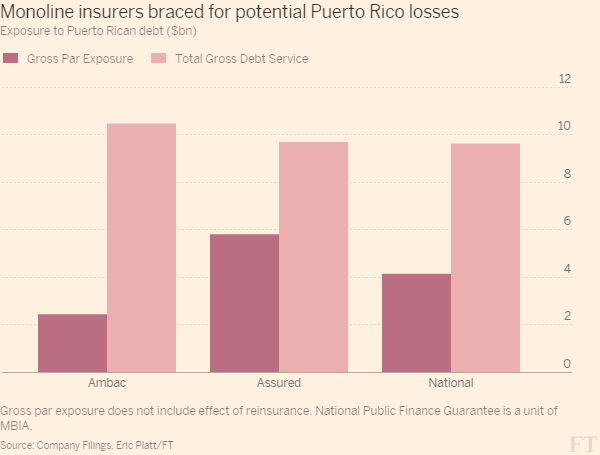
Monoline insurers:

Muni debt investors are overall a conservative lot. Monoline insurers have been a long standing fixture of the US municipal market whereby insurers “wrap” the credit risk of the muni (for a fee) to make the debt more saleable in the marketplace due to the higher ratings assigned to the debt. For insured debt, the owner has the comfort that to lose money due to default, they need both the issuer and insurer to default. The mechanic of the payout on an issuer default is different than a credit default swap (CDS). With an insured bond (monoline wrapped) the insurer is on the hook to pay periodic interest and principal payments (i.e. sinking fund payment, final principal repayment) when due, as per the underlying Bond Indenture.

01-FT Monoline Insurers Puerto Rico 12-1-15

What to do:

Monitor the PR situation, especially if you own muni bonds. Monitor to PR pension situation if you are a taxpayer. Opportunities will likely arise out of the ashes. Monitor the monolines, esp. Assured Guaranty (AGO) and MBIA (MBI). Look for excessive spread widening as a potential opportunity to buy investment grade muni credit that widens in sympathy. Closed end funds will likely trade at  deeper discounts to NAV. State specific funds from the high tax states may get unduly beaten up. Get some help with this, as muni investing is a specialized area. Funds are likely the way to go versus discrete bonds given the wide bid/offer inherent in retail clip sizes. For non US tax payers opportunities could arise in taxable muni credit which encompasses closed end funds like Blackrock’s BBN, Pension Obligations bonds (PO’s) and OPEB (Other Post Employment Benefits), all of which are taxable to US investors. Not all jurisdictions have tax treaties, but there is no wht on US municipal debt.

CfooeDTXIAEfyv3

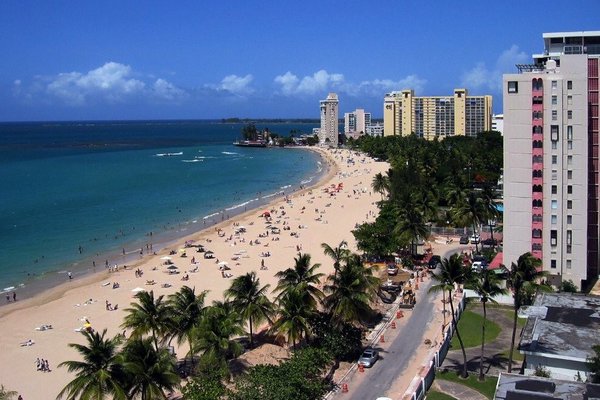
Many layers to this onion, but I’m beyond my optimal word count. San Juan’s Isla Verde was voted the best urban beach but it is likely to be Isla Rojo for a while. Follow me on twitter @firehorsecaper JCG

Disclosure: 6% weighting in DSL (Doubleline Income Solutions) in my IRA. 10.5% yield. 6.9% discount to NAV (closed end fund).

Comments »

ROBO LOCO – ALGORITHMIC INVESTMENT

There are more than 140 private tech start ups with valuations of > $1bln, the metric for “Unicorn” status. The typical exit for start ups, regardless of the number of funding rounds they have successfully completed, has traditionally been via Initial Public Offering (IPO). The Q1 2016 IPO market has been as dry as a popcorn fart. No issues in January (1st time since September 2011) and the quietest quarter logged since awful 2009.

As the following chart form the venerable JP Morgan brilliantly shows, unicorns are more shy than we would have guessed, preferring the relative comfort of the private markets (with only a couple of exceptions):

dl9skrkty1mfckhumgcg

Within tech, FinTech is a hot sector and the recent dread and consternation of the “Downround” in Silicon Valley has not yet been evident in the Robo-Advisor space. The most recent funding round of $100mm by Betterment values them at $700mm, keeping them in the foal category, at least for now (Betterment now has AUM >4bln and Wealthfront have grown AUM to > $2bln). If Schwab were to put a valuation on their robo division is could be argued it would be close to a unicorn ($5bln AUM). Vanguard was made for this space and now has >$10bln in robo AUM, having attracted >$33bln in overall new AUM in January of 2016 alone, a record in Vanguard’s 40 year history. Early signs are the hybrid model sits well with investors. Vanguard’s average account balance by age group; 25-34 $22k, 35-44 $55k, 45-54 100k, 55-64 $155k, 65+ 180k.

-1x-1

Missing from this list above is Blackrock, #1, the largest asset manager on Earth with better than a 5% share of global AUM. Blackrock bought FutureAdvisor to garner a toe hold in the robo space (45 employees and $600mm in AUM when purchased in August 2015). Their angle is unique in that the business has been housed within Blackrock Solutions (BRS) whereby they license their digital investment technology to Banks (RBC, BBVA, etc.), Insurance Companies and Advisors who are, rightly so, alarmed about getting swamped by the digital tsunami:

Ce2r14vWwAA1--8

Who one choses to manage their money is a highly personal, highly emotional matter. It is called money because we all need it. The decision varies markedly from who you chose to drive you around town (Uber), network with friends (Snapchat/Facebook/WhatsApp/Twitter/LINE), be entertained by (YouTube, Dota 2, Netflix) and shop (Amazon).

It is yet to be seen if the explosion in passive investment strategies, many of which employ ETF’s, can stay the course through a full market cycle. Robo-advisers take passive to a different level (your cat provides more direct feedback in the pure model) and time will tell if end investors can stick to their chosen path. Large financial asset drawdowns typically see dopamine quickly replaced with epinephrine (adrenaline) and cortisol as a stress reaction in the lizard brain of humans. The rational, human brain (frontal lobe) likes smooth return profiles, which is why many money market funds carry stable value wraps.

While it can be dangerous to generalize, lets generalize. The typical Betterment or Wealthfront robo-advisor customer is more likely to be a millennial (born 1982-2004), with a much longer investment horizon than a typical Vanguard customer, robo advised or otherwise. Many millennials are unbanked, by choice and the investment ecosystem wants them back, if for no other reason than the massive wall of inheritance coming their way when their grandparents and parents surrender their physical form.

The 1% have had elements of robo-advice for years, but the latest trend brings it to the masses. No minimums (free at certain break points, 5 & 10K typically). All good trends.

Valuation. FinTech start-up/pre-profitability valuation is difficult, but we have some proxies which we can use for comps.

Betterment (Privately Held). Taking Betterment’s fresh $100mm funding round as an example. $4bln in AUM is driving a $700mm valuation. Let’s be generous and peg their blended fee at 25bp (0.25%) per annum. 25bp on 2 yards grosses $10mm for a metric of 70x revenue. As a % of AUM the valuation looks more stark at 17.5%. Tremendous growth rates in AUM and maintenance of margins will be required to get this foal to unicorn status 12-18 months out. This latest raise was large, which is prudent. Wealthfront raised a total of $129.5mm in 5 rounds from 33 investors with their latest raise of $64mm in October 2014.

BLK $337.20 – Blackrock. $4.5tln in AUM, $56bln market cap. 17x P/E, 1.25% dividend. Valuation as a % of AUM 1.24%.

SCHW $27.83 – Charles Schwab. $2.5tln AUM, $37bln market cap. 27x P/E, 0.86% dividend. Valuation as a % of AUM 1.5%.

WETF $10.82 – Wisdom Tree. $42.5bln in AUM, $1.5bln market cap, 19x P/E, 2.92% dividend. Valuation as a % of AUM 3.53%. Wisdom Tree’s 2 benchmark currency hedged ETF’s for Japan and Europe make up over 1/2 their total AUM. The recent screening of Yellen versus Batman (ECB) versus Superman (BoJ): Dawn of the Global Currency Unit did not play well with focus groups and both DXJ and HEDJ are seeing steep redemptions.

IBKR $39.17 – Interactive Brokers. $15.7bln market cap, 50x P/E, 1.02% dividend. Not a robo per se, but a strong backbone for private label robo-advisors.

There are a number of bespoke algorithmic offerings available in the market today for those buying into the active/hybrid DIY model. For the cost of an expensive date night at Delmonico’s (2nd label French vino) you can subscribe to IBC’s Exodus market intelligence.

https://exodus.ibankcoin.com/join

77% accuracy in calling short term tradeable bottoms (mid 3% per) since 2009. Of the listed motley crew of tickers above, only Wisdom Tree has recently gotten close to an O/S signal (1.2 on Tuesday past versus the 1.15 threshold required). WETF popped 4% + with the genki overall market yesterday. Sometimes it pays to wait for the fat pitch. JCG

Note: I had an incorrect AUM for Betterment posted earlier. Currently 4bln + in AUM and growing quickly. My apologies.


Comments »

THIRD POINT – GET YOURSELF A BOARD SEAT

$TPOU.L  Third Point Offshore Master Fund, Ltd.

The institutional hedge fund space is typically difficult for the average Joe to access. Only accredited investors can buy and the minimums are high ($5mm typical) with smaller dollops (i.e. $100,000) subject to another layer of fees (1% typical via fund of funds). Dan Loeb’s track record running Third Point has been stellar, trouncing the S&P return by almost 9% per year since it’s 1995 start at $3.5mm to $15bln AUM presently:

DanLoebQ42015letter

Loeb’s Third Point fund is closed to new investors, making access a more definitive issue. Enter Third Point Offshore Investors Limited, a London listed (TPOU.L) feeder fund which individuals can buy. This is far from an institutional avenue as typically daily volume is light, but a patient investor can leg into an allocation of a couple of % relatively easily.

Third Point_2016-03-March-Monthly-Report-TPOI

The fund is listed as having an Event Driven, Value Focus. Dan Loeb is perhaps best known as an activist investor in recent years, but his background is varied. Long/short equity typically gets a large gross allocation, but credit, asset-backed securities, and macro are all utilized. This strategy diversity gives Third Point a lower correlation to the straight beta of the equity market (S&P), along with smaller drawdown (Sortino ratio of 1.87 reflects the funds ability to limit downside deviation).

For the typical retail investor, bewildered with what to do in a typical year and made more cautious by the -10%+ start we had to 2016, a modest allocations to listed hedge funds is worth further investigation. This is a whole other level from other forms of active investing, of which up to 40% is really “smart beta” (i.e. alternative indexing methodologies).

The expertise does not come cheap at 2/20. 2% of NAV is the Management Fee, which is really more like 2.25% give the persistent discount to NAV evident in the closed-end fund space. Performance fees are 20% of NAV growth, but there is an investor friendly clause whereby fees are cut in 1/2 in the event of a fall in NAV in any given fiscal year (in place until the NAV fall is recouped by a factor of 2.5X). Performance for TPOU.L  will track very close to 1:1 with the Third Point Master Fund performance.

listedhedgefunds4

Jeffries went positive on the listed hedge fund space in early February, including Third Point’s closed end-fund TPOU.L. Early in his career Dan Loeb (54) was an SVP Distressed Debt Investing with Jeffries, pointing to his multi-disciplined investment acumen. Barron’s also cast an admiring eye to the space last week, but lumping Loeb’s Third Point in with Bill Ackman’s high wire act did not seem to resonate well with readers/investors.

Many hedge funds have found increased regulations burdensome. Dan Loeb has built his sizeable wealth of $2.7bln through his multi-decade success at the helm of Third Point. A common strategy evident in the market is to return 3rd party money and convert to a Family Office structure, mandated to manage the founder and staff’s accumulated wealth. Getting rid of regulatory headaches/cost and re-sizing to more nimble size must be a tempting proposition. In addition to the merits of hiring a proven quantity manager, this is clearly a potential catalyst for the closed end fund discount to close to zero over the medium term (approx. -14% discount to NAV at present after a +1.8% gain in NAV and a better fund performance just reported for March). Third Point Offshore have both announced and executed stock buybacks (5% typically) in the past to assist in controlling the closed-end fund discount.

The listed funds are tiny at approx. $675mm in relation to the $15bln + run in the Master LP, making the closed-end buyback at NAV a finger snap easy proposition. JCG

Disclosure: Long just shy of 2% allocation in TPOU.L from February. A good fit with my other hedge fund exposure which, while multi-strat, does not employ equity long/short and is light on both activist and event driven strategies.

Comments »

WEED – DUDE, THIS IS LEGIT

There are always warranted concerns when is come to marijuana use, but the people have spoken (58% support decriminalize / legalizing pot, up from 34% in 01′). Overall it is early innings with Colorado and Washington the early movers in November 12′ with retail sales from 14′:

b2ce39b4-f3a1-410b-a9a0-cf44afb08c8d

These numbers are representative of what can be expected from the Canadian market a few years out (C$5bln, US$3.8bln). With that handy 10:1 factor conversion, legal pot could quickly be a US$40bln industry in the US. The DEA peg the illegal trade at $120bln, hence this is not a stretch given the pace of legal adoption evident.

To put this in perspective, coffee is a $48bln industry in the US with Starbuck’s market cap at $82bln (32x P/E multiple).

The legal pot tax haul thus far has been wicked. Colorado charges a 15% excise tax +10% sales tax + municipal taxes for approx. 30% of the final product costs in taxes for the state coffers. Washington as of 7/1/15 charges a 37% excise tax + state and local. There are many details to sort in this type of endeavour as one can imagine. The age limit is a critical one and both states have a 21+ cutoff.

From a “pick your poison” perspective authorities might favour potential switching from alcohol to wacky tobacky, and there is some of that noted but typically these vices are not mutually exclusive. Opioid painkillers cause more overdoses than heroin & cocaine combined at present. Opiates are a significantly more harmful category of drug versus marijuana than implied by the graph below.

2011_Drug_Harms_Rankings.svg

Those who do not remember the past are condemned to repeat it. The British introduced opium as a recreational drug to China is 1825 (China had used it for medicinal purposes since the 7th century) in an effort to balance their trade numbers with China (silk tea and porcelain out versus British gold and silver in prior). The two Opium Wars of the 1800’s were largely credited with the downfall of Imperial China.

Cannabis (% regular usage); Iceland 18.3, USA 14.8, NZ 14.6, Nigeria 14.3, Canada 12.2, Bermuda 10.9 and Australia 10.3.

Finding a way to invest at this juncture is challenging. GWPH has a market cap of $1.6bln and sits at about the mid-point of its 52 week range at $72.68. Many university educated baristas will be tempted by the $100k per year top cannabis jobs, but the $12/hr dispensary roles are much more plentiful. Snoop Dogg has signed with Ontario’s Tweed which hopes to be the Tim Horton’s of weed for Canada.

Prime Minister Justin Trudeau has promised to legalize, tax and regulate the marijuana trade. I would not fade the man.

CensUSrWIAAp2w2

For the producers of prime marijuana, the skies are very blue indeed. Premium labels sell for as much as $430 per ounce. One blunt of a varietal called Afghani Bullrider costs $150/per.

I gave brief consideration to wasabi at $100/kg, but a change in tact may be called for. Wasabi is notoriously difficult to grow with New Zealand and Oregon, US the only non Japan markets to get traction thus far. IF I get the required approvals for the tract of remote land in the neckbones of the Appalachians, keep an eye out for the ticker symbol OMG. JCG

CeucC6kWAAAjD3Z

Comments »

PORKNADO (MADE IN CHINA)

It is difficult to find inflation these days, just ask any central bank. Pork prices are skyrocketing and China is having difficulty keeping up with burgeoning demand. Pork prices are up 55% year-over-year (piglet prices are up 101% over the same period) . Pork prices are at a 5 year high. China tapped their strategic pork reserves (SPR) in September of 2015 releasing 102,000 tonnes of pork into the domestic market at below market prices to stabilize the market in the midst of mid-autumn festivals in which pigs have a starring role.

China established their pork reserves (fresh and frozen, hence a highly managed program) about eight years ago after 45 million pigs died of blue-ear pig disease (Porcine reproductive and respiratory syndrome virus) in 2007, causing a spike in pork prices.

CeS6uqDW8AAIU2Z

Note: USD/CNY 6.51 at time of publishing.

Growth in Chinese pork consumption has not been an overnight phenomenon, but China now consumes >500mm pigs per annum (50% of the world’s pigs). Consumption has increased 7X since 1979 and per capita consumption is now 39kg (EU 2nd place globally at 31kgs). Approximately 64% of the protein consumed in China is pork. Americans eat 88% more meat per capita than China (93.3 kgs), but pork makes up a much smaller percentage.

01fe622d-2bc7-47e5-a2ab-78e4dcb97020

China-per-capita-meat-consumption-1985-and-2015

The global implications of this phenomenon are staggering.

Animal husbandry is one of the primary causes of climate change. More affluence leads to an increase in protein in ones diet and short of a pandemic the trend points to more domesticated animals being eaten by humans. One would think that the US is now at or near the upper bound with the average consumption at 9 oz. of animal protein per day. Healthcare has outstripped housing as the largest GDP component for the 1st time.

Given the voracious growth in their pork consumption, China must import most of the feed needed for domestic pork production. The scale is enormous with China potentially importing 1/2 of world feed crops within a decade. This metric was reached with respect to the global soybean crop in 2010. Brazil and Argentina are two of the primary exporters to China of soybeans. Brazil has 25 million hectares of soybean in production, a goodly portion of which was rainforest at some juncture. Argentina exported 8mm tonnes of soybeans to China in the last year.  Each 1kg of pork requires approx. 6kg of feed to produce. China also imports pork, primarily from Spain, Germany and the UK. China could consumer all the pork produced by Australia in a year in 2.5 days.

China clearly needs more scale in their swine production. Part of the gap is being closed via capturing portions of the supply chain outside their borders. China controls 5mm hectares of land outside of China for porcine endeavours. In May 2013 Shuanghui, aka Sineway Group, China’s largest producer bought Smithfield Foods in the USA which gave them access to large tracts in Missouri and Texas. Institutional investors are burrowing as well. In June of 2014 KKR lead an investor group with $150mm of their own funds to invest $270mm in aggregate for a 70% stake in China’s COFCO Meat with an eye to build larger scale industrialized pig farms and meat processing facilities with improved food safety guidelines. COFCO produce and process 1mm pigs per annum with aspirations to grow to 6mm (which would give them a approx. 1% market share). For context, Shuanghui slaughters 15mm pigs per annum (mm = million).

CeTjC-kWEAAmuiw

China provides > US$22bln in subsidies to the domestic swine trade, approx. $44 per pig. “Dragon Head” aka Regional Champion Enterprises are earmarked for much of the subsidy support.

Many peg chicken as the next protein to be blown up by Chinese demand. Beef is another blog post, but suffice it to say prices are elevated when it pays to fly live cattle to the interior of China. A test program from November 2015 flies live cattle from Australia to China is retro-fitted Boeing 747’s (150 animals per flight).

1200x-1

Global food inflation is upon us. Food inflation in the USA over the 1914-2016 period averaged 3.5%. Certainly food for thought. JCG

Comments »

CANADA – PLACE YOUR BETS

Things generally get done quickly in Canada. Elections are not drawn out, overly expensive affairs. Prime Minister Justin Trudeau (office assumed 11/4/15) has brought his debut budget via Finance Minister Bill Morneau, and while some are aghast at the scale of the near C$30bln (US$22.7bln, equiv. to approx 1.5% of CDN GDP) planned budget deficit, it was largely what got the Liberal party elected. Trudeau promised C$125bln of deficit spending over 10 years (up from $65bln planned by the prior no USA State Dinner “Melba toast”, Lego-haired Stephen Harper led Conservative government).

The planned Canadian deficit is much smaller than what the USA is running. On a GDP/per capita basis Canada’s deficit would translate to a US$225bln deficit for 2016 versus the US expectation of -US$616bln, 4.1% of GDP (up from -US$439bln in 15′). The US passed their first budget in 6 years in 2015. Obama, admittedly through the highly thorny Global Financial Crisis (GFC), has presided over 5 of the 6th largest deficits in the history of the United States, several of which breached $1tln (2009 deficit was $1.4tln, or 9.8% of GDP).

The recent rally in all things Canada seems to have outpaced all rational thought, even for a Canadian (hand held high, Cape Breton, Nova Scotia native). The pheromones released by young (44) Justin Trudeau do not explain all of the recent exuberance. Valeant aside, Canadian institutions have a reputation for being more prudent, more conservatively managed than their US and Global peers.

Canada is clearly a levered bet on a recovery in the resource sector. The equity market cap weighting of oil & gas and mining & metals for Canada at 35% is nearly 2X the USA’s 18%. The Canadian banking landscape is similar to Australia in that it is essentially an oligopoly, with an 80% share held by the top 5 players. Canada’s largest bank, Royal Bank of Canada recently overtook Goldman Sacks to be the 5th largest Bank (ranked by assets) in North America. RY trades at a P/E multiple of 11.2x versus 8.4x for GS. RY yields 4.3% to GS’s 1.7%. RY’s price to book is 1.8X versus 0.86X for GS. Notably, most US money center banks trade at a discount to GS, making the comparisons more stark.

77265855-d05f-44f6-96af-8ec7731ed251

International comps are even less kind. The Bank of Nova Scotia is Canada’s “Emerging Markets” bank with it’s top 3 leading markets outside of Canada/USA ranked Mexico, Peru and China. Perhaps a better global comp for BNS is embattled Standard Chartered ($STAN.L). BNS trades at a P/E multiple of 10.8x versus N/A (non currently profitable) for STAN. BNS has a dividend yield of 4.5% versus 2.1% for STAN and BNS trades at 1.5X book versus 0.4x for STAN.

Broadening the net somewhat, XIU the S&P / TSE 60 is up 3.6% YTD versus 0.2% for the largest EFT currently,SPY (S&P 500).

The most recent ebullient rally has brought USD/CAD to 1.3250, a rally of >9% in 2 months from the 1/19/16 low of 1.4579.

Canadian real estate has been largely a tale of two cities, Vancouver and Toronto. China accounted for > 1/3 of Vancouver wide buyers in 2015. There are now 15 cities in China with populations >5mm. Canada only has 4 >1mm. Vancouver is #1 for Asian buyer due to i) climate and ii) proximity. FATCA has been a headache for many Chinese nationals with 10’s of thousands relinquishing their US Green Cards. While structuring solutions abound, US Estate taxes are an additional burden favoring Canada (Revenue Canada has no global taxation mandate and Canada levies no estate taxes, making it a tax haven at least on this metric).

Since the 05/15 Economist article warning of the bubble like conditions, Vancouver is up 14% and Toronto 8%. Further, Vancouver was up 3.2% in 02/16, the strongest 1 month rise since 08/06.

CdEpJegUYAAfIus

Canadian-Housing-Is-Being-Propped-Up-By-Just-One-City

Perhaps it is the French influence, but Canadians do not like locking into long-dated mortgages. Americans refi at the drop of a  hat in a falling rate environment, but most Canadian mortgages carry a hefty pre-payment penalty (3 months interest typically). IF people fix their rate it is typically for 5 years (30 year amortization). Overall consumer debt in Canada is high at 1.65x income but the make-up of the debt is less worrisome, dominated by residential mortgages, followed by home equity line of credit with credit card debt as distant 3rd. With the broad government support/subsidization for higher education, the student loan debt burden is but a fraction of the US $1tln + (size adjusted of course GDP and/or population, near 10:1 on both metrics). Canada ranks as the most highly educated country in the world (51% of adults >25, including immigrants, hold at least a Bachelors degree, up from 40% in 2000).

Immigration policy is a key metric when sizing up Canada. Policy has resulted in 1% growth (300,000 per annum) via open immigration policies. Foreign students has been a particular area of focus, with recent rules relaxed to have students study time counted partially (50%)  towards the time required to get eventual citizenship. The once popular immigrant investor program which granted permanent residency for those passing a net worth test of C$1.6mm and a C$800,000 no interest loan to Her Majesty in Right of Canada was replaced with a venture capital pilot requiring C$10mm net worth and $2mm tied up interest free for as long as 15 years. Perhaps more importantly than the dosh is the fact the venture program requires proficiency in either English or French whereas the immigrant investor program had no such requirement. The venture capital program has not been popular, needless to say. Canada was officially made a bilingual country (English/French) by Justin Trudeau’s father Prime Minister Pierre Trudeau. Montreal, Quebec at 4mm souls ranks as the 4th largest French speaking city in the world after Paris – France, Kinshasa – Democratic Republic of Congo (DRC) and Abidjan – Cote d’Ivoire.

ON-BQ344_abbych_NS_20160308211733

In the last quarter, Canada has admitted 25,000 Syrian refugees. Through the generous family sponsor program Canada has been able to double their country wide intake and plan a full 50,000 Syrian refugees for all of 2016. While these numbers pale in comparison to the 1mm + refugees Germany has accepted in the last year, Canada is clearly punching above their weight as a global citizen in this regard. The scale of the refugee crisis in Europe is immense and the most acute since the end of WWII. Some from developed EU countries which have borne the brunt of refugee support have turned an eye to Canada as a possible long term port in the storm (read, more potential high calibre immigrants). Trump “crazy dodgers” could eventually outnumber 60’s draft dodgers (est. 40,000) with Cape Breton’s program eliciting many hits if not plane tickets (yet). http://cbiftrumpwins.com/#intro

Tax policy. With the promised/coming tax hikes for “high earners” (>C$200,000, approx. US$150,000) in the most recent budget (+4% to the Federal rate) Canada is 2nd only to France in taxing high earners. All-in tax rates for Ontario domiciled high earners is 53% order of magnitude, on par with the “Left coast” California at 52.9% (although that rate is at a higher income level). Corporate taxes in Canada are considerably lower than the US (<13% overall) with small business, defined as those making <$500,000 taxed at modest rates (10.5% Federal + modest Provincial rates).

Summary:

There are likely easier and more compelling markets to short, despite apparent valuation asymmetries. The recent Canadian Dollar rally is likely to lose steam (personal financial exposure to CAD pared in favor of USD through early 2017). JCG

Comments »

FAIRFAX FINANCIAL HOLDINGS LIMITED – OPPORTUNITY KNOCKS?

Fairfax is a Financial Holding Company based in Toronto, Ontario, Canada. Their underlying business is multi-line insurance (property & casualty, life, re-insurance, investment management and insurance claims management). Fairfax is listed on the Toronto Stock Exchange (TSE) under the ticket FFH.TO and has had an impressive run (understatement) under Prem Watsa, 21% compounded annual growth in book value from September of 1985 through present. From C$1.52 to C$700, over 31 years, truly remarkable. As at the end of Q3 2015 Fairfax had C$42bln (US$32bln) in assets. Full results for 2015 will be out mid April. Mr. Watsa is extremely savvy and even though he is young enough to be Buffett’s son at 65, he is often referred to as “Warren Buffett of the North”. Prem Watsa immigrated to Canada from India after completing a Bachelor of Technology Degree in Chemical Engineering and completed his MBA at the Ivey Business School at Western University in 74′.

FFH.TO at C$700 per share is up 8.1% ytd in 2016 but is well off it’s tippy toe highs when it was up 18.6% on February 19, 2016, to C$774, at a time you might recall most thought it was end of days. Fairfax announced a C$735mm bought deal for 1mm shares of subordinate voting shares on February 22, 2016 when the stock was flirting with C$770. It likely seemed to Lead Underwriters, Bank of Montreal (BMO), Canadian Imperial Bank of Commerce (CIBC) and Royal Bank of Canada (RBC) that 1mm shares on a bought deal basis at C$735 held limited downside, especially with C$29mm of total fees included. It turns out a bought deal was the way to go for Watsa. The deal closed March 2, 2016 and Fairfax got their C$735mm in gross proceeds (C$706ish net). The deal, as Fairfax typically does, funded growth with the proceeds of this slug of sub voting shares to pay for formerly announced acquisitions, namely 80% of Eurolife ERB Insurance (largest insurer in Greece) and an incremental 9% of ICICI Lombard (taking holding to 35%), India’s largest private sector general insurer.

The most recent bought deal turned out to be a stinker. About 1/2 was sold at the marketed (i.e. bought) price but with the rest of the wares sitting on the shelf of the deal underwriters, the last shares of the bought deal were re-offfered at $687.50, approx. 6.5% down from the $735 bought price. Obviously, underwriters did not take Fairfax up on the “Greenshoe” option to upsize the deal by up to 15%, that would be more a Kodiak boot than a shoe.

Fairfax’s main ticker is denominated in Canadian dollars. The Canadian dollar at 1.3354 has staged a magnificent 10% rally versus the USD in the last 2 1/2 weeks from the recent low. They have a USD version FFH.U.TO, also listed on the TSE but scant, as in near zero volume I’m afraid making FFH.TO the only game in town. Several hedge funds have listed re-insurance arms. Watsa like prowess costs you 2% & 20% in the USA. Canadian hedge funds typically charge 1.5% and 15%. Fairfax even pays you a consistent dividend.

The complexity of Fairfax is a turn off for some investors and there is certainly key man risk, but I’m much more comfortable taking risk on Watsa at 65 than others of similar vintage. He signed on for a decade more as CEO (through 2025) last year for C$600,000 (US$450,000) per annum in pay with no other incentives (pension, share options, car, nada) other than his existing shareholdings in Fairfax. Watsa used to control 80% of the voting rights in the Company and now hold 43%, 41.8% through multiple voting right shares and the residual through subordinate voting shares (identical to the $735mm just raised). Watsa is worth approx. $1bln through his career long efforts at Fairfax and draws two Hillary Clinton speeches worth of remuneration per annum. Serious skin in the game.

Macro overlays. Watsa has shown a very deft capacity to effect macro overlays to the Fairfax business at just the right time. His bet against subprime in the global financial crisis allowed Fairfax to net US$4.6bln on hedges, split somewhat evenly between equity hedges and credit default swaps where Fairfax was a buyer of protection well before the storm hit. The latest overlay, other than 16.5% (US$5.2bln) in cash, is related to a deflation bet Prem Watsa began in 2010. Fairfax now has >$100bln notional in CPI-swaps which pay if key global markets (USA 42% of notional hedges, EU 38% of notional hedges, Great Britain and France) experience deflation over the contract term (typically 10 year swaps, with roll down the portfolio has a average life of <7 years). Part of this hedge is to protect investment returns, but Watsa thinks both bigger and 2 moves ahead of most. Many European insurers will likely be insolvent after an extended period of NIRP right on the heels of ZIRP. Funding growth through opportunistic acquisitions does not come solely from bought equity deals when the sun is sunny.  JCG

Note: At the due diligence stage with this one. No position held. Pref shares in scope, in addition to the common.

Comments »