iBankCoin
Home / firehorsecaper (page 3)

firehorsecaper

Tokyo based, expat Cape Bretoner. Learning to live in a de-leveraging world. Better suited to the crusades. CFA & FRM charter holder. Disclaimer: @Firehorsecaper reminds investors to always perform their own due diligence on any investment, and to consult their own financial adviser or representative when warranted. Any material provided is intended as general information only, and should not be considered or relied upon as a formal investment recommendation.

AMERIZUELA: $FNMAS FANNIE MAE – ONLY ONE OUTCOME, RULE OF LAW MATTERS

While a number of “Mom and Pop” investors were also caught in the downdraft of Fannie Mae and Freddie Mac’s Conservatorship in September 2008 (10 year anniversary next year!), the largest current law suits appear to be from the hedge fund community at large. Fannie and Freddie had $36bln in preferred shares o/s when they were placed into Conservatorship, with community/regional banks the largest aggregate holder.

Bruce Berkowitz’s Fairholme Capital appears to be the most “all-in” with respect to position sizing with 35% of the fund’s capital deployed long Fannie and Freddie subordinated preferred shares. AUM for Fairholme is currently approximately $3bln (they were managing $19bln at their pinnacle), making this a 10 digit wager.

In Fairholme’s words:

“Fannie Mae and Freddie Mac. We believe that these two companies may be the most important financial institutions in the United States – perhaps the world – and directly support housing affordability and accessibility, including the uniquely American 30-year fixed-rate mortgage. They are a major reason why our country did not descend into a second Great Depression. Millions of American families depend on Fannie Mae and Freddie Mac to lower the costs and improve access to homeownership. In times of stress, these two have helped to ensure the continued functioning of the U.S. housing market. They have no substitutes. Fairholme’s investment in Fannie and Freddie demonstrates a commitment to ignore the crowd and invest in valuable, systemically important institutions – even those that are politically unpopular.”

Richard Perry’s Perry Capital (in wind down), is also long the prefs, exclusively.

Bill Ackman’s Pershing Square is much less committed, in terms of size of position at least (but still a sizeable swing at 9%), and has chosen to purchase the common shares of both Fannie and Freddie (although he has been rumoured to be selling common in favor of the prefs). Both GSE’s applied to be de-listed in 2010 from the NYSE and now trade over-the-counter on OTCQB, the “venture” stage marketplace for early stage companies that report to a US regulator.

The original government bailout of Fannie and Freddie was $187.5bln and they have now remitted in excess of $265bln back to the Treasury ($78bln more than the amount of the bailout). Fannie Mae accounted for $116.1bln of the $187.5bln and have repaid $159.9bln total to date (owned + $43.8bln surplus via net worth sweep).

The mechanics of the tithe were changed in August 2012 when the 3rd Amendment to the GSE Conservatorship  was passed (both GSE’s were paying a 10% dividend to the US Treasury on the Senior Preferred shares up until that point). The 3rd Amendment, as it became known, called for a “Net Worth Sweep” which is to be kept, in effect, for perpetuity. The golden geese have remained tagged since and the $ have been rolling in. Earnings for both GSE’s have been bolstered by an increase in guarantee fees as the fees on new mortgages exceeds the fees on those in the existing portfolio. Both have seen growth in their total guarantee portfolio, along with underlying mortgage origination and finally both have experienced lessening credit losses as their aggregate portfolio level credit metrics improve. An amazing turnaround story, were it not for the gold eggs being sent to corporate (aka Treasury) while they are still warm from being laid.

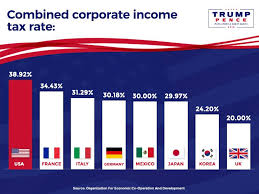
Fannie Mae had a profit of $12.31bln in 2016 as a point of reference. One potential fly in the ointment, in terms of reported earnings going forward, relates to deferred tax assets (DTAs). This is a bigger issue for Fannie than Freddie because of the relative size of their DTAs and the potential impact of Trump tax reform (corporate rate from 35% to 15% proposed, but many handicapping a final rate of 20%). Fannie Mae’s DTAs stand at $35.1bln and Freddie Mac at $18.7bln. Steve Eisman, who disclosed owning Fannie Mae prefs in smalls,  implied on TV this week that the DTAs could prove to be a catalyst for action, implying the US Treasury would be called upon to make the GSEs whole on the potential DTA value impairment due to the proposed Federal corporate tax cut. I may have misinterpreted Mr. Eisman’s call on this, but one thing is 100% for sure, the status quo is not sustainable. The US Treasury can ill afford to assume an additional 5-6tln of debt by nationalising the GSEs when the non revenue neutral programs on the table already get the USA to the mid 20’s (trillion) in Federal debt.

The lawsuits have not been going swimmingly for the hedge fund dominated plaintiffs to date. Shares of both GSEs have dropped >25% in the last 2 months months after an appeals court upheld a ruling against shareholders challenging the legality of the government’s Conservatorship. Shareholders continue to argue that the government’s net worth sweep of all GSE profits in perpetuity is unconstitutional.  An overturn of the perpetual full profit sweep is  the only viable alternative leading to a non zero-valuation for both the common shares and junior preferred shares of Fannie Mae and Freddie Mac. This is a binary, legal based outcome, hence not for the faint of heart. Ackman’s take, “We believe that Fannie and Freddie offer a compelling risk-reward as there are various scenarios which will generate a many-fold multiple from current levels. While a total loss is possible, we believe the probability of a total loss is relatively modest, and has become lower in the new political environment.”

Catalysts for a positive outcome:

1.) The U.S. Supreme Court overrule previous court decisions and overturn the net worth sweep.

2.) Trump and Treasury Secretary Steven Mnuchin recapitalize Fannie and Freddie, returning control to shareholders.

The 2nd scenario is the one that has boosted the stock since Trump’s win in November. FNMA and FMCC spiked as much as 250% (from $1.65 to $4.40) before settling in at the current $2.65 level (+50% from November).

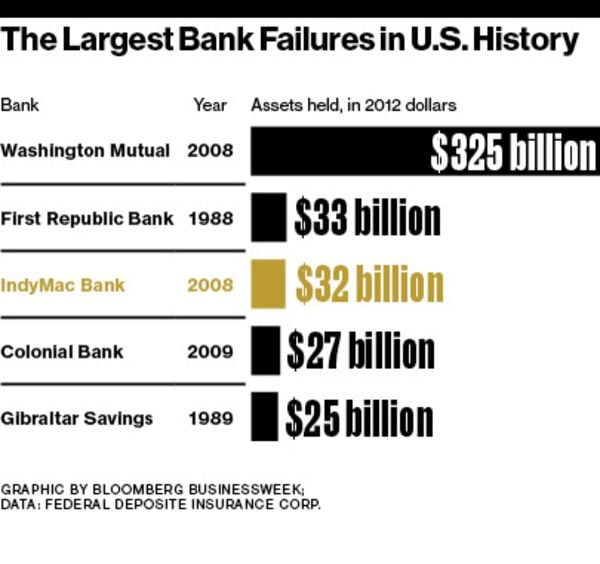
Nobody is better suited to craft and execute GSE reform than Mnuchin, aka “The Loan Ranger”. Post Goldman, he purchased failed Pasadena, CA IndyMac,  doubled its capital base (via additional acquisitions) renamed it One West and sold it to CIT for a tidy profit.

https://cei.org/blog/mnuchin-must-bring-transparency-fannie-mae-and-freddie-mac

Mnuchin has publicly stated:

“[We have got to] get Fannie and Freddie out of government ownership. It makes no sense that these are owned by the government and have been controlled by the government for as long as they have. In many cases this displaces private lending in the mortgage markets and we need these entities that will be safe. So let me just be clear we’ll make sure that when they’re restructured they’re absolutely safe and they don’t get taken over again but [we have got to] get them out of government control.” (Footnote: Nov. 30, 2016)

“[…] it’s right up there in the top 10 list of things that we’re going to get done and we’ll get it done reasonably fast.” (Footnote: Nov. 30, 2016).

Mnunchin’s right hand man is Craig Phillips, a near 40 year Wall Street veteran (most recently at venerable Blackrock) but he ran the Mortgage Securities unit at Morgan Stanley in the lead up to the GFC (May 2006, about a year before the wick was lit on the MBS woes to follow).

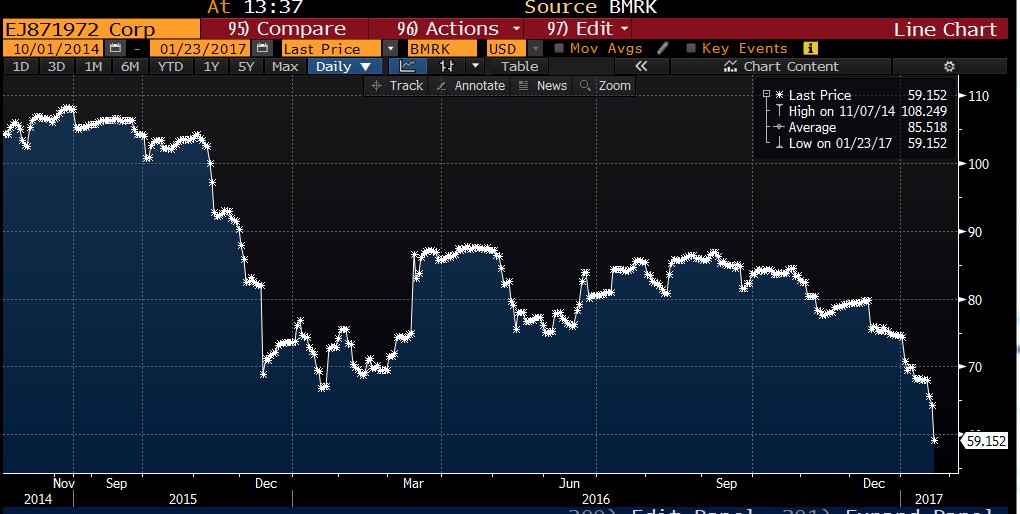
With Housing Finance Reform a top 10 priority, in terms of timing this likely makes it 2018 business (prior to 2018 midterms). The Trump tantrum we saw in the markets yesterday provide a potential entry point for punters willing to take Mnuchin et al at their word. FNMAS, the most liquid Fannie subordinated pref traded off by 5.6% to $6.75 yesterday (17-May-2017). The 52-week range has been a wide $3-$11, reinforcing the speculative nature of the proposed foray. The low was close to 9/11/2016, the 8 year anniversary of the prefs going ex dividend on 9/11/2008. The Trump Bump sent the Fannie prefs prices skyward, from lower left to upper right as Gartman would put it, approaching $11, appropriately, on Valentine’s Day 2017. FNMAS now at $6.75 have since given back 38% from the February 2017 $11 high.

This is the appropriate time to ask, “What is the upside on an investment in Fannie Mae subordinated prefs (FNMAS)?”, given that the downside has been shown to be zero. Fannie Mae did not file for Ch. 11. It was placed into Conservatorship, along with Freddie Mac. The capital structure remains legally intact, under which the subordinated prefs rank behind the US Treasury senior prefs, but importantly ahead of the common (which is to be diluted by 80% …. the US Treasury mandated “deal” when placed into Conservatorship). Also worthy of note, at the time the GSEs were placed into Conservatorship all senior and subordinated debt of the GSEs was paid/matured at 100 cents on the $. Before the US Treasury prefs can be extinguished (legally) it highly likely the dividends on the subordinated prefs would have to be reinstated. There are 16 discrete series of Fannie Mae subordinated prefs, FNMAS just happens to be the most liquid. None of the prefs are cumulative (i.e. no legacy dividends are owned once they start to pay again). The coupon on FNMAS is Max (3 mth Libor +4.25%, 7.75%) with a par value of $25.00. Cessation of the net worth sweep would see FNMAS trade back to par ($25) in short order for a 3.7x return on invested capital. It will likely take Fannie Mae time to build a capital buffer once/IF the net worth sweep is nullified. The US Treasury, despite the windfall seen via the net worth sweep will likely mandate the timetable for their senior prefs to be repaid. FNMAS, on a dividend reinstatement would pay 7.75% until Libor gets to 3.495% (good things are happening if/when we get 3mth Libor back to a 3 handle, I assure you), at which point L+4.25% would become the MAX, hence the applicable coupon. Given how high the rate is versus current market rates, it stands to reason that steadfast FNMAS investors could well see the market price trade well above par. I like the potential payout on a positive outcome for FNMAS  (3.7-4.5X invested $) much better than FNMA common. FNMA common traded off 3.3% yesterday to $2.65 and with some analysts guessing on an equity value of $15 post net worth sweep that would get risk-seeking investors a 5.66x return on their money. The pick-up versus the subordinated prefs does not seem worth the substantial additional unknowns and the known capital structure inferiority in terms of priority of payments.

Mnuchin is scheduled to speak today on GSE Reform in front of the Senate Banking Committee. Nobody is holding out for 100% clarity, but in a land increasingly filled with mere whispers, a clear voice can go a long way in setting the future course for perhaps the #3 priority for the Trump administration (just behind healthcare and tax reform).

Follow me on twitter @firehorsecaper

JCG

Disclosure: Long FNMAS, 2% allocation @ $6.75.

Comments »

HOME CAPITAL GROUP: $HCG – REALITY CHECK FOR LONGS

Equity investors in HCG have been heartened by the 70% rally seen thus far the week of May 8, 2017. To put this dead cat bounce in context, the stock, after rallying 70% this week, remains down 72% year to date. Home Capital Group trades on the TSX in Canadian dollars, last traded C$8.76 (US$6.40 with USD/CAD at 1.37) and started 2017 at just under C$32 (high print was a 55 handle in 08/2014 when USD/CAD was at 1.08!). There is an otc listing in US$, HMCBF as well but I’d use it for tracking only, given the lack of liquidity evident.

I would argue there is too much Home Capital equity glee evident.

The costly (>20% all-in with full fee stack) HOOP (Healthcare Ontario Pension Plan) liquidity facility for C$2bln was the bullfighters spear in this drain spiral. In addition to onerous monetary terms, the degree of overcollateralization HCG had to agree to (2x, i.e. a 50% haircut on Home Capital’s uninsured mortgage collateral) means that access to funding will have a terminus when HCG has no additional collateral deemed finaceable. Short of the HOOP facility terms being re-cast (near zero chance), it appears the days of HCG holding mortgages on their own balance sheet are long past. The company has admitted such in their latest press releases, and have entered into an arrangement with their competitor MCAP (as reported in the press, not by HCG) to on-sell mortgage commitments and renewals, initially for C$1.5bln with the potential to expand the program. Quebec pension plan (you can’t make this stuff up) CDPQ part owner of MCAP has responded that MCAP is the not the end buyer rather is a facilitator for the sale of the mortgages (MCAP will manage and service the loans for the buyer). MCAP have > C$61bln in AUM with a speciality in Canadian mortgage assets.

HCG currently has C$18bln in mortgages on balance sheet, currently largely funded by C$12.7bln in GIC deposits (including brokered GICs) which are eligible for Canada Deposit Insurance Corp (CDIC) coverage. Home Trust’s May 24th deposit notes traded in a range of $89.75-$94.875 on May 5, 2017, as reported in the popular press. Taking a mid off this wide trading range get us to a price of $92.3125. Assuming the CDIC insured 100% of the GICs in question, this would represent a liability of C$976.3mm of the aggregate insured deposit note program (C$12.7 * (100-92.3125)). This implies the Canadian government (via CDIC) is a bigger stakeholder than HCG equity holders, given the mkt cap of C$562.4. Based on the rally in HCG equity since May 5, 2017, secondary GIC levels have likely improved, but this example is more to show that this is a more of a razor’s edge scenario than most “hold my beer” financial journalists are acknowledging. HCG has a market cap of C$562mm and a mortgage portfolio of C$18bln, meaning just over $3 in price for the book wipes the equity out (C$18bln * 0.03 = C$540mm). Fraud naturally tends to widen bid/offer spreads as potential buyer naturally require a safely buffer for the unknown.

HISA funding has largely rolled off, and will not likely be a source of funding going forward. HCG also have the noted HOOP C$2bln liquidity back-stop (more than 70% drawn 2 weeks from establishment) which effectively served to replace the hole in their bucket from HISA redemptions. Home Capital’s  bigger problem may be they are NOT too big to fail. In my view, there would be little public support within Canada for a bail-out of HCG, either directly or through backing white knights (domestic or foreign). Why did the Canadian cross the road? To get to the middle. Not going to happen, especially in light of the blanket Moody’s downgrade just announced for all the Canadian banks, although still very highly rated versus global peers (RY to A1 from Aa3). Moody’s pointed to the banks collective exposure to over-indebted consumers and high home prices, and all remain on negative outlook. Distressed situations call for IRR’s in the low 20’s (HOOP’s facility is estimated at 22.5%, GS and FIG participated in the syndicated deal, and rarely accept less).

Home Capital is a regulated mortgage lender, and is the largest non-bank mortgage lender in Canada. This distinction is as critical as it was during the global financial crisis. Non-banks lack critical access to wholesale funding and access to the central bank funding window (The Fed in the US and the Bank of Canada in Canada).

Liquidity: Bear Stearns was sold to JP Morgan in March 2008 via arranged marriage for $2 a share ($236mm). The deal was announced over the weekend to quell global market nerves ahead of the Asia open. Bear closed at $30 a share (0.38x of $80 book value) on the Friday before the deal was announced at $2 (note: later revised to $10 as further due diligence could be conducted, the NYC headquarters of 85 year old Bear Stearns alone was worth $1bln). The Fed provided a $30bln back-stop to JP Morgan to better digest the thorny prey. Bear Stearns traded as high as $172 a share in 2007 and as an aside bought back $1.6bln in stock in 2007 alone.

Leverage: Fannie Mae was levered at 20:1 coming into the GFC. An increase in their loan loss experience from 4 basis points to 52 prompted both Fannie and Freddie to be placed into conservatorship where they remain. Leverage accentuates the negative by more than most can envision.

It remains to be seen if the poison laiden HOOP spear is lethal for HCG, but I’m confident that the stock is worth less than it is trading for now, and near fully certain it is not a 2.5 bagger from here (CIBC Asset Mgmt have tripled down on their initial long position and own 15% of the common). The only institutional investor that owns more of HFC stock is Turtle Creek Asset Mgmt  which holds a concentrated bet (25 positions in total) for 19% of the embattled lender. Turtle Creek’s flagship funds is at approximately C$2bln (closed to new investors) and it should be noted their track record to date has been stellar, boasting a 23.7% CAGR (1998-2016). I’ll be sure to check if they are open to new investors in 2018.

This blog post in being penned in Tokyo which is 13 hours ahead of North America, but a big day lies ahead for all involved in the HCG story. Delayed quarterly earning for Q1 are due and more importantly management is expected to shed more sunlight on recently announced transactions, including the price terms and cpty on the C$1bln mortgage sale. The other disclosure investors are keen to hear is on HCG’s announcement that they will be “tightening our lending criteria and replacing some of our broker incentive programs and expect that will result in a decline in our originations and renewals.” There have been daily tweaks to the rule book this week, but local mortgage brokers report Home Trust is still in business. New business is being written, with a few caveats; Best pricing has been eliminated (called Ace pricing), the max mortgage amount is C$600,000 which it was noted is not that useful in Toronto, their lowest rate is 4.69% with a 1% fee and their non conforming rate is 6.5% (noted as off market). Other B lenders have raised rates as well resulting in a widening gap between the A and B rates. Smaller competitor Equitable (who scored a liquidity facility on much better terms than HCG) is going flat out and not taking refinancings right now due to volumes. As of Wednesday May 10th Home Trust was also just doing purchases (no refinances). Broker finder fees were reduced this week as well (as HCG noted they intended to do).

The press is Canada, to my mind, has been too sanguine about the risk to the HCG story playing out well for retail HCG equity investors. Most analysts have given the situation a wide berth of late. TD presented an analysis this week showing their thoughts on HCG equity valuation for different valuation levels for the C$18bln mortgage portfolio; at $91.00 (a $9 discount) they saw equity as worth $0. At $95.00 (a $5 discount) they saw C$9.70 (close to where we are now at C$8.76) and a sale at par, $100 resulting in an equity valuation of $21.68. Put another way, to make 2.5x your money you need all the stars to come into alignment and see Home Capital get 100 cents on the dollar for their mortgage book. Hope is not an investment strategy.

Those long intent on riding this out should get up the curve on CCAA (Companies’ Creditors Arrangement Act), Canada’s equivalent of Ch. 11.

Follow me on twitter @firehorsecaper. JCG

Disclosure; Currently flat, as borrow for a short position has been unavailable from my current broker (IB).


Comments »

RARE EARTH METALS REDUX: UCORE RARE METALS INC.; $UCU.V, $UURAF

Background:

Rare Earth Elements (REE) are expected to be a $9bln market by 2019, hence a tiny but critical market. Industry shipments totaled 133,000 tonnes in 2010 and have grown at a 9% CAGR over the last several years, with shipments expected to total 192,000 tonnes by 2019.

75% of global REE are currently sourced from China, where the bulk of global supply is processed, due largely to lower labor costs. 22% of REE emanate from Japan, and a scant 3% rest of world (ROW). 97% of current mine supply is from China.

Many, including the author, think the US should urgently take steps to secure a consistent supply of REE, strategic metals both for clean energy initiatives (rechargeable batteries for electric vehicles and the generators for wind turbines making up a goodly portion of the demand) and for national security & defense applications (jet fighter engines, missile guidance systems, anti-missile defense, satellite and communication systems).

The US currently imports 100% of their REM (Rare Earth Metals) and REO (Rare Earth Oxides) from China. World REE reserves are estimated at 110mm tonnes with China accounting for 50% and the US at 13%. Obama brought a 2012 WTO case against China, accusing them of hoarding key rare earth metals. Little progress has been made, although the WTO did rule against China in the case and export restrictions were lifted in 2015. The odds for Trump sweet talking better relations seem long. The typical business greeting in China is now the handshake, but most have little exposure to Trump’s Krav Maga version of the customary greeting.

Name of element Atomic number and symbol – REE: lanthanum 57 La (produced as an individual metal, est. to be 24% of REE value shipped 2013), dysprosium 66 Dy (used for control rods in nuclear reactors), cerium 58 Ce (produced as an individual metal, est. to be 40% of value shipped 2013),  holmium 67 Ho, praseodymium 59 Pr, erbium 68 Er, neodymium 60 Nd (produced as an individual metal, a key, rare 28ppm element used in producing lightweight permanent magnets in combination with iron and boron, NdFcB) , thulium 69 Tm, promethium 61 Pm, ytterbium 70 Yb, samarium 62 Sm, lutetium 71 Lu, europium 63 Eu, scandium 21 Sc, gadolinium 64 Gd, yttrium 39 Y (produced as an individual metal, used in alloys to strengthen aluminum), terbium 65 Tb (fuel cells). There are 17 REEs in total (15 lanthanides, yttrium & scandium) with most produced as oxides (produced as metals where noted).

Crystal abundance for REEs ranges from 0.5 to 60 ppm (part per million). It is often not economically feasible to mine solely for REE given the scant concentrations found in most deposits (Cordier 2011). Further, their often conjoined occurrence and similar properties makes the extraction of a sole REE both difficult and cost-intensive (London 2010). Copper is typically 50ppm, as a point of reference, hence while rare in relative terms, a concerted effort by the USA (#MAGA) to be self sufficient in elements like neodymium (29ppm as noted) is within the realm of possibility. Where should we start? The state with the lowest population density, Alaska (Sarah Palin land) seems like a good place to start.

Ucore:

Ucore Rare Earth Metals is a Canadian (Bedford, N.S.) development stage, micro-cap company with some big aspirations in the REM space. Ucore’s primary listing in on the TSX Venture exchange under the ticker UCU.V sporting a market cap of C$89mm (US$66mm). Very low liquidity, but the name also trades over the counter (OTCQX), under the ticker UURAF in US$.

Ucore has trademarked an innovative separation technology, “SuperLig” which can extract valuable RREs from oil sands and other tailings such as coal ash. Test results thus far for this innovative and potentially disruptive technology look promising. Ucore has been able to extract specific rare earth elements via it’s Molecular Recognition Technology (MRT)  nanotechnology to >99% recovery rates and purity.

Ucore is not just a mining technology company via SuperLig MRT, they also own over 11,000 acres of land in mine friendly Alaska – Bokan-Dotson Ridge, in Southeastern Alaska.

http://ucore.com/ucore-acquires-new-strategic-rare-earth-properties-in-alaska

Readers can dig into the assay result provided via the link. Ucore advertise they have the highest grade heavy REE (HREE) deposit in the US (N1-43-101 compliant). REEs with atomic numbers =<62, the ceric group, are termed light REEs. 63 and above are more rare (hence expensive) and termed heavy REEs. The 4 elements highlighted above have an anomalous skew in Bokan results thus far. The Alaskan government is certainly excited at the prospects for Ucore (Jewel CD sales have hit full saturation at 30mm). Through AIDEA (Alaska Industrial Development and Exploration Authority) they have made a US$145mm financing commitment to the Bokan-Dotson Ridge REM/REO project, subject to a laundry list of conditions of course. A pledge of this magnitude from the Alaska government could cover 2/3rds of the capex for the project and importantly, avoid dilution for common shareholders.

The only ETF specifically targeting the space is VanEck Vectors Rare Earth / Strategic Metals ticker $REMX which has AUM of $53mm and approx. 50,000 shares trade per day, on average.

Global names:

China Northern Rare Earth (ticker 600111.SS). Market cap, 44.6bln CNY (US$6.5bln). A shares, hence most can not access, even if you wanted to.

China Minmetals Rare Earth (00083.SS). Mkt cap 12.3bln CNY (US$1.8bln). A shares, hence most can not access.

Rare Earth Mineral Plc (REM.L) Mkt cap 43.2mm GBP (US$53.6mm). Highly liquid, London stock exchange listing, GBP denominated.

Very small allocation justified, if all all, given the perilous track record rare earth miners have left behind for forensics. Molycorp Inc., ticker MCP filed for Ch. 11 in June 2015, having reached a market cap of $6bln at its peak ($77 share May 2011). Skull and cross bones warnings.

Follow me on Twitter @firehorsecaper JCG

Note: Monitoring  UCU.V liquidity and vetting a long position in smalls. Currently flat.

Comments »

TESLA – $TSLA SHORTS: ASSAULT AND BATTERY

[Merrill Lynch: Thematic Investing – Global Future Mobility 17-Feb-2017:

Sustainable mobility: $7tn transport market facing disruption With over 1.2bn cars on the roads today, transport is a behemoth sector generating c.US$7tn in vehicle sales, supplies, and services. We believe that the sector is highly inefficient with 95% of cars parked at any one point, cars costing up to US$8.5k/year to own and operate, vehicles accounting for 1.2mn deaths p.a. and generating 23% of C02 emissions. Demographics (population to reach 9.7bn by 2050E) and urbanisation (70% living in cities by 2050E) will further strain existing infrastructure. The rising financial, social and environmental costs of transportation are unsustainable and demand a fundamental rethink of mobility. We see change catalysed by disruptive technologies and business models, rapidly evolving consumer preferences, and regulatory pressures. 4 game-changers: electric, autonomous, connected, and shared. In a world of exponential change as per Moore’s law, transport is a problem being solved at a tech pace. We believe that the convergent and mutually reinforcing trends of electrification, autonomous driving, the Internet of Cars (IoC) and the sharing economy will drive a fundamental shift from today’s car-centric travel to a platform-centric model whereby transport becomes a utility. Future Mobility – including an integrated, on demand electric fleet of autonomous taxis – can generate US$3.8tn of total positive impact in the next 10Y and lead to a “world of zeros”, including a 59% decline in vehicle demand, 87% fewer accidents, 54% fewer parking spots, and 85% lower emissions.]

Tesla Motors: One would think that Tesla could crack $300 a share on such ebullient projections (Tesla/Uber M&A perhaps). A lot of market cap has been added in a very short period of time, that is for certain. The last $100 move has been a blur with the stock up a full 24% year-to-date in 2017.  To grow in to the resultant current market cap Tesla has to be selling 1.7mm vehicles, at a profit, within 5 years (versus the 2.2mm currently produced and sold by mainline competitors such as BMW and Mercedes Benz).

As with all things “on the come”, much depends on the trajectory of China where 350,000 NEV’s (New Energy Vehicles) were delivered in 2016, 1.45% of the 24.3mm total vehicles delivered (up 15% yoy and accounting for 1 in 4 cars sold globally). EV’s account for 0.9% of sales in the USA and 1.3% in Europe in comparison. Chinese car producers accounted for 43% of global EV production (dominated by leading models from BAIC, Geely and BYD) and 46% of all plug-in sales globally. Tesla’s market share is 2% of NEVs in China (Japan is lower at est. 1.5%).  source: EV Volumes

Taking 59% of passenger vehicle demand out (ML 10yr #) should reduce emissions by at least that amount as some of the remaining internal combustion engine powered passenger vehicles are replaced with electric ones, but 85% seems like a high estimate to me. In China 31% of air pollution is attributed to vehicles, but heavy trucks as a sub category account for a full 90% of current total vehicle emissions. Despite Elon’s claims, electric transport trucks are not ready for prime time yet on the scale required to markedly change the emission numbers, the batteries required would be just too heavy (even before factoring the weight of the cargo) to stay within max payload limits (80,000 lbs.).

Estimated life to date Tesla sales in China are pegged at approx. 9,000 units (3000 were sold in 2015 versus an initial target of 10,000) and Japan at a very weak 2,000 (Japan’s EV subsidy is ¥950,000, or US$8,400), roughly equivalent to the US EV credit of US$7,500. As of mid 2016, Japan has more EV charging stations than gas stations. Tesla opened their 14th Supercharging station near Fukuoka in Kyushu earlier this month.

The fact that any credence is given to announcements like “opening” the Tesla market in India is laughable. Tata sells complete cars for less than the 55kWh battery cost projection on the new Model 3 Tesla. Ditto for Dubai on a relevance metric, Dubai will likely never hit 1mm in total car sales and 70% of current car sales are Japanese models.

I have previously written on the fact that EV subsidies are being curtailed in key global markets. The story does not end with EV subsidies either as Tesla has provided very generous residual buyback programs in key global markets like Hong Kong, which has very generous government incentives at the front end (fully detailed in the  legacy post below) putting a Tesla Model S pricing nearly on top of a gas powered Honda Civic and well below a Mercedes entry model. The 75% of purchase price buyback program after 24 months (low km) has been curtailed, but I fully expect lucky HK Tesla owners that have the “golden ticket” to exercise their put to Elon Musk. Factoring buybacks there is the potential to post net negative sales into China for Tesla in late 2017 to early 2018. Losing money on both the way out and on the way back into inventory as an exhibition (aka used) model will test the resolve of the hardiest Tesla bulls.

https://ibankcoin.com/firehorsecaper/2016/03/05/tesla-ev-subsidy-taper-tantrum-alert/

In the case of China, Federal NEV subsidies are expected to roll off by 20% in 2017 and regional subsidies by a more substantial 50-60%.

There has been a great deal of speculation about Elon Musk’s relationship with President Trump. Most recently, it seems like Elon is being relegated to dealing with VP Pense. Trump is very concerned with his image, it appears from afar, and it likely makes him uncomfortable that Tesla stock trajectory has left Elon with a paper fortune approaching treble his. Despite the fact that both Trump and Ryan have expressed a dislike for the current EV credit, Tesla stock has autonomously avoided the potholes and turned skyward like a SpaceEx rocket, seemingly never to re-enter Earth’s atmosphere. The EV credit may not be fully extinguished in the next budget, but it will likely be reduced from $7,500 which along with cheap $3/gallon gas might dissuade some of those Model 3 deposits from actually closing.

Tesla Energy: Even though the battery storage system revenue thus far in 2017 is estimated at a trickle like $15mm, Gigafactory 1 in California has launched and Musk is already projecting heady battery cost reduction of as much as 35% to under $125/kWh. With material costs estimated at $80/kWh this cost reduction is impressive. This result could allow the promised $35,000 Model 3 to be closer to a break even proposition for Tesla Inc. As for the sale of batteries to residential, business and utilities, all indications are that the business case is plausible, if not sound, and it is not unfathomable that revenues for 2018 approach $1bln, with the heavy lifting to come from the commercial and utility customers. Tesla’s PowerPack is scaleable to 1GW and will be an economically viable means to store relatively cheap mid-day produced power to be used when peak pricing is in effect later in the day (typically 5-9pm).

SolarCity clouds the analyst’s lens as to magnitude of the negative cash flow generation, but clearly not the sign (unprofitable; check, negative cash flow; check). The now combined Tesla entity carries a substantial $6bln in debt. Tesla has a market cap of $43.9bln, now greater than Nissan and honing in on fellow American Ford. Tesla has issued secondary equity on several occasions, the last being for $1.7bln in proceeds ($1.4bln + Greenshoe exercise) at $215 in May 2016. The stock rallied over 6.5% the week following the announcement, with the proceeds earmarked for Model 3 production with deliveries by the end of 2017 and bringing forward Tesla’s 500,000 vehicle unit build plan 2 years from 2020 to 2018 (as in next year, 2018). Patient investors should ready themselves for another secondary in 2017 (more debt on the heels of the SolarCity combination is not likely in my view), as fundraising has been an annual affair since 2012 and profitability can still not be seen with a Hubble telescope. Tesla’s market cap is so enormous at this juncture $3bln + might be in order to keep the transaction costs down. Tesla has 161mm shares outstanding and a float of 129mm shares. 26.6% of the float is held short, part of the reason for the recent pin action. Elon Musk owns over 20% of Tesla stock personally (all other insiders own 1.3% in aggregate, this is the Elon Musk show, have no doubt). The largest institutional investor is FMR LLC, better known as Fidelity Investments who own 13% of Tesla’s equity.

The Gini Coefficient at Tesla is off the charts, making it ripe for the UAW to eventually turn California plants. What potential gains Tesla might realize on battery cost via a well executed Tesla Energy launch can more than be given back through higher labor cost. Starting wages are $17/hr. in the Tesla plants (Toyota Motors Manufacturing average is US$39.50) on 12 hour shifts. Elon has been quoted as saying “changing the world is not a 9-5 job”. There is a reason that North American auto jobs have migrated from Canada to non-union southern USA and on to Mexico. If Tesla wants to retain its silicon valley nucleus it will have to eventually pay left coast wages, unionized or not.

Tesla’s book value per share is $17.03, hence it is trading nearly 16X book and 5x sales. Tesla does not own much in the way of proprietary technology. The Gigafactory is plug and play Panasonic technology. Elon once characterized patents as “a lottery ticket to a lawsuit”. The Japanese, by way of contrast, own 1/3 of the world’s o/s patents and it is the Japanese firms that dominate is areas such as ADAS (Advanced Driver Assistance Programs), electrification and emission control systems. Musk arguably has a narrow moat, with venerable global competitors breathing down Tesla’s neck across the broadening business lines of Tesla Inc. Rather than focussing on the pedestrian, largely outsourced means of propulsion (i.e. the battery) shareholders may have been better served in the long run (in the short run they have done just fine!) by focussing on the semiconductors and other high end technology components that are crammed into high-end, modern, connected EV’s (5x the amount of a “low end” vehicle, contributing over a 1/3 of the vehicles all-in cost).

Tesla Inc. has proven to be a difficult short, even for tenacious hedge funds, let alone lowly individual investors like moi. My TSLA T-acccount is close to flat on my 3rd short attempt (short @ $260 into “revenues”) with the 1st try profitable, 2nd a loser (1/3 of 1st trade profit) and the 3rd, so far, offside. Q4 2016 numbers are out after the close this Wednesday the 22nd with analysts expecting and adjusted loss of $0.51/share which would be a marked improvement on the loss of $0.87/share booked in Q3 2016. SolarCity is enough of a wild card to lead one to suspend opinion, but it is certainly not outside of the realm of possibility that the Q3 loss is further eclipsed.

Hopefully 3rd times a charm, but I have no plans to overstay with my short position and a stop loss at $300 is in place. JCG

Follow me on Twitter @firehorsecaper

Tesla short is the fellow on the right, to be clear.

Comments »

SUPERNOVA INVESTING : URANIUM

Symbol U, atomic #92, Uranium is Earth’s heaviest natural occurring element in the periodic table.

periodic_table

Earth is dominated by the following 4 elements; Oxygen #8, Magnesium #12, Silicon #14 and Iron #26. For reference Silver is #47 and Gold #79.

Uranium has garnered a lot of attention this far in 2017. Little wonder, as the uranium plays are up nearly 60% since the deemed pro-nuclear Trump was elected in November 16′. Using the largest uranium ETF, ticker URA – Globe X Uranium ETF as a proxy for the space, https://www.globalxfunds.com/content/files/Global-X-Uranium-ETF-1.pdf ,one can clearly see the pain inflicted over the last 5+ years;

2017 +27%, 2016 -1%, 2015 -37%, 2014 -23%, 2013 -21%, 2012 -19%, 2011 -60.%. From inception (11/4/2010), URA is down 79.5% cumulative.

U3O8 uranium currently trades as $25.31.lb. down 81.4% from the 2007 high of $136/lb.

uxc_graph_u3o8

The merit of nuclear power on metrics of both energy security and a low-carbon future are beyond refute. Real facts;

fuelcomparison

1 kg. of uranium, post enrichment and used for power generation in light water reactors produces 45,000 kWh of electricity. From an output perspective 1 kg. of uranium is equivalent to almost 10,000 kg. of mineral oil and 14,000 kg. of coal.

The comparisons on emissions are as striking as on energy output;

Greenhouse-Gas

Approximately 10% of current world energy supply comes from nuclear power. There are 447 operable nuclear reactors in the world at present, requiring 140 million lbs. of uranium per annum. Utility stocks are estimated at 478 million lbs., 3.4 year of demand. The largest 3 markets for nuclear power are France (58 reactors, 75% of overall power coming from nuclear), Japan (42 operable reactors, 40% of power pre-Fukushima disaster, only 3 have been brought online since all closed in 2011) and USA (99 reactors, 20% of overall power). A total of 60 reactors are under construction at present in China, India, South Korea, UAE and Russia . Twenty two of the nuclear plants under construction are in pollution ridden China, where 40% of growing electricity demand is still coal-powered, and the liveability of 25 of its largest cities hinge on nuclear power’s hockey stick growth projection. China is expected to have 40 nuclear reactors online by 2020 and to add 10 per annum thereafter. CNECC (China Nuclear Engineering and Construction Corporation) is the exclusive nuclear plant builder in China.

The USA only produces 4.3mm lbs. of uranium at present (2% of global output) versus an annual need of 56mm lbs., hence 93% of the uranium the US needs annually to operate existing nuclear plants is imported from places like Kazakhstan (39% of world uranium supply). Canada accounts for 22% of world supply and Australia 9%.

The World Nuclear Association (WNA) appear to have the best stats on the space. The top producer is Kazakhstan’s KazAtomProm at a 22% share. They recently announced a 10% production cut for 2017 (3% of world supply).

Canada’s Cameco is world #2 producer, not far behind KazAtomProm, at 18% of global production. The stock ticker is CCJ on the NYSE in US dollars and CCO on the TSX in dollarette’s (CAD). Despite all the seemingly good fundamental news on uranium, the price action has been nauseating. Cameco has some issues. Customer concentration is one, whereby almost 1/2 their long term sales contracts are with 5 key customers. Cameco received a termination notice last week from Japan’s TEPCO (Tokyo Electric Power, operator/clean upper of the crippled Fukushima plant) on a contract running through 2028 worth approx. $1bln. To give you an idea how offside TEPCO was on this long term uranium contract, 9.3mm lbs. spot is worth approx. $233,000,000 versus the $1bln contracted value, that is a $767mm potential hickey for Tepco. They have claimed “force majeure” in cancelling the Cameco contract, which might have had a shot of success if they had not accepted deliveries and paid for uranium 2014-2016. Sounds more like force manure to me, most expect Tepco will have to honor the contract via legal settlement. The news sent CCJ shares down 12.5% last week, although it remains above the 200-day moving average at $10.67.

The 2nd blemish to be addressed by potential longs is Cameco’s ongoing tax battle with the Canadian tax authorities, the venerable Canadian Revenue Agency (CRA). CRA are asking for C$2.2bln (US$1.7bln) in back taxes related to a purported tax dodge run by Cameco 2005-2015 where C$7.4bln of earnings were allegedly run through a low-tax Switzerland subsidiary. Most expect this case to be settled out of court in either 2017 or 2018, but the magnitude is unsettling to say the least. Plenty of press on the matter for those that would like to weight the merit of the case. The market cap of CCJ, as noted, the 2nd largest global uranium producer, is $4.15bln or 10% of TSLA ($40.4bln), as a point of reference.

There is a high degree of idiosyncratic risk in buying the listed equity of  individual uranium companies. The largest ETF highlighted above, URA has enough daily turnover to be considered liquid, but it small at $250mm in AUM (MER 0.70%). The weighting of the ETF in Canadian uranium names is high at 60% (23% in Cameco alone). The Kazakhstan names do not have listed equity.

For those seeking modest allocations to the uranium space, I would recommend looking at URA for the diversification, but shorting CCJ to reduce the single name exposure. With the proceeds of the CCJ short I would buy smaller US producers (some better described as micro-caps) as they will likely have few headwinds under the current administration (i.e. permitting, production, and expansion). The smaller players are largely unhedged without long term supply contract hence they provide more leverage to the underlying uranium price.

A sustained recovery in uranium equities depends on uranium prices staging a recovery from the depressed levels we have seen over the last several years. We have smoke, we need fire. JCG

Note: Long CCJ (1% weighting), but looking to diversify near term to a broader grouping of uranium names.

Comments »

NEIMAN MARCUS – CONTRARIAN LUX RETAIL CREDIT PLAY

There are few things held in more deplore than retail at the moment. The list of retail equities that have blown up year to date is long, with Ralph Loren being only the latest to banzai skydive, and miss the chute. Luxury retail has not been immune, despite overall robust consumer spending.

While ibankcoin’s readership is largely focused on equity investment/speculation, hopefully my blogs posts have opened a few eyes to the bond opportunities that occasionally arise and merit both your attention and deep due diligence.

Enter the venerable luxury department franchise, privately held, Neiman Marcus (NMG), rated B3/B-. The speculative grade (Caa2/CCC) cash pay (I’ll explain shortly) NMG 8% 10/15/2021 (cusip 570254AA0) got rocked to trade < $60.00 last week for the first time. The bonds are currently wrapped around $61.00 for a yield to maturity (a quarter shy of 5 years) of > 21%.

C24EugXVEAA1cuj

The capital structure is complex and the 8’s 21′ are as you might expect, rank near the bottom with a couple of classes of debt ranking ahead on them in terms of priority of payments. In the event of a tap out, the recovery rate would be expected to be low.

New York based independent credit research firm CreditSights moved to a buy from hold rating on the unsecured debt of NMG on 1-Feb-2017 on some “early signs of stabilization in the luxury good market, the benefit of a runway clear of maturities until 2020, and a decent prospect for neutral free cash flow generation over the next  year. While we view the prospects for recovery in the bonds as limited – given the significant contractual subordination to the ABL (Asset-based Loan) and large term loan – yield opportunities of approx. 20% offer an enticing return while the company attempts to get the story moving back in the right direction during 2017.”

The October 2020 term loan maturity is a big one at $2.9bln. There is $1.56bln of unsecured debt maturing 10/15/2021, including $960,000,000 of the cash pay 8’s 21′ and $600,000,000 of 8.75% 21′ PIK (Payment in Kind) notes.

Beyond poor operating results in terms of comps, margins and outlook, the market is reacting to the fact that NMG pulled plans for an IPO (filed August 2015, delayed and most recently pulled). The history of NMG is long, complex and storied. Founded in 1907 with a head office in Dallas, Texas, NMG has has varied ownership over the years. The first store outside of the Dallas/Fort Worth area was opened in 1957. NMG was publicly traded from June 1987 until May of 2005 when it was taken private via leveraged buy out (LBO) by Texas Pacific Group (TPG) and Warburg Pincus for $5bln. The exit was prolonged, but in October 2013 NMG was sold for $6bln to Canada Pension Plan Investment Board (CPPIB) and Ares Management, netting TPG and Warburg Pincus a $1bln gain versus purchase price. CPPIB & Ares went 50/50 on the venture contributing $1.6bln in equity ($2bln was “expected”) with the rest of the deal financed via the debt markets.

170119_SLATEST_DonaldTrumpSignsSVG.jpg.CROP.promo-xlarge2

Note: Trump’s signature. He is signing these executive orders Neiman Marcus? More recent renditions are even more similar.


Fast forward to today and approx. $900,000,000 of shareholders equity remains. The degree of leverage imparted in NMG on acquisition would make even Trump blush, and it has only intensified over the last 18 months. On the positive side, NMG is closely held by very savvy institutional investors that are used to taking the long view (CPPIB much longer in terms of liability matching). The next NMG IPO filing must be a successful one and beyond a century + long track record as a competent luxury retail operator, the elephant in the room is the immense debt burden approaching $5bln. NMG is well within their rights to suspend interest payments on the $600mm 8.75% 21′ PIK notes, a move that would save $52,500,000 per annum going forward. The signaling effect of such an election on the PIK notes would likely not be viewed as favorable though, and would likely take a potential IPO take-out off the table for the foreseeable future.

Owners with deep pockets is certainly a positive attribute. CPP and Ares have been equal partners to date, but there is nothing to dictate this has to be the case going forward. Ares would likely be somewhat reticent to add to a trade that has moved so far offside since late 2013. CPPIB, for their part, might look to creative ways to decrease leverage while operational efficiencies are given time to work through (cost cutting, reduced capex, further build-out of successful online offering “mytheresa”, etc.).

The current yield on the NMG 8% 10/15/2021 is 13.1%, if the bonds can be purchased for indicated $61.00 (+ accrued interest). The yield to maturity, as noted, is in excess of 20%. A plausible outcome would be for the current owners CPPIB/Ares to tender for the cash pay bonds, leaving the PIK bonds outstanding for debt servicing flexibility. Pure conjecture to estimate what percentage of the $960,000,000 of cash pay note holders might respond to a $70.00 tender offer, but given the prospects for a near term recovery from the dregs, I would expect at least a 50% take up rate would result. Deploying another $336,000,000 of equity under such a scenario would have the effect of extinguishing $480,000,000 par value of public debt, greatly improve the gearing numbers at NMG.

While not a pure “Red, White & Blue” lux retail play, given the Canadian connection, it merits further study for certain. Not for the widows and orphans due to outsized potential for losses , but in a measured dose Neiman Marcus debt may be worth a look.

Follow me on twitter; Caleb Gibbons @firehorsecaper

Disclosure; Not yet long, but vetting a 2.5-3.0% allocation to NMG 8’s 21′ in clips of 100k par value.


Comments »

TRUMP TAX POLICY: DBCFT – WATCH THIS SPACE

images

Corporate tax policy is very important for global investors, for obvious reasons. Trump’s first full week in the big chair is a good time to remind people of what the potential drivers are for relative valuation going forward. The topic of tax has come up already today, “We will cut taxes massively”, “We are going to impose a very large border tax”.

As a non-American, I can analyze such matters with a degree of detachment. It appears difficult for Americans to move on and accept that the card have been dealt, played, and that the spoils will be split with a different calculus than we observed under previous administrations.

A great deal of Trump’s campaign dealt with “Making America Great Again” and clearly on tax policy there is some wood to chop. To a man with a hammer, everything is a nail, and with the mandate Trump has been given, change is coming, hard and fast. Much of the focus to date has been on the timing, rate and window to be provided for US corporations to repatriate the offshore profits they have been hoarding outside of the grasp of the US Treasury. The headline bounty is large, estimated at between $1.7-2.3 trillion (dwarfing even China’s UST holdings to scale it!). The effect on the US dollar will overall be muted though, as the bulk of the offshore cash is already denominated in US dollars (brought back to the USA, less the TBD tithe of the US Treasury). Much of this liquidity has been invested conservatively as it was in many cases earmarked as dry powder for acquisitions, stock buybacks, etc. The ebullient debt markets have allowed this to be effected with ease by many corporate treasurers (onshore debt, offshore cash). Some form of tax “holiday” / amnesty program will see a goodly portion of the excess cash brought back onshore, given the new found flexibility afforded and concerns over such a pass ever being granted again (at least in the near future).

The big thing to watch with be the form of a “Border Adjustment Tax” (BAT), aka “Destination Based Cash Flow Tax” (DBCFT) that comes out of the other end of the corporate tax code transformation. This is much more complex than the disclosed plans on the individual taxation side (i.e. less complexity, less brackets, fewer loopholes, lower net taxes). Many of the USA’s trading partners have much lower corporate tax rates with many having fallen upwards of 10% over the last decade. Canada’s Federal corporate tax rare is 26.5%, down from 36.1% in 2006. Mnuchin (I’d like to buy an “i” for $500 Alex), Secretary of Treasury nominee, has already stated that a corporate tax cut is the biggest/best fix for corporate tax inversions, a topical M&A driver in recent years.

Robert Lighthizer, Trump’s pick for U.S. Trade Representative, has been critical of the abuses seen under varied free trade agreements. The US has pulled the plug on TPP, as expected. Trade partners due South and North have been put on notice that NAFTA is to be heavily reworked (Canada first up it appears as we have no wall issue o/s). Trump has already announced a “Border Tax” which would be troublesome to effect, given the presence of the WTO and others. Odds of Trump’s chest pumping border tax being a modified version of the EU’s 15-27% border adjusted VAT is high. The optics of such a plan are without precedent in the US, but  fit well with Trump’s stated objectives. It would the first time the US has imposed an internal tax on imported goods with an explicit rebate/exemption for exports. Such an innovative tax regime would also have merit from a budgetary perspective as addition taxes would be raised for the US Treasury, given the long standing net trade deficit the US typically runs.

USD strength would result under such a DBCFT plan. Tax policy watching could be more fruitful than Fed watching near term. The Fed die appears to be cast, at least over a 12-18 month time frame. The flames Trump provides oxygen to will likely quicken the pace of Fed Funds hikes upward march in the near term (an extra 25bp in 2017 over expectations and perhaps 50bp in 2018). King USD. Future posts will address the likely stress on EM bonds markets where US$3tln of incremental bonds have been issued since 2008. Higher absolute rate markets, steeper rate curves and challenged EM currencies will make for spirited trade indeed.

Follow me on twitter @firehorsecaper

Effected a family move to Tokyo, Japan over the holidays, but expect to more active going forward. JCG

Comments »

CONTRACTS FOR DIFFERENCES (CFD) MAHEM

The U.K. Financial Conduct Authority (FCA) sent shivers down the spines of CFD (aka spread-betting) providers yesterday with the release of their consultation paper, outlining plans to crack down on the sale of certain derivative products, including CFD’s and binary options to retail clients.

https://www.fca.org.uk/publications/consultation-papers/cp16-40-enhancing-conduct-firms-contract-difference-products-retail-clients

IG Group Holdings, formerly a £3bln + market cap player in the space was the biggest “mover” on the news, and as one might expect, the move way not up. IGG.L fell 38% to 485.1p, shaving £1.4bln off their market cap. Their market cap stands at £1.7bln.

chart

Another notable decliner was CMC Markets (CMCX.L) which also fell 38% on the day, closing with a market cap of £330mm. Plus 500, another provider noted a “significant financial impact” on their UK business after the FCA proposals, estimating a 20% reduction in revenues on stricter rules.

Background:

From the Australian Securities and Investments Commission (ASIC): thinking-of-trading-in-contracts-for-difference-cfds

CFDs were born in the U.K. in the 1990’s, the brainchild of UBS Warburg staffers. Retail began to get involved in the late 1990’s via a firm that was eventually bought by MF Global. IG Markets and CMC Markets are credited with expanding the popularity of the product from 2000 onwards.

CFDs are currently available in Australia, Austria, Canada, Cyprus, France, Germany, Hong Kong, Ireland, Israel, Italy, Japan, The Netherlands, Luxembourg, Norway, Poland, Portugal, Romania, Russia, Singapore, South Africa, Spain, Sweden, Switzerland, Turkey, United Kingdom and New Zealand.

The most popular head office domicile for providers include the US, Cypress (regulated by CySEC, the Cypress Securities and Exchange Commission), and the U.K. The only actual US based, CFTC regulated provider in the US that I am aware of is Nadex  (North American Derivatives Exchange) https://www.nadex.com/ , former known as HedgeStreet, which was formed in 2004 and bought by IG Group in 2008.

IG has a long history. It was formed by Stuart Wheeler in 1974, Investors Gold Index as a way for retail to trade gold prices as an index instead of trading the underlying commodity. The IG group is now one of the UK’s top 200 firms (up until yesterday at least) and is listed on the London Stock Exchange and the FTSE 250. IG posted net income of £131.9mm on revenues of £427mm in 2015. For 2016 through May they have a £207.9mm profit before tax on revenues of £456.3mm.

Regulation:

In the United States, under the Dodd-Frank Act, CFDs are considered to be “swaps” or “security-based swaps,” depending on the nature of the underlying on which they are based, and are subject to the regulatory framework for those products established by Title VII of the Dodd-Frank Act. For example, a CFD on Apple common stock would be a security-based swap (SBS) subject to the regulatory framework for SBS established by the Dodd-Frank Act. Under the Dodd-Frank Act, among other things, transactions in SBS with or for retail investors must be done on a registered national securities exchange and offers and sales of SBS to retail investors must be registered under the Securities Act of 1933. The CFTC has taken swift action when players misstep and market to US-based investors. http://www.cftc.gov/PressRoom/PressReleases/pr7341-16

Many jurisdiction, including the U.K., regulate CFDs and binary options under their respective online gambling rules (fixed odds gambling). The U.K.’s FCA has signaled via their consultation paper that the rules for binary options will be moving from being regulated by the Gambling Commission to the FCA under their interpretation  of the scope of the Regulated Activities Order of MiFID ii (The Markets in Financial Instruments Directive). The U.K. remain uncertain of what investor need is addressed by these products (30 seconds to 1 week time frames typical) and noted that 82% of clients lost money.

CFD providers expanded into binary options as the competitive landscape changed. Some are also offering a suite of leveraged ETFs for less aggressive traders.

It remains to be seen if the move in IG Group stock has been a overreaction.

It is said that there are 3 ways to lose money. Farming is the most certain, but gambling is the quickest. JCG

Follow me on Twitter; Caleb Gibbons @firehorsecaper

Comments »

INDIA’S DEMONETIZATION PLAYBOOK

_92323701_image1

Narendra Modi was even accused of trying the steal the thunder from the US Presidential election with the timing of his demonetization campaign. Trump was having none of it, but it is still the biggest news you have largely ignored over the last week. India has effectively invalidated 80%+ of the legal tender in circulation into coupons that can only be exchanged in specific places and quantities (INR 4,000 initially), with the requisite identity proofs. With the unbanked estimated at 50% of the population and the unpapered estimated at >1/3rd, one can just imagine the mahem that has ensued. USD/INR = 68.56, hence the 500 rupee note is worth US$7.40. Apparently honest people have no need to worry, but in concert with daily limits on ATM withdrawals the public are forming orderly queues, at their gold dealers. The basis between financial gold and physical gold is reportedly skyrocketing in India, a trend that could have legs as other jurisdictions phase out their high denomination legal tender.

Singapore announced the phase out of their S$10,000 (US$7,067) banknote in early 2014. The ECB has plans to stop printing the €500 note (1/3 of € in circulation by value) by the end of 2018. All of these moves are defended as another quiver in the fight against tax evaders, organized crime and terrorists. In India, Naxalite, a Communist guerrilla group, mostly associated with the Communist Party of India, are target #1 of Modi’s demonetization plan.

Many fear the war on global cash could have unintended consequences. Some currencies are more fiat, by nature, than others. The USA holds 8,134 tonnes of gold, representing 76% of forex reserves. There has been talk of the US abolishing the $100 note which represents a full 75% of the value of banknotes in circulation, $969bln of $1.3tln. The majority of US$100 bills are held outside of the contiguous US States. I can see Trump eliminating the penny and nickel on economic utility grounds before the $100 is touched, but clearly anything can happen in the Upside Down. India holds 558 tonnes of gold, representing 6% of foreign exchange reserves. The ECB in comparison holds 505 tonnes of gold (28% of forex reserves). The largest gold ETF GLD is backed by 935 tonnes of gold, but the actual gold is unallocated (i.e. financial gold).

Tax collection rates in India are abysmally low, due in large part to agriculture at 60% of GDP being a tax exempt sector. As one would expect with a billion + populace, VAT (Value Added Tax) receipts dominate. Demonetization has come on the heels of a disappointing tax amnesty program that was touted as having the potential of outing 30 tln rupees worth of “black money” (625.5bln was recovered onshore, > $100mm USD).

Allocated gold is likely to catch a bid in the current environment, regardless of the trajectory of financial gold. JCG

Follow me on twitter; Caleb Gibbons @firehorsecaper

Comments »

$PVG : PRETIUM RESOURCES – THERE’S GOLD IN THEM THAR HILLS

The $5 trillion gold market has, yet again, become a head scratcher for market participants.

Bears, esp. on technicals grounds, call for further downside. There are two distinct scenarios which have yet to play out fully. The move in gold over the 9/11 – 12/15 could be a correction in a dominant bull market (my current positioning/thinking). Alternatively, the 12/15 – 9/16 gold rally could be a correction in a dominant bear market.

Bulls point to supply/demand fundamentals and likely ongoing support from global central bank shenanigans. The current geopolitical environment is what one would call supportive of higher prices. Think USA/Russia Cold War 2.0., N. Korea (nukes), the South China Sea (China, or “Jhina” as Trump appears to pronounce it) and Mosul, Iraq (ISIS).

imgres

proxy

southchinasea

proxy-1

Bitcoin has been quietly rallying and currently trades above $635. The best explanation I have heard thus far for the phenomenon of bitcoin is that it is a solution looking for a problem. Gold has been singled out as nature’s bitcoin. The forthcoming bitcoin ETF (Q1 2017 approval?) from the twins; Winklevoss Bitcoin Trust, ticker COIN has been touted as a reason for a skyward trajectory in the leading cryposcrip going forward. Truth really is stranger than fiction. I would fade that move, although the underlying blockchain technology clearly has merit. The recently approved IEX exchange (The Investors’ Exchange) will be utilizing blockchain technology with partner/spin-out TradeWind to roll out a safer, more transparent gold trading alternative. I for one would prefer to trade gold on Katsuyama-san’s portal and give fictional Satoshi Nakamoto-san’s fraud fraught bitcoin rabbit hole a wide berth.

The LBMA gold conference here in Singapore kicked off Monday. It appears ICE got the jump on LBMA for a gold future to help clear the London daily auction (central clearing via ICE). If the fixed income derivative market is any guide, 1st mover advantage is important and to the victor go the spoils. Watch this space.

1x-1


ctm8hsdwcaarhbz

I have written a couple of posts on the gold market in 2016 and way to play it. January 10th would certainly have had you in early on the 2016 move, but as if often the case, gold equities are not for the faint of heart. Most names are 20% off their 2016 high print.

http://ibankcoin.com/firehorsecaper/2016/01/10/gold-get-some/

http://ibankcoin.com/firehorsecaper/2016/04/15/franco-nevada-corporation-a-gold-royalty-play-to-ponder/

PRETIUM RESOURCES:

This follow up post will be on Pretium Resources, PVG on the NYSE the TSX in Canadian Dollars. PVG closed up 6.21% on 10/18/16 to close at C$12.83 in CAD. PVG in the US closed up 6.41% to US$9.80. Market cap US$1.8bln.

2016 YTD performance; PVG +94% (21% off YTD high of $12.41), GDX +76%, GDXJ 111%.

Latest Pretium investor presentation (required reading):

http://s1.q4cdn.com/222336918/files/doc_presentations/2016/denver-gold-forum-2016.pdf

Pretium is a Canada-based (British Columbia) development stage gold mining company, slated to move to production by mid-2017 of their 100% owned Brucejack project in Northern B.C.. Brucejack’s Valley of the Kings (VOK 6.6mm) and the nearby West Zone (0.6mm) have proven and probable reserves of 7.5mm /oz. of gold. An 18 year mine life is assumed. All-in sustained cost (AISC) per ounce of gold is US$446 (several majors are > $1,200 as a comp). Target production is just over 500,000 oz. per annum. The project IRR with gold at $1,250 exceeds 35%. The project also contains a lot of silver, the bulk, 26mm oz. P&P, at the West Zone with an additional 4.6mm oz. of silver from VOK.

What makes the Brucejack site and hence Pretium so compelling?

High grade deposit. Gold at 14.1 g/t. It is not an exaggeration to say that Brucejack is one of the highest grade gold discoveries of the last 1/2 century. This is both good and bad in that high grade deposits tend to be uneven. Grade varies considerable overly the broader deposit. The road to 7mm ounces P&P has at times been harrowing for investors. A relatively large scale 10,000 ton bulk sampling conducted by Snowden Mineral Services in 2013 netted 4,215 ounces of gold (versus 4,000 oz. expected). Strathcona at one juncture in October 2013 burst Pretium’s balloon, sending the stock down nearly 30% to sub C$3.00 by stating, “There are no valid gold mineral resources for the Valley of the Kings zone, and without mineral resources there can be no mineral reserves, and without mineral reserves there can be no basis for a Feasibility Study.” Snowden Mining Industry Consultants took over the study from Strathcona at the direction of Pretium management, employing Pretium’s preferred bulk sample method (i.e. run the full sample through the mill and see what comes out, hard to argue with as it is difficult to cherry pick a 10,000 tonne sample). Pretium have reported some intersections grading as high a 1,000 grams of gold per metric tonne. Impressive indeed.

As an aside, Strathcona have retained a very strong reputation in their field. Their report on the now famous Bre-X scam in May 1997 laid bare the record setting fraud that had been perpetrated on global investors. At its peak, Bre-X had a $6bln market cap.

http://www.wsj.com/articles/SB86279977155130500

A full quarter before the definitive Strathcona report the stock fell from C$20 to the mid $2’s when the proposed 15% partner Freeport McMoRan Inc. (FCX) found scant amounts of gold from their independent testing of samples drawn by drilling parallel to Bre-X’s. I was a buyer for size, not believing that a scam of this magnitude could be possible. The meticulous detail required to salt over 3km of core samples over an extended period and have them tell an intelligible story seemed to me a stretch. The report was to come out on a Friday and the stock had levitated modestly to a 3 handle. “Dr. No”, as Strathcona’s Farquarhson was known, put a scare into me given the highly spec nature of my stock wager with that days horoscope putting me over the edge. I sold 10,000 of my 12,000 shares and saw them open the following Monday (post report – no gold) at 8 cents. I had clearly dodged a bullet and did what any 30 yr old punter in the same situation would do. Hanging my hat in Japan at the time, I walked into a Harley Davidson dealership and pointed to the two-tone silver/black 1997 Softail Custom. ¥2.1mm changed hands and I kindly asked the proprietor to point me the direction of central Tokyo as the 2-wheeled beast sprung from the captivity of the showroom.

Managements’ vision/acumen. Robert Quartermain is Pretium’s Founder, CEO and also acts as Chairman. Quartermain’s history with the Brucejack site is very interesting in and of itself. While at Silver Standard, where he spent 25 years of is 40 year mining career, the Snowfield/Brucejack assets were purchased for $3mm (5 cents per ounce of silver in the ground). Pretium’s IPO at C$6 raising $283mm in 2010 provided the capital to allow the company to purchase the assets for $450mm and Pretium’s market cap now stands at $1.8bln. At 0.63% of NAV and commercial production less than a year away, I do not think the story has fully played out yet.

Operations; permits / funding / construction. Permitting is a huge issue in all jurisdictions. The delays can be staggering. A decade ago a time frame of 3-5 years would be typical for the requisite environmental assessments and permits. Today estimates would be 7-10 (The Canadian  government recently approved the BC domiciled Pacific Northwest LNG project with 190 conditions, mercy me).

The full project cost (through production in mid 2017) of US$686mm has now been fully funded, $540mm financing package (largely debt) and $146mm via equity. The amount of support infrastructure required for such a remote location is daunting and all observers have been impressed by the progress Pretium has made to date. To put this capital budget in context, Toronto is spending C$3bln ($2.3bln) for 1 (one) subway stop in Scarborough (Manhattan’s Second Ave. line will have a comparable cost at $2.23bln/mile, but at least it has 3 stops!).

Top Shareholders (%): Van Eck Associates 9.97 Silver Standard Resources 9.50, Zijin Mining 5.04, Black Rock Asset Management 4.97, Orion Mine Finance 2.57, Pretivm Management 2.00 (41% institutional ownership). Franco Nevada Corporation have purchased a modest royalty interest in the Brucejack project.

Given the site is open in all directions there certainly exists the possibility of an increase in the reserve numbers over time. Most see the likely catalyst as being M&A related as the majors are keen to fill gaps in their production profile and average down their ASIC in low risk jurisdictions. Post permitting, Canada certainly fits the bill.

Analysts are bullish on the Pretium story, with targets as high as C$20 one year out (vs. C$12.83 spot, +55%). I think it could eclipse the all time high of $18.24 and reach $20 which would be good for a double from spot $9.80. It certainly will not get there is a straight line, but hopefully it will be devoid of the high wire peril evident in 2013. The story has been effectively de-risked, as much as a small cap gold mining stock can be.

Hopefully the toys will be funded is a more traditional fashion this time around. Street bikes are now off limits (wifey), but maybe a Nissan GT-R?

JCG

Follow me on twitter @firehorsecaper

Disclosure: Long 1/4 portion PVG in Canadian dollars, usually hold in USD as well. High beta gold play.

Note: Gold – a good delivery bar (think central banks and bullion banks) contains 400 troy ounces (12.4kg. or 438.9oz). A kilobar (preferred in Asia and with individual investors) weighs 1000 grams and contains 32.15 troy ounces. An ounce of gold contains 31.1 grams.


Comments »