We have had many first’s in 2016, with the latest being the long standing record for the highest gold:oil ratio ever recorded. Currently at a 37 handle, an elevated ratio of how many barrels of oil an ounce of gold can procure “normally” portends danger. Prior spikes have served as tombstones for rocky times in global financial markets. The gold leg of this ratio is holding in fine (neutral from a statistical perspective, over a decade observation period), especially in light of the seemingly never ending strength in the USD, over the last 18 months in particular. The gold:oil ratio over the 1968-2016 period now has a 4 handle, measured in terms of standard deviation. A betting man would argue that the ratio resolves itself largely via a rally in oil from here (gold typically rallies with oil, although one would expect at a slower pace given the weak tether). VaR based stress testing does have its limitations, admittedly, but 4 sigma events are “rare”. In terms of daily observations, a 4 std. dev. move would be observed once every 43 year (twice in a lifetime). Many risk management models both test and report to a 99% confidence interval which equates (on a 1-tailed basis, typically the cpty’s “risk leg”) to a 2.33 standard deviation move. History does not repeat, but it certainly does rhyme. Standard deviation readings of this magnitude lead one to question the normality of the distribution being studied and on this metric oil is also the squeaky wheel. ‘Fat tails” can only explain so much in the end and despite both the geopolitical and technological developments bringing the nitrous to the supply side of the equation, global oil demand still exceeds 1,000 gallons a second. Gold mining stocks have not been this cheap, on traditional valuation metrics, since gold was $300 per ounce. There appears to be a thumb on the scale. Place your bets. JCG
If you enjoy the content at iBankCoin, please follow us on Twitter


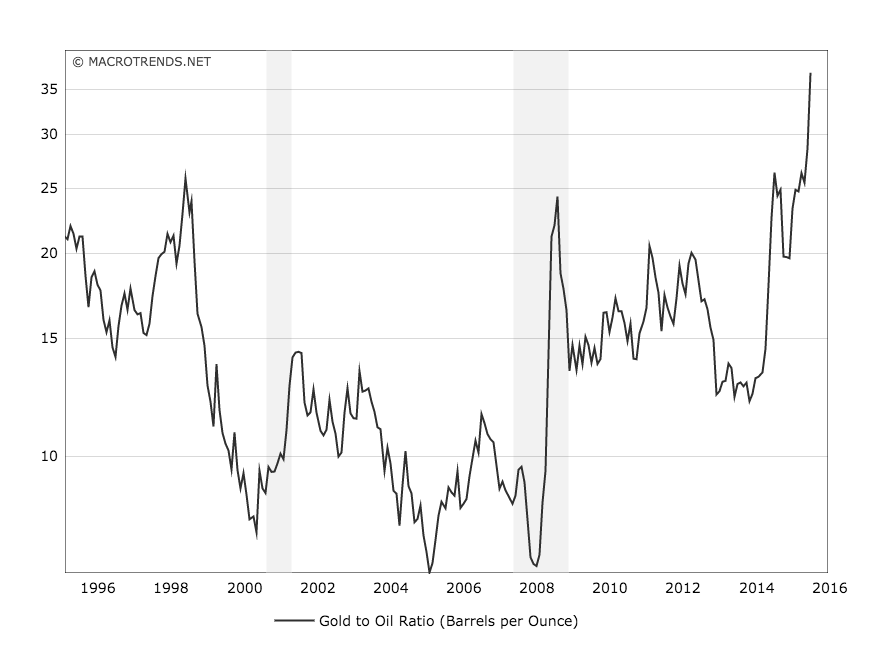
Can we get a visual? Thanks
Macrotrends.com chart added. Many time scales available, message unchanged. JCG
Thanks. Pretty cool. The 1973 period is curious, but the price dynamic is a little bit different; both prices going up then whereas both prices are coming down today.
what does gold have to do with oil?
next you should compare oil with the price of a Big Mac
that chart doesn’t show oil/gold ever to be in a range where it mean reverts. it trends. and it’s showing a break out
Precisely. The two aren’t cointegrated. Gold and gold miners are. I’d look at those for the pairs trade.
The ratio was not picked out of this air. Most sovereign nations and for that matter sovereign wealth funds get their US$ (i.e. fx reserves) from the sale of oil. Some of these petrodollars are invested in gold. When the pendulum swings (like now) reserves must be sold down, but typically financial assets like UST are sold before gold holdings. JCG
“but typically financial assets like UST are sold before gold holdings” Really. What is your evidence for that? Gold spent 20 years in a bear market while treasuries steadily climbed in value…even as the gold bear market ended…and they are still climbing, despite the sometimes wild fluctuations in the gold price. No “ready-made” correlation in that.
Hahaha! I time-checked your article with the one I saw on ZeroHedge:
http://www.zerohedge.com/news/2016-01-17/what-crisis-goldoil-ratio-predicting-time
You beat them by just a few hours 🙂
Firehorse – we were talking about the ratio last year at this time. http://ibankcoin.com/rcblog/2015/01/27/whats-working-today-2/
Its gone on longer than I ever expected. A lot of wrong bets along the way for me. Something has to give… (I think gold crashes)
Uncle, Could well happen, but from a pure technical perspective oil rising has a higher probability near term. Of the precious metals I’m most bullish on palladium.