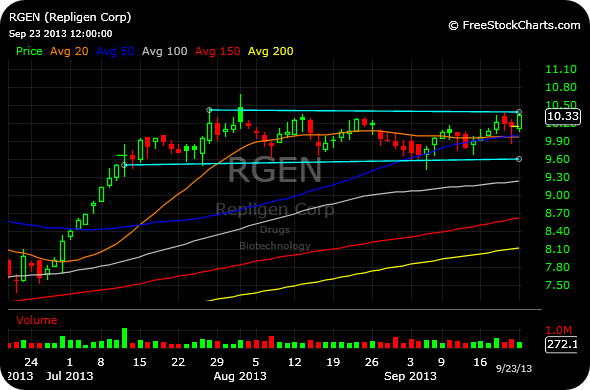
First, from my video recap I noted RGEN as a viable long idea I liked on strength above $10.40, not yet extended unlike many other biotech/biopharmas. This is not t be confused with REGN, which I do indeed view as too extended, overall, as a long setup here. You can see the RGEN chart, below.
(see more content after the chart)
______________________________________________
______________________________________________
Next, from my prior post about Netflix and Home Depot, here is an excerpt from my Weekly Strategy Session fleshing it out. Home Depot was my top short idea headed into this week.
Short Idea: Home Depot, Again“Old age ain’t no place for sissies.” -Bette DavisNeither, might I add, is short-selling. In particular, short-selling in a bull market ain’t no place for sissies, either. Alternatively, it is no place for cowboys–Just ask the shorts in high beta momentum stocks like FB NFLX TSLA who have been shorting the entire move higher.As I have noted before, generally speaking in a bull market I tend to focus any shorts on mega cap stocks which are highly unlikely to be takeover targets, since the risk of a takeover increases in a bull market when short-selling a small or mid-cap stock. I also tend to gravitate towards mega caps with a low percentage of shorts in the float, to avoid falling victim to one of the numerous and vicious short squeezes we see in heavily-shorted, high beta stocks during bull markets.With this in mind, Home Depot fits the bill as a short idea, again, after this most recent snapback rally–The overall thesis for a deeper pullback remains intact.
First and foremost, the multi-year chart, first below, shows the steep angle of ascent remains largely uncorrected since 2011. Heading back down into the mid-$60’s to retest its 2000 highs seems likely.
Zooming in towards the daily timeframe, we can see after the recent rally that Home Depot printed a “bearish engulfing candlestick” on Friday, with an uptick in selling volume.
The bearish engulfing candle on a daily chart sees price breach the highs of the previous candle, but then a close below the prior candle’s lows, all within the same day. When this occurs after a prior rally, it puts us on watch for a downside reversal, particularly if we see follow-through lower. I would infer that any further weakness early next week is a viable short entry, with a protective buy-cover stop-loss above $79.
Ideally, a short thesis is looking for a close below $72, thus confirming the double-top (the upper horizontal light blue line) and signaling much lower prices to come.


Apple iPhone finger print sensor works on nipples.
Only a matter of time before there is a great photo.
https://www.youtube.com/watch?v=4bG6cjaMZx0#t=98
Funny