
Despite a vice president at Walmart making headlines on Friday for calling February sales “a total disaster” for the famous big box retailer, the longer-term breakout which the stock staged last year is far from in jeopardy. Calls for Walmart’s demise to creative destruction (read: Amazon) have been popular for years now, especially back when the stock was dead money from 2000 through 2011.
In fact, I used part of that sour sentiment (among a host of other factors) back in October 2011 to look for an against-all-odds long-term breakout in Walmart, which I discussed in this blog post.
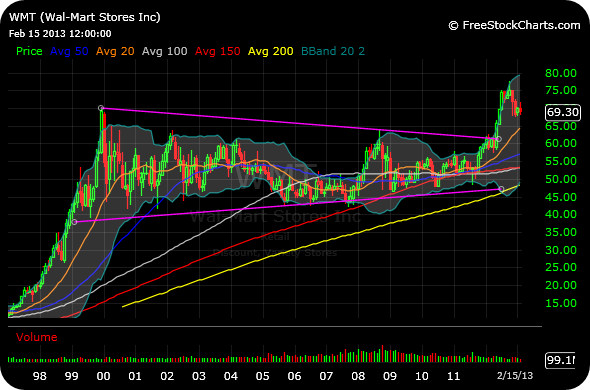
Even with Friday’s selling, a further pullback could easily materialize. And yet, as long as the $63 area holds there is not much evidence of a major reversal lower. Furthermore, Walmart had punctured its upper monthly Bollinger Band during its breakout, a good sign of strength. After such an event, a pullback to the “middle band” is likely. In this case, the middle Bollinger Band is the rising 20-period monthly moving average, the orange line on the chart below. On its face, there would be nothing inherently bearish about such a retracement.
While the shorter-term timeframes are less optimistic for Walmart, long-term investors do not yet have much to fear. As long as the primary breakout point holds as support, Walmart may very well continue on higher as one of the most hated, mocked brands in the Dow Jones Industrial Average, coexisting in an Amazon world quite well.
NOTE: I will have plenty to say about the market in general this weekend for members of my Weekly Strategy Session. Please consider checking it out. I take pride in the depth of analysis, issue coverage, and ideas presented.
Have a great weekend.
__________________________________


One comment
Pingback: UPDATE: People of Walmart Trap Bears in Trailer Parks | chessNwine