That’s what happens when you’re late to the bull party…
_______
[youtube:http://www.youtube.com/watch?v=YYfC5e9Kn-E 550 412] Comments »That’s what happens when you’re late to the bull party…
_______
[youtube:http://www.youtube.com/watch?v=YYfC5e9Kn-E 550 412] Comments »Here is a video that I made for members of 12631 (A premium service available to members of The PPT) at the end of January. In the video, I detail the “dark cloud cover” candlestick pattern, as it applies to Freeport McMoRan. I also believe that FCX has made an intermediate-term high, and I am looking for some more weakness, followed by a period of consolidation.
__________
[youtube:http://www.youtube.com/watch?v=a9dAI_4_wVk] Comments »
__________
Plenty of excellent sites out there include more macro commentary in their links, namely Downtown Josh Brown and Abnormal Returns. I thought I’d share a “Traders Only” collection. Here are the traders that I am reading today (click on links):
There are plenty of other key sources that I check everyday, so be sure to look on the right hand side of your screen for my Blogroll.
Comments »[youtube:http://www.youtube.com/watch?v=og-f7G4FFYE&feature=related 550 412] ____________
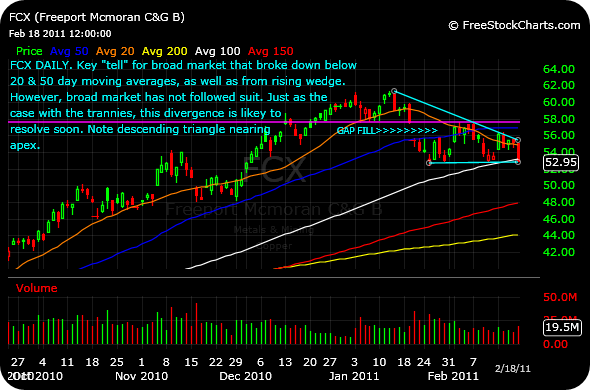
My once-reliable Freeport-McMoRan broad market “tell” has been running a few misdirection plays at me of late. While the broad market has been printing fresh 52 week highs on a daily basis, Freeport has been churning below its 20 and 50 day moving averages, with a close below the 100 day moving average to finish out last week to boot. Beyond that, the large cap copper and gold miner appears to be nearing the apex of a descending triangle, which often resolves lower. Thus, I am inclined to believe that this week will resolve this glaring divergence, one way or the other.
You may recall a few weeks ago that the transportation stocks were diverging from the broad market as well, only to quickly recover and help to propel the S&P even higher. Just as with the trannies, Freeport has been an historically sound broad market leading indicator. Accordingly, I do not expect the divergences to remain in place for much longer.
____________
____________

____________
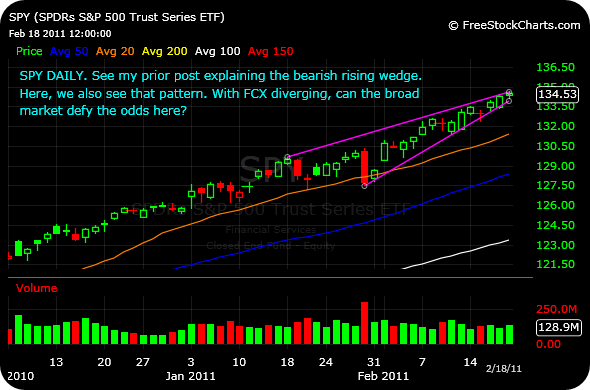
For many traders, one of the most confusing chart patterns is the bearish rising wedge. After all, how can a pattern possibly be bearish if we are seeing a series of higher highs and higher lows? Before we delve into an answer, let’s briefly recap what comprises the rising wedge.
First, rising wedges are seen as continuation patterns in downtrends (similar to the “bear flag”), or reversal patterns in uptrends. You are looking for the initial wide range of higher highs and higher lows to narrow as price converges at the apex. You also want to see at least two reaction highs (touching the upper trendline), and at least two reaction lows (touching the lower trendline). At that point, the presumption is that once the rising wedge breaks down, it will do so very quickly and retrace, or give back, all of the gains from the entire pattern. Unlike single candlestick reversal patterns, such as the bullish hammer, it is not nearly as important to wait for confirmation of a rising wedge breakdown, since once the lower trendline is broken the rate of downside acceleration tends to violently increase.
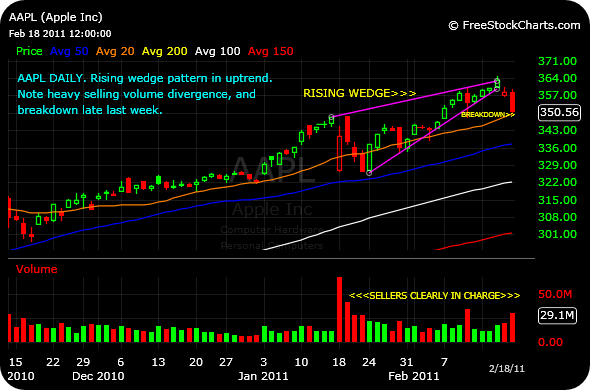
Beyond price, a lack of strong buying volume as a stock works through a rising wedge supports the bearish thesis. In confirmed downtrends, bears are looking for an overall lack of volume in the wedge to give them additional confidence that it is merely a continuation pattern before heading lower. In an uptrend, though, you are looking for signs of distribution. In other words, you want to be on watch for a situation where heavy institutional players are selling their shares to exuberant retail buyers.
As an example, let’s take the current daily chart of AAPL. Clearly, Apple has been in an overall uptrend on multiple timeframes since March of 2009. However, over the past month there can be no doubt that sellers have been dumping shares in size, as denoted by the large red volume bars. At the same time, price has been making fresh 52 week highs, despite the distribution. Further, drawing simple support and resistance trendlines over the past month yields our bearish rising wedge pattern, from which price broke down on heavy selling volume last week. A downside price objective of $326 would retrace the entire move.
____________

____________
Inside The PPT, the seasonality statistics for JMBA are quite impressive, indeed. As you can see below, returns during March and April over the past five/six years have been staggering, especially when compared to other months of the year. What accounts for this? Well, the easy answer is that the JMBA business model is going to thrive in most parts of the country during the late spring and summer months. So, hedge funds are probably accumulating in March and April to get out in front of the expected uptick in earnings.
Seasonality
Month Avg % Return Total # Months # Months UP # Months DOWN January -0.458 6 2 (33.33%) 4 (66.67%) February -2.579 6 4 (66.67%) 2 (33.33%) March 21.524 5 4 (80%) 1 (20%) April 18.093 5 3 (60%) 2 (40%) May -0.783 5 2 (40%) 3 (60%) June -4.646 5 1 (20%) 4 (80%) July -15.503 5 0 (0%) 5 (100%) August 1.03 6 2 (33.33%) 4 (66.67%) September 10.529 6 4 (66.67%) 2 (33.33%) October -9.214 6 2 (33.33%) 4 (66.67%) November -1.546 6 3 (50%) 3 (50%) December -4.797 6 3 (50%) 3 (50%)
___________
Beyond the statistics, a look at a zoomed out daily chart supports the idea that JMBA is ready to move up and out of a nine month base.
___________

DISCLOSURE: I have no position in JMBA…yet.
Comments »