Here it is folks, Alex Dalmady’s report (the whistle blower):
Comments »PPT Update
I’m looking at the futures and I am wondering how many times we can gap down and recover above 820. I’m guessing not too many. We need a clean cut through, like a scorching knife through butter – a gap down that is unable to fill intra-day, you know…one of those “OH SHIT!” gap downs.
If you are going to short later today, which sector(s) would you short? You may choose multiple answers.
The PPT is looking FAStastic! Here are the machine’s current readings:
1) Market Overview/Top & Bottom 10 Stocks:
2) Top & Bottom 10 Industries/Top & Bottom 10 ETFs:
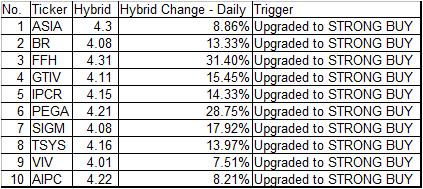
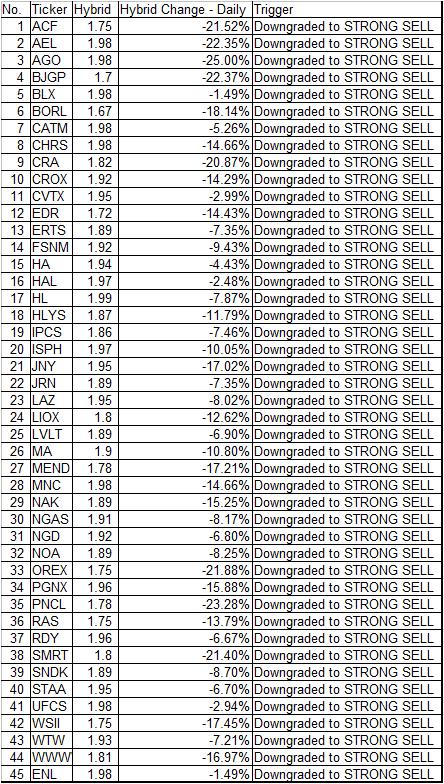
3) Stocks Recently Upgraded to Strong Buy/Downgraded to Strong Sell:
There are a lot more features, but this is all for now. Goodnight.
Comments »Watch Flagging Action, 50-day MA Churning, Sym Tri Breaks
You know it was coming. You may choose multiple answers.
I am back from taking a full week long break. I think all the negative news was starting to get to me. When you wake up in the morning and read the WSJ and IBD, you mostly find bad news. When you turn on CNBC, you find more bad news. Finally, while reading your favorite blogs, you come across even more bad news. I had to stop that news flow for a few days and just get away from it all. I am back this week to resume my regular trading activities.
Take a look at the SPX and COMP below:


We are in long-term symmetrical triangles. What the market is figuring out right now is whether it wants to go up 20%+ or down 20%+. Ultimately, I do believe we head lower, but not before some major whipsaw to flush out more traders. In the short-term, you can see that the market is forming a multi-week flag. On the SPX, it is between 800-870. On the COMP, it is between 1430-1600. I don’t even bother using the DJIA anymore as it is skewed quite a bit.
One important thing to note is the 50-day MA. Currently, the SPX is trading below it while the COMP is churning above and below it. Both are technically extremely bearish. Take a look at the REITs as the vast majority of them are either breaking down or setting up for a break down. This is in addition to my favorite sector (financials).
In other news, something like this really scares the shit out of you.
Enjoy your break today.
Current Winner: Erin!
Sorry, but I have to add Margaret in here too:
Comments »I’m Still on Vacation Until this Fuckery Ends
I’m glad that I’m still on break (not having traded for a few days now). Looks like I picked the right time.
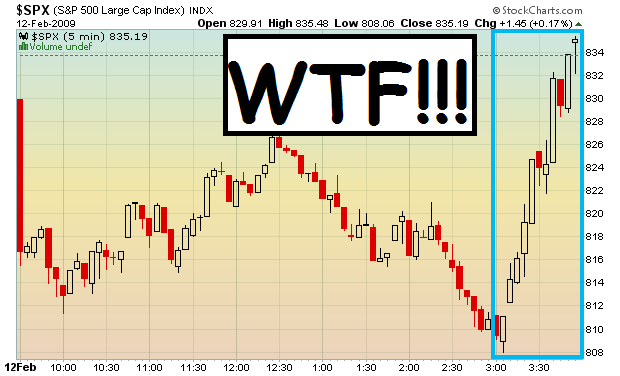
We saw a classic WTF pattern yesterday. If you don’t know what those are, they frequent occur during the last hour, half-hour, or 15-mins of the trading day and come in the form of a HUGE spike. It is a sudden and massive reversal. If you get caught on the other side, then you know immediately, without a doubt, that you are screwed. Whatever gains you had get wiped out instantly and you get closer to taking a loss each second you sit there bewildered by how things, such as hot air from the government, could totally ruin your trading day.
You know what I’m talking about. We’ve all seen this pattern too many times last year. It appears to have resurfaced like some kind of trader-hating virus bend on taxing your ass. Clearly, both bulls and bears had a difficult time today.
I signaled caution to traders that yesterday was not a good day to trade. I was actually cautious the whole week, unable to find decent opportunities. Sometimes, you do very well just sitting around reading your (currently) favorite book, “Trade with Passion and Purpose” by Mark Whistler (Wiley, 2007), while avoiding a huge mess. Also, a shout-out to Lauren over at Wiley today for hooking me up with a complimentary copy of “When Giants Fall” by Michael J. Panzner (Wiley, 2009). You can read his blog over at Financial Armageddon. I will be reviewing both books.
Once again, I encourage you to practice some caution. Don’t forget that the market is closed on Monday, so plan according. I say “caution”, because the market is “boxed in” once again. We have major support at 805-815 (as witnessed). This is in addition to the already tested 820 level. We are currently ar 835. The 20-day MA is 838 while the 30-day MA is at 854. In between these two MA’s, we have 850, which is an important psychological area. You might want to lighten up on your position sizes and take less risk until a clear direction is determined.
Here’s what happened (besides the massive short squeeze): we formed a falling wedge over the past 3 days. Then, we bounced off of the lower bollinger band at 808 almost perfectly. I have no idea what happens from here. The government can come out at any time to announce whatever they want to announce. Don’t trade if you don’t have the upper edge.
WHAT THE FUCK
Please consult the iBC Dictionary for the “WTF Chart Pattern“.
It’s always on time! (Note: 3:00PM)
Comments »Rectangular Consolidation/Range Contraction @ 820-840 SPX
Here is today’s poll. You may choose multiple answers.
UPDATE: Jobless Claims – 623K vs. 582.25K previous, 510K/650K consensus.
The levels to watch are:
1) 820-840 SPX – The range has narrowed and the past two days may be setting up for a rectangular consolidation are, most likely for a bearish continuation. A gap down below 820 and a gapup above 840 need to be taken seriously.
2) 20-day MA – Currently located at 839-840, the SPX could not break out above it all day yesterday.
3) 850, 30-day MA (858) Resistance – This is in addition to the 50-day MA(867) and the upper line segment of the triangle (875ish).
4) 820-822 – This is a major level that was tested intra-day yesterday. 820 and 815 are also psychological support areas in addition to a break in the November lower trend line.
Keep these in mind for today.


