iBankCoin
Joined Nov 29, 2008
329 Blog Posts

SPX Within 902-930 Neutral Range / Continued Consolidation / Holdings Update

I currently hold 16 long positions, at around 5% per position, and an 25% cash position. They are as follows: PLLL, MTSN, HGSI, BZ, FLOW, SPRD, PWAV, ABK, GKK, EMKR, ICAD, NNBR, DVAX, AHD, XTEX, and BEE. In total, I was up 4% today, solidifying my own breakout with YTD returns in excess of 155%. I sold only one position, TVL, for a 71% gain. Since I am considerably long at the moment, I will seriously make an attempt to not purchase any more stocks, at least for one day. However, if a setup looks really, really good, then I won’t just sit there like an idiot and not buy. You know what I’m saying?


I’ve noticed several characteristics with these dollar menu stocks. First, they are obviously more profitable that higher priced stocks. You can make 20% in half an hour in many cases. Second, they are more fun to watch, especially when you buy before a breakout. It gives you a margin of safety and your gains act as a cushion for your portfolio. Third, they are amazingly resilient against adverse general market conditions. Normally on a a-2% down day on the SPX, most stocks should be down. However, most of my $1-3 stocks were either up or down just a few pennies. Why wouldn’t anyone play these stocks?

The overall market is pulling back and we are in a multi-day process of consolidation. The COMP is still fighting at the 200-day MA, which the SPX, RUT, and DJIA have yet to reach. The only way the market can fully advance is if the COMP can breakout, and stay above the 200-day MA. The other indices remain within striking distance of the 200-day MA. Today’s volume was low, which is indicative of a pullback and not some scary massive selloff.

Finally, I’ve literally gotten about one e-mail almost every 5 minutes (no joke) from a whole bunch of traders. Many of you brought up some very interesting picks. I will review them all tonight. Don’t forget to follow me on Twitter.

Comments »

7 COMMON BREAKOUT PATTERNS (Educational)

BTFO!

If you’ve been following me for the past 6 weeks, you know that I have called breakouts almost immediately before they do so. I was asked by dozens and dozens of people to provide some sort of educational post on what I lookout for. The primary patterns that make it on my imminent, potential, and waiting lists are as follows: 1) parabolic breakout+symmetrical triangle, 2) bull flag, 3) ascending triangle, 4) failed descending triangle, 5) rounded bottom, 6) flat base, 7) measured move.

Each pattern must utilize price action, volume, moving averages (15, 20, 50, 100, 200-day), and the development of the pattern itself. The entry point is marked when everything “lines up perfectly”.

1) Parabolic Breakout and Symmetrical Triangle:


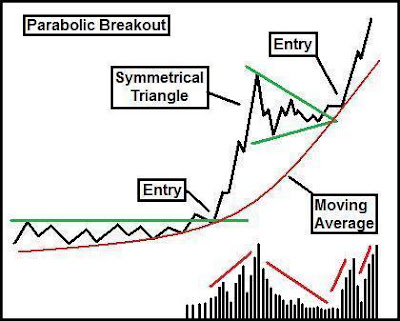
These patterns are the intra-day spikes that I covet dearly. They are responsible for many of the fastest and largest gains that I have ever achieved. This pattern utilizes 2 or more continuation or consolidation patterns to complete itself. They are usually flat bases, flags, and a variety of triangles. When the pattern goes parabolic intra-day, there will usually be massive profit taking and the entire move could retrace as much as 50%. Most weakhands would sell in panic when this occurs. However, this is wrong.

After a large move, the pattern needs to consolidate it’s gains, shake out the weak holders, attract the dip buyers, and gather accumulation and interest for the next run up. Towards the end of the consolidating period, there will be another breakout, which marks a secondary entry to add another position.

Volume must be flat and declining prior to the spike, which will be accompanied by huge volume. In addition, the moving averages listed above will help guide you to time your entry. My favorite short-term averages are the 15- and 20-day MA’s. 50- and 100-day MA’s are intermediate averages, and the 200-day MA is the big daddy himself – the most important long-term MA.

Whenever you see a symmetrical triangle form after the initial spike, it is almost a guarantee that the particular stock will breakout again. Failures are rare, but they do happen.The point is to harvest as many of these patterns and cut losses on any of the failures.

2) Bull Flag:


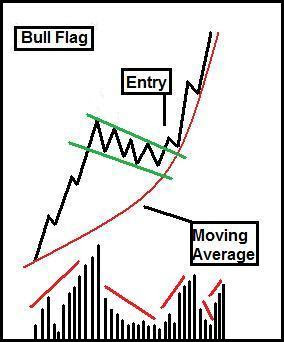
Bull flags are usually very small and can last for only one day or several weeks. The way to tell the entry is by using the appropriate moving averages. Sometimes, I like to enter a flag regardless for fear that I may miss the breakout. However, the closer the pattern is to the 15- or 20-day, the faster the breakout will materialize.

3) Ascending Triangle:


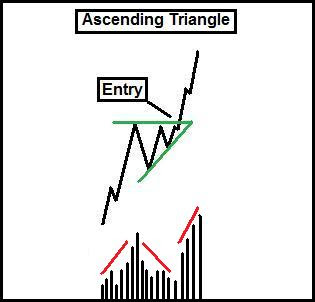
The ascending triangle is one of the most obvious bullish patterns, and one that is highly reliable. Each trough is marked by selling exhaustion while the buyers hold their ground. You want to either get in on the breakout from the pattern or if you are more tolerant to risk, then enter within the pattern and just sit tight. Do not get shaken out.

4) Failed Descending Triangle:


Sometimes, when a pattern fails, it can be a good thing. A pattern failure will force holders on one side of a trade to immediately reconsider. A descending triangle is a bearish pattern but occasionally, it will fail. This will force short covering and a great time to add longs at the same time. I like to get in on the breakout on confirmation.

5) Rounded Bottom:


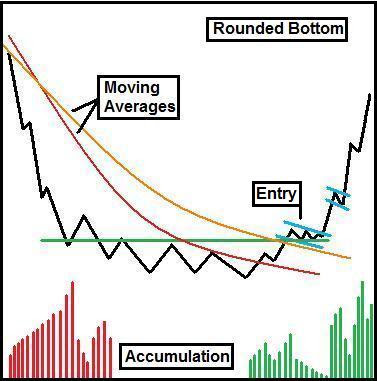
This pattern takes months, even years, to develop. The pattern is created by a downtrend, followed by a sideways neutral range. When the right side of this “saucer” develops, it will be obvious that the stock/market wants to go up. There should be a massive increase in volume on the breakouts following the final completing of the right side of the pattern. Shorts will cover their positions as they realize that they can no longer profit from the stock.

When the multi-month base is forming, the main moving averages should catch up to the stock. They should level off and start heading higher and support the stock as a “launching pad” for continuous breakouts.

6) Flat Base:


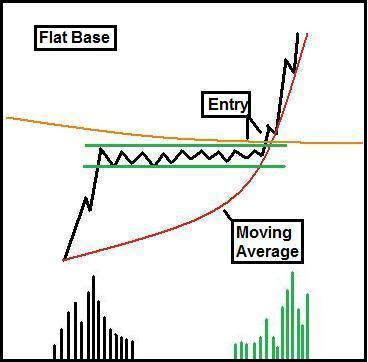
A flat base is basically an over extended flag trading in a neutral range on low volume. These patterns have one of the most powerful breakouts, ever. A stock can easily double in a matter of days/weeks. There should be no evidence of breakdown in this pattern and they should be entered immediately when you first find them. When the breakout occurs, it its highly likely that you never see pre-breakout prices for a long time.

7) Measured Move:


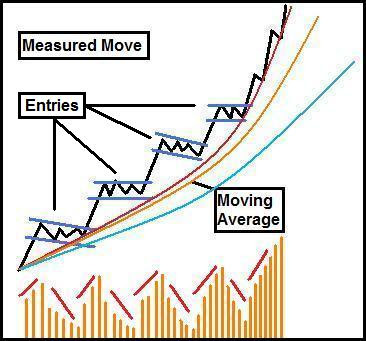
The measured move pattern is one of the most beautiful and predictable patterns. They easily launch from their supporting moving average. The best part is that several moving averages should provide support below the stock. They act as back up in case there is a failure.There should be decreasing volume during consolidation, followed by large volume breakouts.

I hope this helps.

Comments »

Majority Cash / Possible Bump-and-Run

I feel very comfortable being in approx. 65% cash with a 30% long and 5% short exposure. I am prepared to deal with both an up and down market. I made no purchases yesterday and also removed five of my positions in the morning (FEED, COIN, CPE, NXG, WRES) primarily to build a large cash position. Not bad on the timing part. In the end, I was only down -0.27%, or basically flat, on a day when the SPX dropped -1.32%. This is the result of my morning sales, the FAZ hedge, and gains in TVL and BZ. My worst position was FLOW, down an ohh soo scary -5.9%.


Recently, I’ve heard grumblings from people who won along side me with 20-40% returns. They want more and are no longer satisfied with 5-10% gains. Well, unfortunately, you can’t play $1 stocks forever. It’s one of those strategies that work in certain situations (like the past 2 months). Many of the names I played will go back to $1 or out of business. Don’t get greedy up here, raise cash and/or add a hedge and lock in profits whenever you get the chance.

As for the general market, I am very cautious. One of my short conditions may have been met today via the exhaustion bearish gap up and it was accompanied by massive volume (look at 7-month SPX chart). This kind of volume has been associated with bottoms, but it can also mark tops. Pullback volume should be much lower. In the past, however, tops were marked by decreasing volume which means that this could mark an initial phase of a blow-off top. I wouldn’t surprised since we are up 34% from the March bottom.

A bearish scenario would be a “bump-and-run” reversal shown in my amateur diagram below. This occurs when a stock/the market (I’ll use market) releases itself from it’s primary support and simply runs up too far, too fast. It consists of 3 phases: the lead-in, bump, and run. The lead-in is the ‘normal’ trend support that the market has been following. The bump is when the market makes a sharp advance, leaving a ‘pocket of air’ between it and the support. The run is when the market rolls over to revert back to the mean. Before it rolls over, the consolidation looks like a normal pullback. Something to keep in mind.

The COMP has broken down from the 200-day on it’s highest volume since November. Not good at all. I expect a lot of whipsaw around this area. Fair warning.

Long holdings are now as follows: AHD, BZ, CNO, CNXT, EMKR, FLOW, HGSI, TVL. Few of them will be sold in the morning, but I wouldn’t know which ones until I see how they act.

Would you sell your soul to the devil if he promised you a 300% return in 2009?

Yes
No
Is there a refund policy?
Current Results

Comments »

Dollar Stock Circus Continues

Alright, ya’ll got me. I did sell my soul to the Devil. That’s why I am up +28% month-to-date as of today’s close, not to mention +55% in April and 142% year-to-date 2009. You think I use technicals for my trading decisions? Wrong. That’s just an innocent ruse to hide my sinister involvement with secret societies infiltrating the stock market. lol.

For all the mentally stable people that made money off of my calls, congratulations. These “dollar menu” stocks are cash freakin’ cows. I think I’ve proven that point week after week. Finding the setup is the first step, which is easy to do. However, the timing must be flawless, or you will miss the initial spike. Let’s look at three calls I made just today alone:

HGSI was an imminent breakout call that was executed at 12:52PM at $2.025:

FLOW was also an imminent breakout call that was executed at 2:08PM at $1.889:

TVL was the final imminent breakout call for the day, executed at 2:55PM at $1.73:

My trading philosophy is all about getting the biggest bang for your buck for the least amount of risk in the shortest period of time. Are there more $1-3 plays? Absolutely. I have an entire pipeline full of these monsters ready to “BTFO”. However, I am trying not to add any more longs at this point (but I’m sure I will though). I want to ride my existing positions to their fullest extent and then dump them to all the latecomers. That’s how this game is played. Either you’re early, or you’re late. If you miss a breakout, don’t chase it. There are plenty of setups out there, so catch the next one.

As for the general market, we really need a pullback now. I did not expect this up move, though I did say 2 days ago that the bears would get screwed. What we are seeing right now is the gradual meat-grinding capitulation of the most stubborn short sellers. Like said many times before, I have only 2 criteria to commit to the short side: 1) exhaustion gap via black-filled bearish gap up, or 2) a major breakdown of -3% or more. If neither of these scenarios take place, then get the fuck out of my way.

I am currently 79% long, 3% short (FAZ), and in 18% cash. My personal holdings are as follows: AHD, BZ, CNO, CNXT, COIN, CPE, EMKR, FEED, FLOW, HGSI, NXG, TVL, WRES. They will be sold off one-by-one when they are ripe for the picking.

On a final note, I received 62 e-mails from random people asking me all sorts of questions. You can stop flooding my inbox by leaving your comments below. The simple answer to all of your questions is “look at the chart”. Stop free-riding on me if you can’t take 1-2 mins to figure out the entry & exit targets. If you don’t know what you are doing when you buy a stock, then you already made a huge mistake.

Off to sacrifice another goat.

Comments »

890/892 – 908 Range Bound

It appears that many people are aware of my gains. In fact, I got accused of selling my soul to the devil AND conspiring with the Illuminati. That’s ridiculous and absurd. All I do is sacrifice a goat every night. What’s the big deal about that?

The range between 908 down to 890-892 must hold. We need the consolidation. It’s that simple, yet people like to complicate or over analyze things, and then later accuse me of sorcery.

I have a list of dollar menu stocks full of McDoubles and triple cheeseburgers. If they meet my criteria, they will be executed intra-day and posted in the comments section. The only way I will endorse a stock is if I’m personally in it myself.

Comments »

Expecting Pullback on this Dollar Stock Circus

First of all, I racked in a solid 12% MTD May gain so far. You should be around there, unless you went short. Don’t forget this quote from Keynes: “The market can stay irrational longer than you can stay solvent. My only two critera to short is either on a huge exhaustion gap up via a black filled bearish gap up -or- a major breakdown greater than -3%, intraday or pre-market. Both must be executed on massive volume. Keep that in mind.

Second, I totally expect a pullback, most likely a doji day. This is necessary after a major move. I want to push these $1-3 stocks to the limit, therefore I will not be selling (as of now). If you don’t like pullbacks, then you better mentally prepare for one. I recommend that you go out and watch Wolverine sometime during the day. I heard it’s a great movie. The important thing is to not get freaked out and ask me all sorts of questions that will waste my time. Stick to your plan and let the charts make the decisions for you.

Congratulations to everyone that scored huge today. And also congrats to my special group of peons who followed me into PQ, XTXI, and XTEX for the day. If you noticed, these stocks (along with CPE and WRES – swing trades) do not move in tandem. They move in a particular sequence. PQ moves first, then XTXI, then XTEX, then CPE and WRES. Likewise, PQ was the first to pullback, and those stocks listed above pulled back exactly in the same order. This anomaly started on Friday and I caught it during the last half hour that day. Don’t believe me? Ask RC. He was trading with me live Friday and today. These inefficiencies are rare, but the profits are totally sick and very easy to obtain, as you can see.

Don’t forget – expect a pullback. If any of my stocks actually gap up and spike, I will sell them. This dollar stock circus cannot last forever.

Comments »