iBankCoin
Home / Technical Education (page 2)

Technical Education

The Three Types of Channel Breakout Entries

The three types of entries are a prerequisite of the third part of the Art of Tape Reading Series. There are three types of entries: Aggressive, Regular, and Conservative. For the sake of saving time, I’ll just use a positive market in my examples.

aggressive

The Aggressive method is most favorable when the general market is up, increasing the odds of a successful setup. This is when you enter before the confirmation of a breakout. A good recent example was my LXK play, where I got in about 30 seconds before the breakout. This is aggressive because if you are wrong, then you will book a loss. I don’t think I’ve ever broken even on an aggressive entry trade when I was wrong. However, if you are right, then this method maximizes your gains more than the other entries. you get in when there is enough liquidity/activity in the price movements and there is a volume spike towards the high of the channel indicating that it may possibly have a chance to break out. Your stop, mental or hard, would be at the bottom of the channel.

regular

The Regular method is favorable during positive to neutral market conditions. It is when you aren’t as nearly sure, but there is still a high chance of a breakout. Ideally, you want to get in when a consolidation pattern forms at the top of the channel on the same price/volume characteristics listed for the Aggressive method -or- immediately on the actual breakout itself. This entry’s weakness is on fakeouts where you will most likely book a loss and sometimes, breakeven. Your stop would be on the breakdown of the stock from the upper channel to the lower channel. Most of the times, I use this entry because I am able to get in either immediately before confirmation or on the confirming breakout.

conservative

The final entry is the Conservative method. This is when you get in after the breakout on the first pullback, usually at the upper channel resistance, which turns into support. The problem with this setup is that sometimes the stock does not pullback for a lengthy time. I use this setup if I am late and actually find it. This entry contains the most confirmation of the other entry methods. If support is tested, then the stock retains it’s strength allowing you a “second chance” entry into the stock. This setup is safer because you are not guessing as to whether a stock will breakout or not.

Since everyone’s risk tolerance is different, you may want to key in on which entry suits you the best. Experienced traders can perform on all three methods, however, I advise beginners to master one type of entry that best suits your personality before you try to do all three at once.

Have a great trading week.

——-

For expert tape reading, I highly encourage you to refer to Vadym Graifer of RealityTrader.com. I spoke with him personally and he’s an intelligent and great guy.

Here is his bio:

Vadym is the author of Techniques of Tape Reading (McGraw Hill 2003), How to Scalp Any Market (2005) and Master Profit Plan (2005). Vadym is a frequent featured speaker at International Trader’s Expos and Financial Forum Conferences.

He is the founder of RealityTrader.com, a hands-on training company, working with a global community of individuals to achieve high levels of trading success.

Vad is a professional trader and an international private trading mentor responsible for turning around the trading careers of thousands of trader. He has also published articles and interviews in industry magazines, corporate product newsletters and trading forums.

For more background information on Vad, please see excerpts from Vad’s book (Chapter 1, Chapter 2)

Comments »

Technical Analysis for Dummies

tadummies

There’s a car in front of you and you are trying to determine where it’s going, just like how we look at price and volume to predict future movement.

If you look at the diagram above, you’ll see an intersection. Now, only when the car reaches the intersection do we have the chance of figuring out the most likely direction the car will go (similar to when we first look at the chart of a stock).

When the car reaches the intersection, it can do several things:

1) Stop at the stop sign and wait.
2) Stop and go straight.
3) Stop and turn right.
4) Stop and turn left.
5) Not stop and speed straight through the intersection.
6) Not stop and turn right.
7) Not stop and turn left.
8 ) Make an illegal U-turn.
9) Stop and back up into you.

etc…you get my drift.

There are so many possibilities in this illustration. What if the car turns on a left- or right-turn signal, is there a guarantee that the car will turn in that direction? No, of course not. In fact, yesterday, I saw a driver turn on her left-hand signal in the left lane and then turned right, nearly causing an accident which reminded me of this illustration. The stock could go up or down, but is there a continuation?

We all probably busted illegal U-turns at intersections at one time or another. Is it easily predictable? No. I’ve also seen people accidentally shift in reverse at a red light, hitting the person behind them. Sometimes sudden reversals occur in stocks and if you aren’t careful, you could hit or get hit.

Sometimes a car will ignore all the traffic signals and go straight through an intersection, whether intentionally or unintentionally. Sometimes, stocks can make extreme movements, up and down, and we could miss them or get caught on the wrong side. These are usually deadly.

Now let’s say that you are in front of a driver that turns on his/her left-turn signal. You are reasonable sure that the next action will result in a left turn. It is the highest probable action the driver in front of you will take. Even still, it is not 100% guaranteed. When you see the car actually make the left turn, your odds significantly increase.You can predict that the driver will make the left turn before the left turn is fully complete.

These are signals that technical analysis produce on stock charts. These are your basic high-probability setups. Technical analysis itself is not enough, though. Ultimately, you are responsible for properly observing the signals you receive and to act in the best way possible according to the highest probable odds.

—-

Other stuff:

1) The tape reading series will resume this week.
2) The inside day yesterday was executed according to plan.
3) All four indices will be re-testing the 100-day MA. Beware as the 100-day is a strong and reliable MA.

Good night.

Comments »

The Art of Reading the Tape: Part Two

We left off of part one of the series by discussing the ‘edge’. The edge is basically what works for you consistently and profitably. It is your system, and it’s different for everyone. You don’t necessarily need an indicator to see the trend because a chart is usually enough. A system doesn’t have to be cumbersome, incomprehensible, or basically, complicated and otherwise a failure. There is a certain simplicity you arrive at after a series of complications.

This particular style of tape reading involves more with the reading of certain visual formations vs. analyzing numbers. In addition, these visual patterns work the very best with the intraday time frame. Since we want to utilize trending days for each individual stock, neutral range-bound days should be ignored. The probabilities significantly decrease on non-trending days.

The principles of tape reading basically match up price movement to crowd behavior as a ‘rate of volume’. Through this, traders can see when the ‘footprints’ of a stock are made. These traders will be aware of when the majority moves into a stock that is presently dominated by the minority. Why tape reading is a lost art is beyond me. In fact, most trading systems don’t even incorporate it, despite the fact that it stood the test of time for 400 years, give or take.

Trading wisdom states that the majority is usually wrong. Well, that depends. Tape reading is based on a handful of stock operators taking the money from the majority. We make money from the imbalance of buyers and sellers that is created. This is how trend reversals and explosive moves occur. The question is, “Are you the first one on the scene when the imbalance takes place”?

The important thing is to get there before the real breakout occurs, the path of least resistance. Consider this: not many people get in on the first sign of a major move. As more people become aware of the pending move, they accumulate shares. Then more people get in. Aggressive buying hits the stock and everyone wants to get in on the action. Keep in mind that that every buyer now is a potential seller. Finally, distribution takes place and the losers are left holding the bag. We all see it everyday.

How does the accumulation & distribution work with tape reading? The minority (you) watch how the other minority players are acting and then wait for the majority to create the mass movement. Typically, smart money can be identified by price movement when it is a slow, gradual movement with slow and steady volume. The general public’s price movement can be viewed as euphoric with parabolic spikes in both price and volume to the point of exhaustion and instability.

There are six principles,k and I utilize all of them for my various day trading strategies:

1) Capitulation/parabolic exhaustion (long/short)
2) Beginning of a trend (accumulation-aggressive)
3) Confirmation of a trend (accumulation-aggressive)
4) Continuation of a trend (retracement-shallow)
5) Reversal (decreasing volume)
6) Accumulation and distribution (passive, non-aggressive)

1. Capitulation/parabolic exhaustion (long/short)

There is a pure acceleration in price movement with a massive surge in volume. Price usually advances/declines the most in the shortest period of time here. However, this move is usually unsustainable and can produce devastating sell offs or sharp bounces. This applies to both up and down price spikes. These moves usually last for only a few minutes, or even seconds, and they are the hardest to master. The key is identifying the price and volume and the accompanying imbalance in the accumulation/distribution through observing price and volume.

Usually, you see what I call “volume mountains”. Yes, I call them that because they look like mountains. How do you know when to get out entirely or scale out and piecemeal your exit? We’ll get in more detail on these ‘mountains’ in the future perhaps, but we’ve all see them.

volmtn

2. Beginning of a trend (accumulation-aggressive)

This is a completely different idea than the one above. It is the steady, upward movement of a stock with consistent volume that usually precedes more serious momentum. There is consistent buying going on, with ‘consistent’ being the key word. There is not enough to attract everyone else, thus giving the stock an appearance of ‘floating’. The key here is to scale in on each intraday breakout until you see signs of distribution. More on this on the future.

3. Confirmation of a trend (accumulation-aggressive)

This is a slow advance in the price movement with increasing volume, which makes it another momentum signal to pay attention to. The trend is beginning to draw the attention of the majority but is not yet ready to experience a full-scale momentum move. This precedes a powerful price move. What follows is the euphoric, sometimes idiotic, action of the majority. We’ll discuss how to catch these in a future article with examples.

4. Continuation of a trend (retracement-shallow)

This is marked by a huge price increase, but with low volume. This is a classic pullback or short consolidation. You already know what these are and I don’t have to explain them.

5. Reversal (decreasing volume)

Buying has slowed down and distribution is imminent = GTFO. The buying is drying up and this is your last chance to get out before you turn into a bagholder. Volume is especially important here. I will cover examples and models of how volume acts here in the future. Bottomline, volume indications help us determine our actions since price action is not as relevant or important as volume here.

6. Accumulation and distribution (passive, non-aggressive)

Large volume of buying with no price change typically tells me that there could be a shadow resistance level with a quite a bit of overhead supply. Most of the time though, the resistance is defined by identifiable resistance lines and even better, moving averages. I sure love those moving averages. This principle identifies ‘stand offs’ on both sides and I would be extremely cautious here. Of course, more on this and the others later on in the series.

——-

For expert tape reading, I highly encourage you to refer to Vadym Graifer of RealityTrader.com. I spoke with him personally and he’s an intelligent and great guy.

Here is his bio:

Vadym is the author of Techniques of Tape Reading (McGraw Hill 2003), How to Scalp Any Market (2005) and Master Profit Plan (2005). Vadym is a frequent featured speaker at International Trader’s Expos and Financial Forum Conferences.

He is the founder of RealityTrader.com, a hands-on training company, working with a global community of individuals to achieve high levels of trading success.

Vad is a professional trader and an international private trading mentor responsible for turning around the trading careers of thousands of trader. He has also published articles and interviews in industry magazines, corporate product newsletters and trading forums.

For more background information on Vad, please see excerpts from Vad’s book (Chapter 1, Chapter 2)

Comments »

The Art of Reading the Tape: Part One

tt

Trading is not about knowing. Trading is about acting on situations, patterns, and signals that you are familiar with. This all comes from experience, proper training, and something that you and I call intuition. Intuition is required for reading the tape.

Reading the tape is basically studying pure and magnified price action. Long ago, traders used to study the ticker tape to assess price action, the volume, momentum, and other signals long before the internet was born. You must have this skill to refine and perfect your entries and exits. Since most people already know a lot about technical analysis, I wanted to cover the next evolution in your development.

Most of you know that I keep things simple and focus exclusively on price action, volume, moving averages, trends, and other simple signals. If you master price action, then you will be able to tell whether a stock is strong or weak prior to breakouts, one of my most favorite and practiced strategies. You’ll be ahead of the pack of technical traders that don’t know how to read the tape. Instead of going into Level 2 or the bid/ask, I will integrate the tape with charts as I am most proficient in this area.

Learning to trade requires two things. The first was mention in the second sentence of this article. The other is creating the perfect mindset that can handle unusual and uncertain liquid trading environments. This isn’t something that can be taught from a textbook or in a school. It must be practiced over and over again. A teacher must demonstrate what has to be done and I will be that teacher. In addition, I expect you as the student to work on the personal experience that’s necessary. Luckily, that’s developed over time.

I chose “art” for tape reading because that’s what it is. It’s not a science. The physicist Yakov Zeldovich once said, “Science has one answer where art has many.” Tape reading requires an open mind. It is also interpreted differently among traders, therefore I consider it an art. You are the artist and the trade is your artwork. A big side of trading where art plays a big role is when you adapt when the market changes it’s tune. You must adjust or face indefinite loss.

The biggest benefit of tape reading for me is how it defines my entries and exits. Most of you have been following me for months, perhaps even a year and a half when I first started blogging. You already know what I do, and you know my trades already. My job is to read stock price action correctly and then viciously attack each trade. You may have witnessed me attacking the same stock over and over again in a single day. This is possible because of the synergy that technicals, charts, and reading the tape produce.

All of this leads to the “edge”. Do you have it? I can tell you that my personally trained army of traders do and demonstrate it on a daily basis. They are confident in their actions. They are consistent with their results and their emotions. Our plays are easily distinguishable and we have our own style. We know exactly what to do with each setup. There is no hesitation to attack. How do they do it? It’s their edge and reading the tape is a huge component of it. There’s only one way to develop an edge and reading the tape and it’s through experience.

The highest possible level a trader can reach is intuitive trading. As we continue to trade, we reach critical mass that profoundly results in second nature reactions. This is your ultimate goal in developing as a trader.

The next article in this series will explain the tape in detail. We’ll talk about various emotional attributes to the tape such as capitulation or euphoria, as well as accumulation and distribution,trend continuations, select high-probability setups, and many other things in future articles.

———————————————————-

If you haven’t done so already, vote for me in the ShortyAwards in Finance. It only takes a minute and I’ll appreciate it greatly. For those that already voted, thank you so much.

http://shortyawards.com/WeeklyTA

VOTE!

——-

For expert tape reading, I highly encourage you to refer to Vadym Graifer of RealityTrader.com. I spoke with him personally and he’s an intelligent and great guy.

Here is his bio:

Vadym is the author of Techniques of Tape Reading (McGraw Hill 2003), How to Scalp Any Market (2005) and Master Profit Plan (2005). Vadym is a frequent featured speaker at International Trader’s Expos and Financial Forum Conferences.

He is the founder of RealityTrader.com, a hands-on training company, working with a global community of individuals to achieve high levels of trading success.

Vad is a professional trader and an international private trading mentor responsible for turning around the trading careers of thousands of trader. He has also published articles and interviews in industry magazines, corporate product newsletters and trading forums.

For more background information on Vad, please see excerpts from Vad’s book (Chapter 1, Chapter 2)

Comments »

Sequential Breakout Trading in Biotech Stocks

you_wont_find_the_answer_here2

Starting today, I will be extremely busy. I am preparing for my first day of school on August 31st. As you know, I will be starting a new shrink program. I have many, many reasons to do this, but I have no idea why I really chose to go back to UMD. I’ve been having recurring dreams for over a year telling me that I have to go “find something”. Who knows what that is, but my dreams or visions are usually correct. Say what you want, but I’m not crazy. I executed the delegation of my responsibilities in all of my businesses yesterday, except for my personal trading and anything that’s internet-related.

Most of you figured out the way I day trade. You see a lot of break even trades for a reason, and that reason is because I am testing out the market. I have to see what is working early on, and when I do, that’s when I go in “heavy” sometimes doubling or tripling my positions. It’s pretty simple if you think about it: find what works then heavily allocate your capital to the best ideas, thus maximizing your gains and limiting your losses. Winning almost everyday is not some kind of bizarre mystery or stock market “secret”…which also brings me to another point.

I still don’t get why people complicate trading with complicated and worthless indicators, computer programs, spreadsheets, or anything else that wastes your time. Here’s a tip – if you can’t even trade profitably and consistently off of the basics, then you’re going to run into major problems down the road. No method is 100% perfect, but make sure you perfect the basics first, then move onto other shit.

This post will be two parts: the usual SPX analysis and the biotech/pharma sequential breakout analysis.

First, the SPX charts in the following time frames: 2-day, 5-day, 10-day, 1-month.

spx2d1spx5d5spx10d4spx1m6dshort5

Now, I heavily day traded biotech stocks yesterday. By heavily, I mean that I was executing trades every 1-3 minutes which made it pointless for you to follow. I took the charts for BCRX, NVAX, SVA, INO, HEB, VICL, DVAX, and AGEN and stuck them all together into two images.

Yes, I know that some are not swine flu related, but they moved anyway, didn’t they? I could careless what you think and only care about WHAT is moving. I find out the WHY part later, after my trades are finished.

162

The long black vertical line marks the breakouts for BCRX and NVAX, which were the first breakouts of the group. Scroll down a little to INO. The remaining charts show sky blue boxes. These mark the delayed movements in the rest of the group where you only had several minutes to take action.

The long red vertical line marks the pullbacks for BCRX and NVAX. Note how SVA pulled back first, HEB kept going higher, and some of the others just didn’t move at all. During pullbacks, you want to heavily allocate towards the strongest in the sector, which was HEB (you can check out my twitter stream and assess how urgent I made it to get into HEB).

The area between the long black vertical line and the long red vertical line shows the breakout volume. Volume should and must be heavy for a stock to gain momentum, which reduces the risk of failure.

The area between the long red vertical line and the long green vertical line shows the importance of pullback volume. For most of the stocks, you should see lower, steady volume, which indicates a healthy consolidation zone. High volume inside this zone flashes a big warning sign of instability.

The period after the long green vertical line is mixed. You can see secondary breakouts in BCRX, NVAX, SVA, and VICL – all marked by heavy volume that should be similar to what you saw in the initial breakout volume area (between the black/red vertical lines).

Finally, chart patterns made sure that you got in at the right moment.

When you see 2 or more stocks in the same or similar industry/sector, then you must immediately scan and chart the entire group’s components. Some of my biggest plays are due to sequential breakouts which give you windows of opportunity to get into stocks prior to high-probability breakouts. Good examples were my end of April/early May oil/gas shitstock plays in XTXI, XTEX, APL, AHD, and a few others. I believe I wrote a post on it, but I’m not going to dig for it.

That’s your lesson for the day.

Comments »

How-To Guide on Technical Short Selling: 7 Common Setups + 24 Real-time Setups

Ultramarines Space Marine Chapter preparing for the First Battle of Armageddon

This article will attempt to explain what I look for, the best setups to short, how to short using MAs and other technical basics dealing with short selling. Short selling is for intermediate and expert traders and I do not encourage beginners to jump into shorting stocks, especially if you are the type that likes to hold onto losing positions. Treat this only as an educational article since I am not providing any legal or financial advice.

There are numerous patterns that one can search, however, I focus on 7 primary setups for shorts (If you read my article on long patterns, there were also 7 patterns). The patterns are as follows:

Patterns

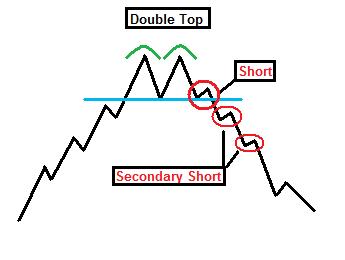
1) Double Top:

The double top formation takes several weeks or months to develop. It’s a reversal pattern that stops an extended uptrend. The 2nd top is unable to make a new high and threatens to breakdown from the neckline, which is the nearest support for both peaks. The idea short entry is either early on the breakdown or on the flag (if develops at the neckline). There are several secondary entry points in case you miss the first.

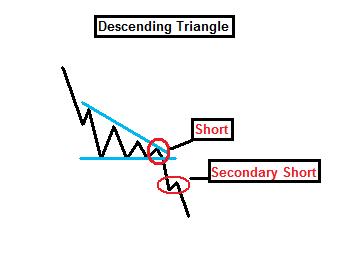
2) Descending Triangle:

The descending triangle is an easy pattern to find. This triangle holds horizontal support, but continues to make lower highs, creating a downtrend. The ideal entry is to enter before the triangle breaks since the breakdown is usually a gap down or a powerful intraday breakdown. I always take the risk to short as the triangle develops.

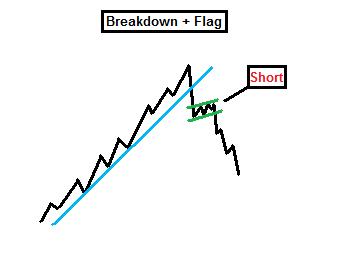
3) Initial Breakdown + Flag Combo:

The initial breakdown + flag combination is 2-part. Part I consists of a major breakdown (usually the largest red candle present in the entire uptrend) on massive above average volume (typically the largest volume present on the chart). Part II consists of a flag that indicates that the stock is in a reactionary rally and the volume must be low. The ideal time to short is not on the initial breakdown, but on the flag.

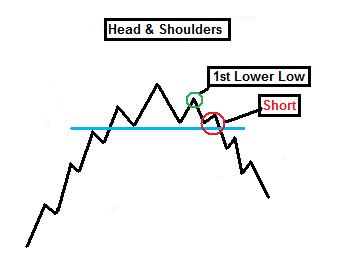
4) Head and Shoulders:

The H&S is a popular pattern. The most important part of the pattern is the right shoulder since a lower high is necessary to confirm that the uptrend is ending. Like the double top, you have the option to short on the breakdown or on any flag that develops on or near the neckline. Typically, there are several short entry points following the initial move lower.

5) Rising Wedges:

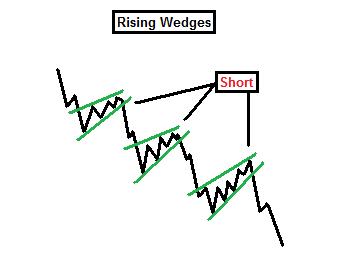
Rising wedges would be difficult patterns to determine if it weren’t for volume. The wedge is a uptrending trading range that will become more and more narrow as it reaches the apex. Volume must get lighter and lighter as the pattern progresses. You may enter the wedge before a breakdown, but I like to short in the breakdown (which should be accompanied by volume expansion) for confirmation.

6) Parabolic Moves Up:

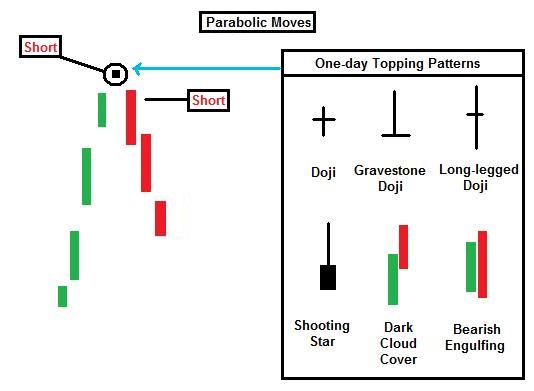
These are stocks that jump 100%, 200% or more in a span of several days. The top of the pattern is marked by buying exhaustion and the best way to determine the exact top is to look out for the following candlestick patterns: doji, gravestone doji, long-legged doji, shooting stars, dark could covers, and bearish engulfings. All patterns are typically accompanied by the highest volume bar on the entire chart. Entering on the topping day may provide more profit, but it is riskier. The next day is considered the confirmation day in which the stock breaks down. The 2nd option for entry (less risk) is to enter at the very beginning of the breakdown.

7) Bear Flags/Pennants:

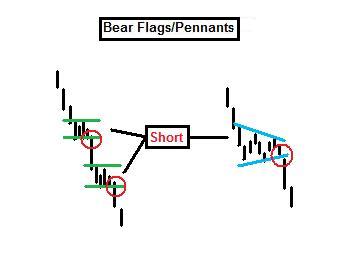
Bear flags/pennants are the most common short patterns. They mark continuations in a downtrend and are highly reliable (similar to bull flags). The idea time is to obviously get in before the breakdown, and you may only have 1-2 days to do so. The volume must be light on the flag, and the volume should increase singificantly on the breakdown. Think of this pattern as an inverted flagpole /w flag.

Moving Averages

In addition to the patterns themselves, moving averages play an important role. I use the 20-, 50-, 100-, and 200-day MA’s for long and short setups, but I also incorporate the 10- and 15-day MAs because a stock declines much faster, thus you will need a much shorter-term MA. Find the right MA that guides the stock because not all stocks follow the same MA.


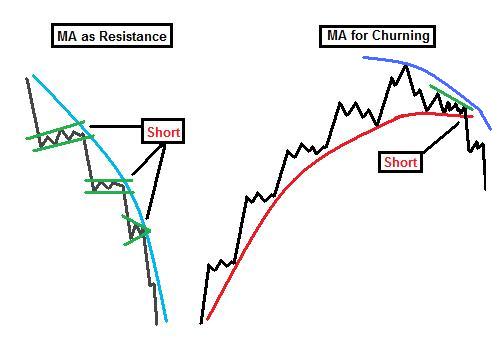
I categorize moving averages in two ways: MA’s acting as resistance and MA’s for churning. Moving averages act as magnets and they are just as reliable as the setups they guide. When we went long, we used the various MA’s as support which acted as springboards to propel the stock higher. Think opposite of that now. MA’s for churning simple means that a stock flags either immediately above, on, or under a stock. Usually, the stock cannot make a higher higher and/or a 2nd MA is looking to catch up to the stock.

Books

Recommended books on short-selling:

1) How to Make Money Selling Stocks Short by William O’Neil (Wiley, 2005) – [Technical, Swing & Position Trading] 2) Sell & Sell Short by Dr. Alexander Elder (Wiley, 2008) – [Technical, Day Trading] 3) The Art of Short Selling by Kathryn Staley (Wiley, 1997) – [Fundamental] 4) Sold Short by Manuel Asensio (Wiley, 2001) – [Fundamental] 5) Sell Short: A Simpler, Safer Way to Profit When Stocks Go Down by Michael Shulman (Wiley 2009) – [Macro]

The best way to become an effective short seller is by making it a habit of studying hundreds and even thousands of charts every week. Train your eye to see the setups, the accompanying volume, how the MA’s line up, etc. The only way to do this is with practice. Short-selling can become very profitable due to the simple fact that stocks drop faster than they rise (in most cases) and for me, it typically only takes about 1-3 days to make a decent profit of 10% or more.

Trade only the best setups to increase your odds. I do recommend the use of stop losses above key resistance areas due to the fact that losing short positions can cause serious damage if left unattended.

Short Setups

Here are some POTENTIAL short setup that I found over the weekend:


Comments »