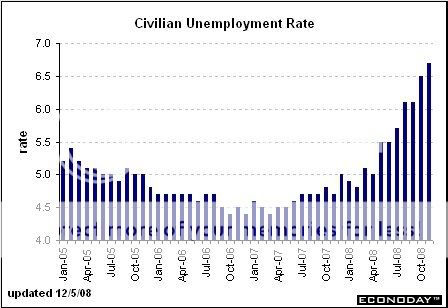
We have the big one tomorrow, and it won’t be pretty. Last month’s reading was -533K lost, but this time it’s -500K with a range of -750K to -300K. Whoever thinks we lost only 300K jobs is living in a cave. In addition, unemployment (currently at 6.7%) is expected to be at 7% with a range of 6.8% to 7.1%. In each of these cases, the Street expects both numbers to come in at the higher end. I know I do.
Let me remind you folks that real & total unemployment is at 12.5%, the highest since 1994 (BLS doesn’t allow me to compile data beyond that). Don’t let the 6.7% fool you.
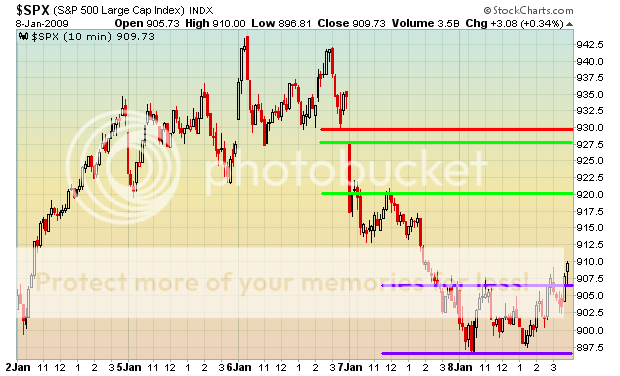
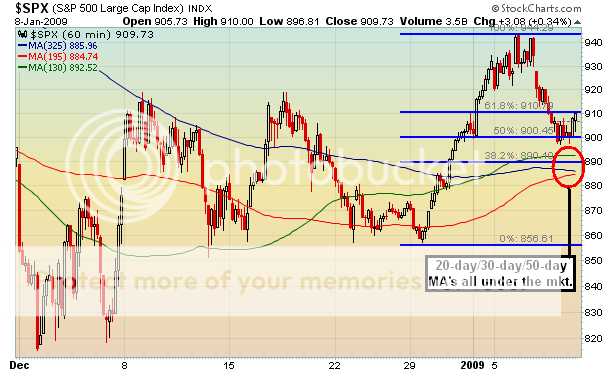
We formed some possible reversal signals in the broad market today. The DJIA and SPX both formed hammers while the COMP formed a bullish piercing pattern. Both the DJIA and SPX bounced off their 50-day MA and the COMP bounced off it’s 20-day MA. In addition, these bounces keep the uptrends in tact. Keep in mind that they all have the 20, 30 & 50-day MA’s right below their 50% retracement level. Be aware of all the support, resistance, and trend lines before you freak out tomorrow.
SPX 5-day
SPX 10-day
SPX 40-day
SPX 4-month
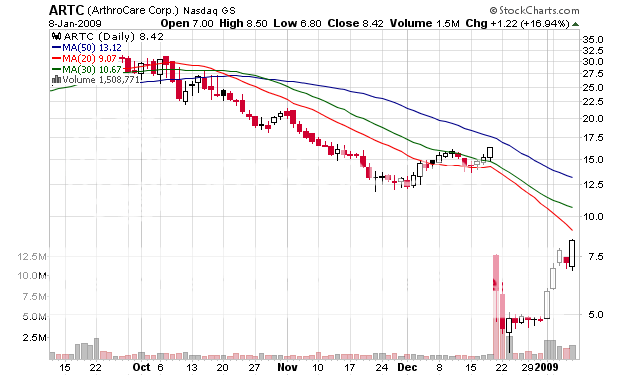
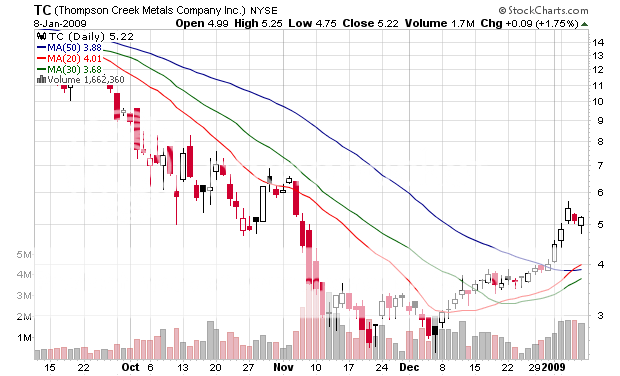
Stable Spikers (multi-day):
If you enjoy the content at iBankCoin, please follow us on Twitter










CA thanks for all that you do to help.
It’d be a great fake to make 900 look strong and then sell into (some) strength and go for a swing under the bar. Good for the market to act rude daddy on ‘the’ politician. Then again there’s been plenty of scratch laid about, people really just get so chummy when the good times are on. “Free shit and you keep us going no matter what??” “Happy days are here again!”
..And they sing “LA LA LA LA, LA LA LA LA..”
This is without a doubt the most informative site I have found. You are my must read everday..thank you
Hey CA,
This will probably be a newbie question.. But here goes. Is there a website/service that will run every stock in existence and return results if the stocks full stochastics drop to below 20?
Let me know if that makes any sense. I am new to system trading, so I don’t even know where to start.
Tho we walk thru the valley of the shadow of death, we shall fear no evil, for Adolph Hitler and the Teenage Mutant Ninja Turtles are beside us…
Great stuff, thanks.
mst – thanks
maelstrom – thanks
aumana – lol. word.
Bob – yea actually, if you use stockcharts.com stock scan (http://stockcharts.com/def/servlet/SC), it has quite a few technical indicators (not the stochastics).
I don’t remember exactly, but I’m sure I have a link to a site with one. If you go to my “3rd-tier blog”, I have like 200-300 links. I guess look around. (http://weeklyta.blogspot.com/)
Bob (and CA):
There are heaps of websites which can scan for technicals. and your broker should have tools for you to do this easily. I know TDAmeritrade has at least 3-4 seperate tools which can do this.
Here are two:
Finviz.com : http://finviz.com/screener.ashx?v=111&f=ta_rsi_os20&ft=3&ta=1&p=d&r=1
stockfetcher.com : http://www.stockfetcher.com/stockdb/fetcher
Use this filter as an example for stockfetcher.
“Show stocks where RSI(14) crossed above 40.00 within the last 3 day
and Average Volume(90) is above 50000
and close is between 5 and 250”
BTW: You probably want an indicator where the stochastics cross ABOVE The 20 line, as the stochastics can drop below the line and stay there for a long time.
You will probably find finviz easier at first and then you can move to stockfetcher and get more sophisticated. stockfetcher is not free.
Thanks a ton guys. Technical analysis is very new to me. I’ve been a fundamental guy for a long time. Trying to learn what these black boxes are doing with 75% of the trade volume.
Several things—–
Bob: “Trying to learn what these black boxes are doing with 75% of the trade volume.”
That is a great idea. Imo, most people would be remiss to not have a handle on that. That said, most of what is taught about TA is false (imo) so I would spend some time training.
watch the tape, write down the patterns you see, and your expectation. Go back and see how right you were.
when you are actually able in real time to identify a pattern you’re golden.
There is no magic indicator.
RSI, Stocs, MACD, etc, etc, etc, etc, they all measure very similar things. If you don’t understand mathematically how indicators are constructed, don’t use em.
Software: There is a SHITLOAD of software that will allow you to program stocks with a stoc < 20.
tradestation
ninjatrader
wealthlab pro
stockfetcher
worden (I use)
stockfiner (I use)
lots lots lots of choics.
most require some grasp of programming, or a huge grasp, for better or worse.
SB is right.
Also Bob, start off with the basics. Read a lot of books!
read and do.
If you recall middle/highschool/college math…..
I always got the material easily, but to get a good grade on the test, I HAD to do the hw.
The only classes I ever HAD to do the hw (when it wasn’t due) was math.
reading and understanding is very important, but you gotta do as well.
Bob, start off by reading and recognizing patterns, test out indicators, look at a boatload of charts, and when you are ready, start off in small lots, and move up as you get comfortable trading on technicals.
Read then do.