iBankCoin
Home / Tag Archives: stock

Tag Archives: stock

Why $GALE should be your best friend

I like $GALE.  Besides the potential disruptive biotechnology that can eradicate breast cancer, it is launching the sales of ABSTRAL® (fentanyl) sublingual tablets which are indicated for the management of breakthrough pain in cancer patients 18 years of age and older who are already receiving and who are tolerant to opioid therapy for their underlying persistent cancer pain.

Basically, while we are waiting for the development of their breast cancer treatment to come to fruition, they have the mean to start generating revenues from the specialized painkiller.  This is the kind of painkiller that will provide faster pain relief than the usual opiate drug such as morphine.

I was lucky to sell before the secondary offering and then giving the opportunity to buy them back after the secondary offering.

Sidebar: I’ve learned to take advantage of the opportunity of a dip provided by secondary offering.  If the company has a solid fundamental, secondary offering is an “offering” of an opportunity for investors to either add or buy at a discount.  I had been waiting for a chance to get back on the 3D printer and $SSYS gave me the opportunity with a secondary offering.

Now, I’m waiting for the fundamental to take effect to drive the $GALE back up based on the future revenues of Abstral or the possibility of a take-over.

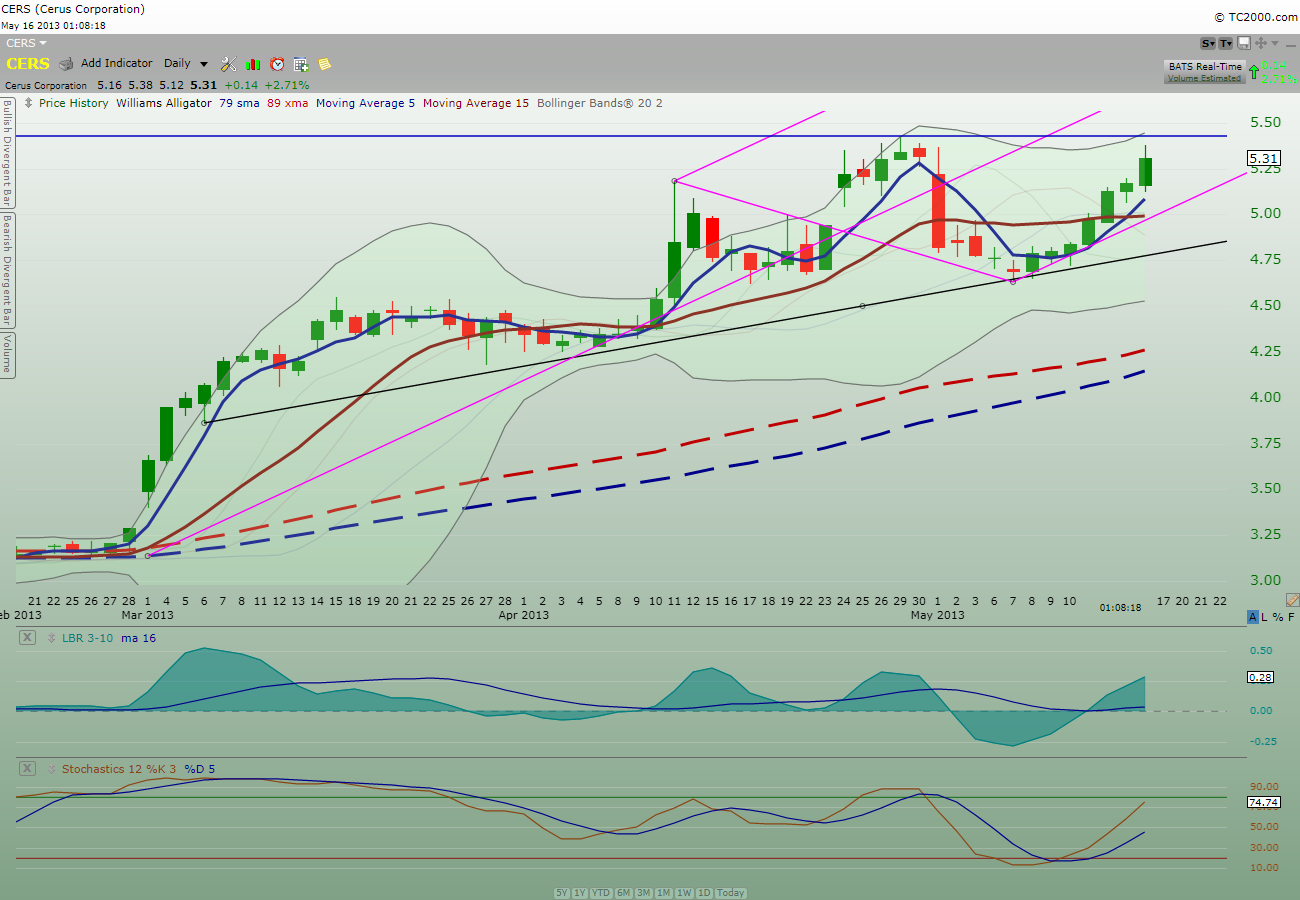
Take a look at the daily chart below:

GALE_daily

There is a breakout to the upside today from the consolidation after the secondary offering.  This signifies that the momentum is still bullish despite a gap-down.  There may be some resistance from here due to the overhang of the 79SAM and 89XMA.  If price can take out these two MAs, then we are heading up.

Take a look at the weekly chart below:

GALE_weekly

Did you see that the uptrend is still intact?  Did you see the price is bouncing off the 79SMA and 89XMA?  This bounce off is more significant than the short-term daily 79SMA and 89XMA resistance I mentioned earlier from the daily chart.

Now, you know why $GALE should be your best friend, eh?

My 2 cents


Comments »

Triple-bottoms play for $NUGT

Take a look at the daily chart below.

NUGT_daily

Can you see the “triple-bottom” with a slight angle to the upside on the trendline?  This triple-bottoms can only be confirmed if price does not penetrate the low of Sept 13th.  For me, this represents a low risk trade.  I bought a starter position today with a GTC hard stop below the Sept 13th low.  Let’s see if I can hit the ball over the park “again” this time.

My 2 cents

Comments »

Zen hunts $CERS for clean blood

$CERS is one my “chase” stock from Monday and I’m still riding the rally on this one.  Price action is now near the previous high of  $5.43.  A breakout of this resistance from here without any consolidation will form a left-hand cup & handle breakout pattern.  Yes, you’ve heard it right.  I don’t know if there is such a thing as left-hand cup & handle pattern in the stock chart book; if not, then I’ve just invented one.

Take a look at the chart below:

CERS_daily

Momentum is still strong with momentum indicators still point up and not yet at the over-bought level yet.

Fundamental speaking, $CERS is already selling their blood “cleaning” system outside U.S.  It is currently working with US FDA to gain approval for sales here.  As the sales start to grow outside US with the possibility of gaining US market in a year or two, the potential for $CERS will show in the price action sooner if not later.

Depending on price action in the near future, I’m still debating if I want to keep this one as a position trade.

My 2 cents.

Comments »

$POT is still acting noncommittal

With a strong bounce back in yesterday nice dragonfly candlestick bar, today action was almost an upside down version of yesterday bar.  Now, put the two together and Voila!, you have a doji bar.  A doji is to be considered a neutral bar where neither the bull nor the bear win the day.

Since my position is kind of a neutral, I will let the price action decides for me tomorrow.

POT_daily


However, looking at the chart basing , it sure does look like it wants to go up badly…

My 2 cents.

Comments »

Close, but no cigar

Take a look at the SPY daily chart below.

SPY_Daily

It has broken out of the symmetrical triangle to the upside but it could not maintain the upper price level.  Now, it looks like it will close inside the triangle.

If tomorrow fails to break out again and stay above; we may have a consolidation period inside the triangle.

Currently holding LRAD, AMRN, USU, PACB,  SZYM, GLOG, DCTH, CUR, GLUU and 39% cash.

Trade well!

Comments »

Comeback story- Nokia

So far, Nokia & Microsoft Windows phone 8 have jumped on broad the China train:

1) Nokia Partners with China Mobile to Launch the Lumia 920T, the First TD-SCDMA Windows Phone

2) China Unicom, Microsoft Forge Alliance To Boost Windows Phone Sales In China

3) Nokia Lumia 800c in second spot on China Telecom’s sales chart

Excerpt from China Unicom news:

China is a strong area for Nokia, which is the biggest single-country for sales of Lumia devices. In fact, Nokia recently released the first ever Windows Phone 8 handset in China with the Lumia 920T, however that device went to China Mobile, China Unicom’s fiercest rival.”

Now, take a look at the table below:

Source: China to hit 1B mobile subs next year

Based on the three news items above, Nokia is in a position to grasp some of the one billions subscribers.  Now, you tell me, do we have a catalyst for a runner or not?

Look at the daily and weekly charts below:

Daily NOK chart:

Do you see a prospective runner in the chart?

Now take a look at the weekly chart below:

Do you see the basing of the bottom?  Do you see how much more room this stock can run?

Houston, NOK is ready to take off!

Oh yeah, I’ve bought 3/4 size position and will add to full -size position if NOK takes out the previous 3 days high of $3.90 this coming week.

Good Hunting!

Comments »

Double-Top Turnover

After throwing numerous AAPL put options against the wall over the span of several months with none of them staying put; I believe today is the day that I finally throw a perfect one that will stick like a well-chewed soggy bubblegum coming off from the mouth of Sandy Olsen (from the movie- Grease).

“How can it not stick this time?”

We’ve a BEAUTIFUL double-top day thanks to the courtesy of today’s big red bar day.  Will this be the last bastion of AAPL’s mighty $600,000,000,000+ (count those zeros!) market cap we ever see again?

Will I, the guy you have been snickered at every times I throw the gum and announce my foolhardy play, be finally vindicated?

Honestly, I really don’t care as long as I recover all those tiny losses here and there PLUS a gazillion more so that I can then go out and buy myself an overpriced iPad to hang on my wall to remind me of today.

Click here to view the large font version of this post

Btw, in the event of an unusual “turn around” rally by end of the day which I am definitely NOT expecting to see, you can go back to your snickering and I’ll go back to my corner and wait for the next opportunity to try again.  If not today, there will be another day.  Nothing, and I mean NOTHING, can stay up FOREVER with that many 000,000,000,000!; especially when Steve Jobs is no longer around.

Remember to follow the price action instead of listening to anyone’s rambling that include me!

End-of-day Chart Update Below:

Below is the end-of-day daily AAPL chart:

Below is the end-of-day AAPL 15m chart:

We will see if tomorrow will continue the downtrend.

Comments »

Do we have buoyancy?

So what do we have here?

Based on the daily SPY chart below, it does look like current price action wants to go up.  Despite the fact that SPY is trading near the previous high of May 2008, the overall sentiment is surprisingly buoyant.  Take a look at the 2 circles on the chart.  The one on the left shows how price action has corrected to the downside after the consolidation has been complete inside the circle; meanwhile, looking at the 2nd circle on the right, you get the feeling that this consolidation appears to be an upside down version of the 1st circle.  If that is the case, we may see a minor correction before price action screams higher.

Friday’s short-range bar only means that momentum of price action is slowing down a bit to catch its breath. But if you look at the momentum indicator at the bottom of the chart, you will see that the fast line has already taken out the recent steep downtrend trendline (red) and is on the way to take out the long-term downtrend line (purple).  This turnaround on the fast line signifies that the internal momentum indicator has a bullish stance.

While others are saying that September may be a popular down month; just remember that we are all dealing with statistic and probability.  Perhaps, just perhaps, September in 2012 will surprise all of us by being an odd month where price action continues to move up without looking back.

Of course, the above is just my weekly rambling market opinion.  Regardless of my inability to see the future, I must always be prepared to have some conviction to wager in the market place.  On the other hands, deep conviction in the marketplace can either be very profitable or very dangerous.  I opt to stay in the middle if I can; if not, my trigger-happy finger will move me back to large cash position in a NY minute.

In short, don’t believe what I said; just follow the price action.

I’m currently 72% invested with 28% cash.

Comments »

The BULL-Sh*t Maneuver

I’ve to give it to the Bull; today price action is quite a ride from a bear attack to a bear heart-attack!

Below is the SPY daily chart, take a look at the beautiful green bar in today price action.  It took out the lows of the last 2 trading days and then turned around for the greener pasture.  One thing to be aware of is the divergence in the momentum indicator below.

Although I sold a chunk of my AMRN and all of my GLOG this morning; I bought them all back when I saw the intra-day trend change.  I paid only a bit more for GLOG but paid quite a premium to buy back the AMRN shares I sold this morning.  In the scheme of the bigger picture, it is my opinion that the premium I paid to get back on AMRN will be insignificant IF (a big IF) there is a takeover or merger coming in the near term.   The way the price action behaved today, it seems like everyone is gambling that something will happen soon.

Below is the 15m AMRN chart.  I ended up buying back AMRN in the mid-$14 after I sold a bit below $14 in the morning.  Well, that’s the way I have to roll when I’m following price action.

Below is the daily chart of AMRN.  Now, did someone know something?  The way I see it, the chart always give you a head-up.

Currently, I’m 38% invested with 16.7% in AMRN.

Remember, follow the price action!

Comments »