iBankCoin
Home / Trading Ideas (page 5)

Trading Ideas

Is $DNDN finding its bottom?

I like to bet that it is by buying some today.

Take a look at the weekly chart below.

DNDN_multi

Did you see how the price level find support at $3.81 area for the last five weeks?  I also like the long-tail 15m chart where price has traded back up to $4.00 level.  A daily doji bar for now could also be a positive sign for a neutral ground before heading back up (or down).

A stop below $3.80 for a stop will yield a good low risk trade with high reward if this is the bottom.

My 2 cents.

Comments »

Something is cooking at $PACB

Can you see the daily subtle buying interest in $PACB for the last 3 weeks?  The monthly, weekly, daily, hourly, and 15m charts all reflect an upward trend.  I fathom that something must be cooking inside $PACB that is smelling good; therefore, I’ve bought position in $PACB today even though price has been up quite a bit recently.

See below multi-charts window:

PACB_multi

My 2 cents.

Comments »

Zen seeks $YNDX for info

I bought $YNDX for a bounce to take out previous high of $29.48.  I believe $YNDX is the Russian $BIDU in the making.

Take a look at the weekly chart below:

YNDX_weekly

All it takes is for $YNDX to take out the recent high and it would automatically break out of the resistance that has been around since October 2011.  Did you see the April 26 weekly bar?  The one with the bad ass long green bar?  That was the tell tale sign.  I may sit on this one for long-term.

My 2 cents.

Comments »

Zen sees $TSLA has been recharged

Ok, one has to recognize strength when one sees it in action.  Despite a heavy 200+ down day on the DOW, $TSLA has managed to bounce back from the low and peek its head above water.  Normally, in my book, a stock with a parabolic run “should” correct severely on a big DOW down day.  Nope, not $TSLA.

Take a look at today beautiful “T” shape candlestick bar in the daily chart below:

TSLA_daily

I bought June 21st $90 call option to go long.

My 2 cents.

Comments »

Zen hunts $BIOD for better insulin

Truth be told, I got shaken out of $MNKD from $5+ awhile back and missed the run to $7+.  I would not want to chase $MNKD at this level; but I see an opportunity with $BIOD which market cap is only 3% of $MNKD ($60 mil vs $2 bil).  Ok, $MNKD insulin delivery system is probably more preferably than needle but $BIOD new phase II mealtime insulin is supposed to be better than currently available mealtime insulin, so they say.  Top line result from phase II trial is expected to release around September this year; so I like to see a summer run to a possible $10+.

I build a position today @ low $4.00 to take advantage of today correction.

This is a super low float company so I expect a lot of volatility; so it is not for the faint of heart.

Take a look at the chart below:

BIOD_daily

The only technical support I see here is the 38.2% retracement which today low has bounced off from.

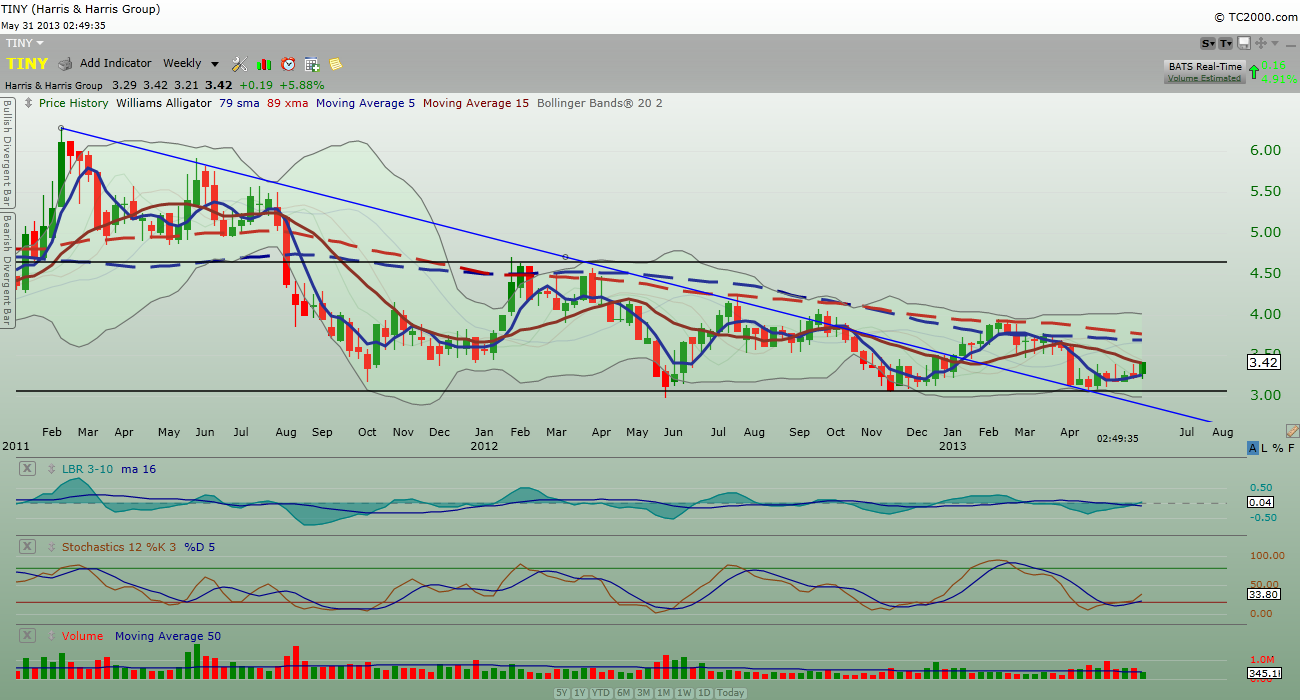
Btw, I can’t help but feel that the money flow has recently been flowing toward anything related to diabetes medicine.  My position on $TINY is getting a good rally probably due to its recent announcement that one of its start-up investment, Metabolon, has launched a diagnostic Test based on Metabolon’s Quantose(TM) Insulin Resistance Markers.

I’m afraid with the amount of sugar our nation is consuming, diabetes health issue is becoming more prominent.

My 2 cents.

Comments »

Zen sees possible “real” bullish harami in $DUST

Apparently, the bullish harami continuation pattern on my $NUGT wasn’t doing too well today.  I gave back all paper gain from yesterday and took a tiny losses for the work.  I also took a small losses on $ABX as well.

Not to be discouraged, $DUST now shows a possible bullish harami “at the bottom” of the trend with supports on the two moving averages lines.  Of course, the bullish harami will have to be confirmed tomorrow with price action taking out today close.

DUST_daily

I bought $DUST this morning looking to see if this bet will pay off tomorrow.

My 2 cents.

Comments »

Zen sees bullish Harami continuation pattern for golden $NUGT

Usually, a bullish Harami happens at the bottom of the trend to signify a bullish reversal.  In this case, a breakout of the Friday inside bar to the upside that takes out the previous high two trading days ago reflects a bullish continuation pattern.  Since it has taken out the inside bar from Friday, I will call the candlestick pattern “the bullish Harami continuation pattern”.   Don’t bother to google it; there is no such thing.  I just make it up.  Whatever works for me, eh? (grin).

Take a look at the daily chart below.  I believe gold minings and gold is heading up.

NUGT_daily

I like to see price action takes out the recent pivot high at $13.54 established in May 9th.

Yes, I bought back $NUGT and $ABX this morning.

My 2 cents.

Comments »

Zen sees $TSLA running out of battery

Well, $TSLA finally takes out the low of Wednesday and drops below $99.00.  Does this correction has more room to go?

Stay tune for next week.

TSLA_daily

Yes, I still have my put option on, so I’m doing fine.  My target is low $80.00.

For those die-hard believer, please save your breath trying to convert me.  Believe me, I do believe electric car has a future; a distance future is how I see it.  But for now, what goes up can come down as well.

My 2 cents.

Comments »

Zen sees $TINY waking up

Is $TINY finally getting some attention?

From the weekly chart below, current weekly bar is making a new high for the last seven weeks.

Notice that the last drop in price bounce off the support and is not longer below the downtrend line.

TINY_weekly

Notice both momentum indicators are bottoming out and is heading back to the upside.

$TINY is the 3rd largest position in my portfolio; so I’m not adding anymore for now.

Btw, this is a low float stock, so volatility is the norm.

My 2 cents.

Comments »

Zen bets $TBF for rising interest rate

I’m referring to the long-term 20 years bond interest rate.

Take a look at the weekly chart.  With today being a Friday, the current weekly bar has the highest volume for the last two plus months so far and the day is not even over yet.

From the weekly chart below, price action is playing around with the resistance level @ $30.7x.  I’ve a good feeling that next week, price action will  break out to the upside and the long-term uptrend will begin.

TBF_weekly

Notice also that the momentum indicators are heading up and the 5ma average is crossing over the 15ma to the upside.

I added to $TBF today and may add more if price action continues to the upside next week.

This stock may not run like a rabbit but I’m quite content to see this tortoise move up in its slow steady pace.

My 2 cents.

Comments »