Remember $CTSH?
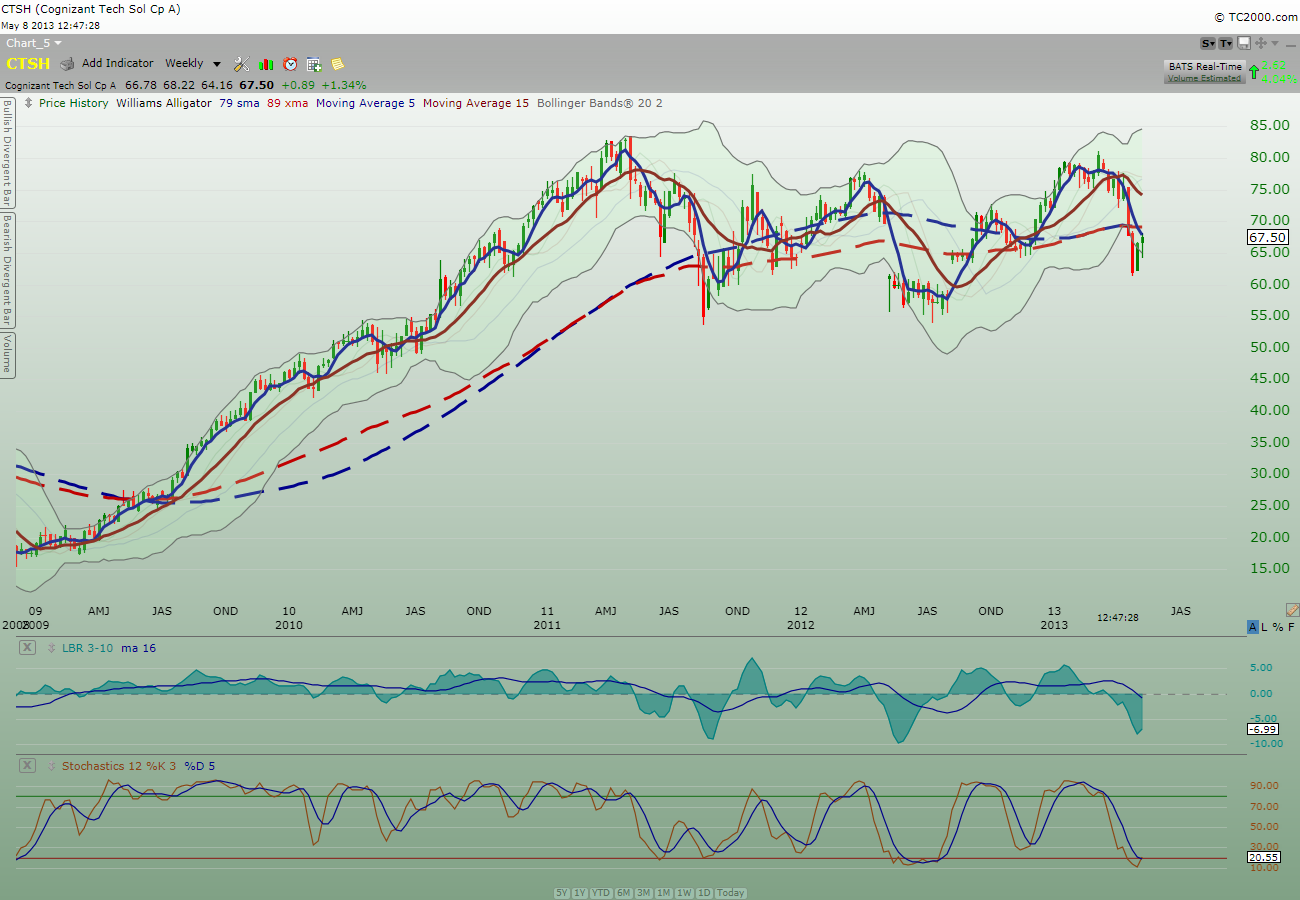
$CTSH had a monster run from a low $14 to $83 from late 2008 to early 2011 before it started having hiccup over the next two years. I believe the current hiccup has come to a conclusion and price may just be heading back up soon.
Take a look at the weekly chart below:
Take a close look at the weekly chart again:
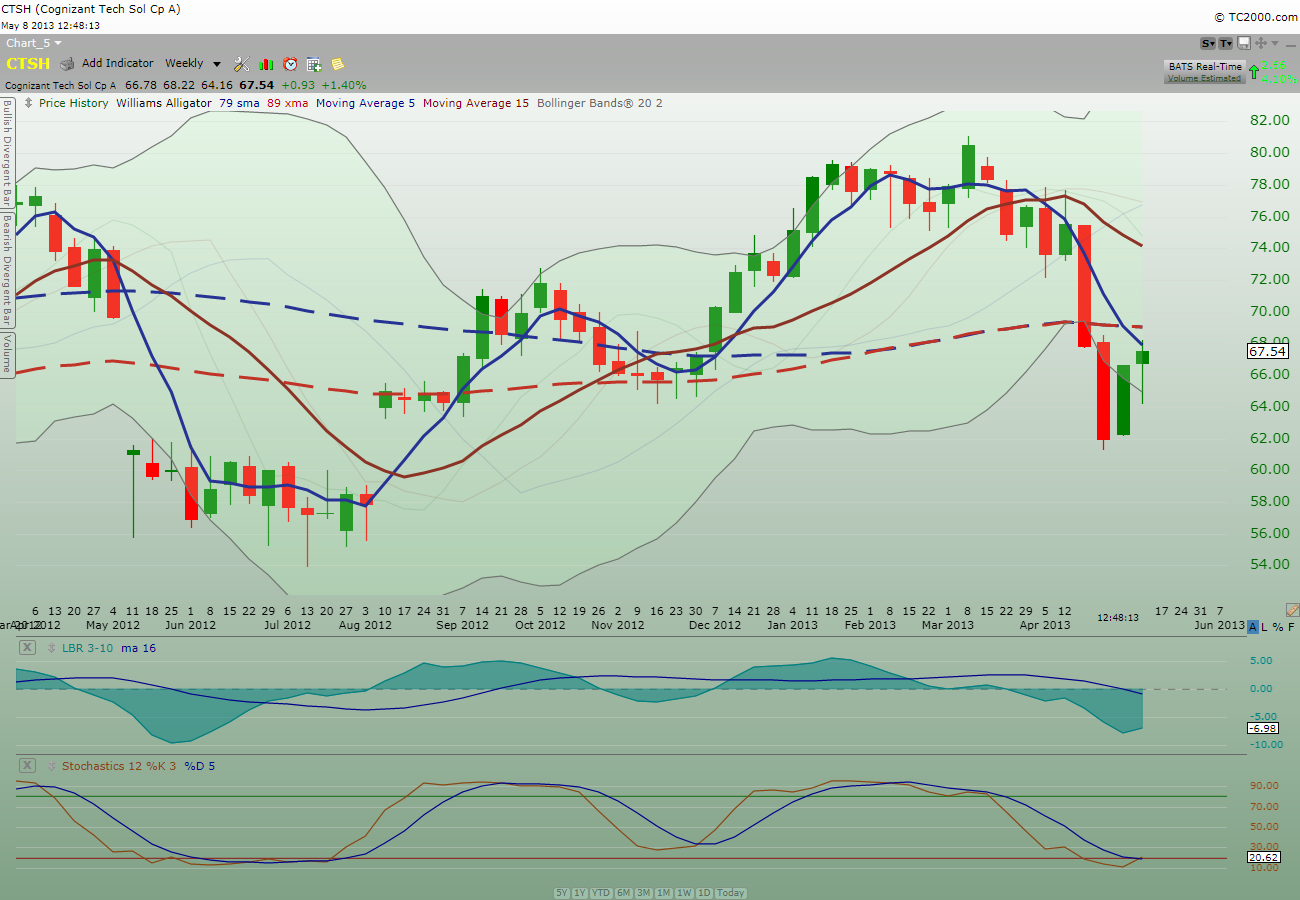
As you can see, this week may confirm the Bullish Harami weekly candlestick pattern for a bullish reversal. Momentum indicators are also coming back up from the low point.
Take a look at the daily chart below:
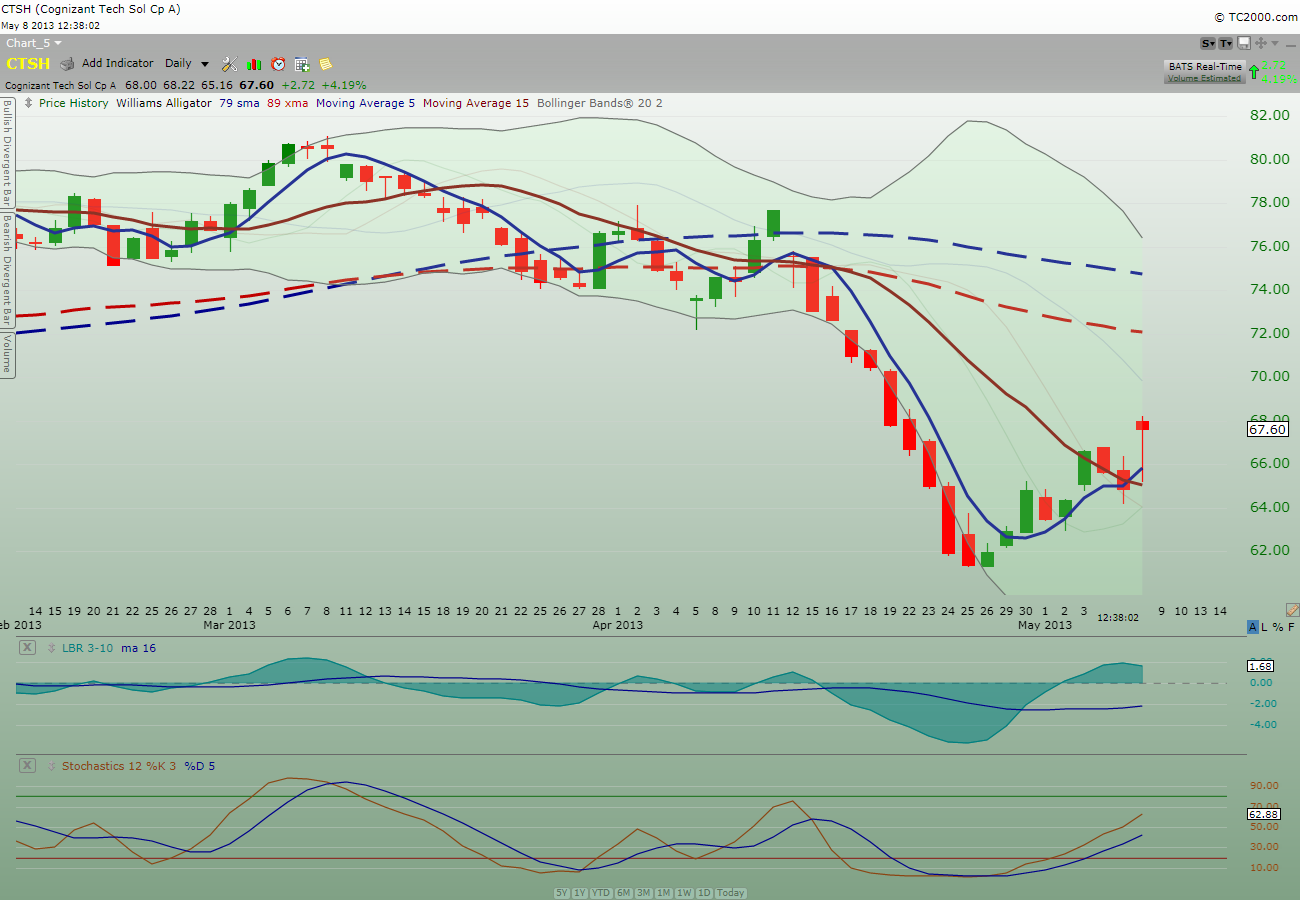
Price took off after positive earnings report and the momentum may continue with the 5 ma line crossed over the 15 ma line today.
My 2 cents.
If you enjoy the content at iBankCoin, please follow us on Twitter
