iBankCoin
Joined Nov 11, 2007
1,458 Blog Posts

September Seasonality: S&P 500

After the worst August in 10 years, I have a hard time believing that September will also be a bad market month. However, history suggests that it will be.

Click on the chart to enlarge.

  • $SPX data is from 1960 to 2010.
  • SPY data is from 1993 to 2010

Calculations start at the open of the first trading day of the month and end on the close of the last trading day. No commissions or slippage were included.

September Statistics (using $SPX)

  • Average Monthly Profit/Loss = -0.62%
  • Winning Months= 43.14%
  • Worst September = 1974 loss of -11.9%
  • Best September = 2010 gain of +8.3%

Profit Distributions: (using $SPX)

Equity Curve: (Using $SPX)

Over the past 50 years, September has been a consistent loser.

With August being so awful, I’m not sure how much I’m willing to bet that September will turn out the way it usually does. While I expect volatility to remain elevated, my gut is that we see some mean-reversion which may mean that not much at all happens this time around.


Comments »

Top Short Setups

With SPY right at resistance and yesterday’s climb on low-volume, I’m looking for another volatile pullback.

These are my top short setups.

TWI

UA

DSW

LULU

TIF

PPO

ULTA

DECK

Have a great trading day!

Comments »

Simple, Long-Term Indicator Near to Giving Short Signal

This simple indicator, which has better than doubled the buy-and-hold performance of SPY with 1/3rd of the drawdown, is near to issuing a short signal.

I developed an indicator some time ago that I use to gauge the long-term health of the market. The indicator has been catching my attention lately because it is near flipping to a short signal. Before I get into the specifics of the indicator, let’s first look at its performance vs. buying and holding SPY.

Using all SPY history, buying the ETF on 1.23.93 and holding it until 8.26.11 (no commissions or slippage included) yields the following results:

  • Compound Annual Growth Rate of 5.47%
  • Maximum Drawdown of -56.45%.
  • Total Profit of 169.11%

This simple indicator (to be revealed below) yields the following results over the same time period:

  • Compound Annual Growth Rate of 11.78%
  • Maximum Drawdown of -20.27%
  • Total Profit of 692.27%

While the performance is impressive for the buy and hold investor, what is more important to me right now is that the indicator is near to issuing a short signal. How has it performed, on the short side?

Remember that a negative %chg means a profit for a short sell.

On the short side, this indicator has a win/loss percentage of 66.67%. If we are entering another extended bear market, there is a substantial likelihood that a short trade will result in double-digit gains. In the past, when the indicator has gone short and the market does not enter into a sustained bear market, it has closed the trade for a small loss.

What Is The Indicator?

It is very simple. Calculate the 5 day rate of change (ROC5) and the 252 day rate of change (ROC252).

  • Buy (or cover short) at the close if yesterday the ROC252 crossed above the ROC5 and today the ROC252 is still above the ROC5.
  • Sell (or open short) at the close if yesterday the ROC5 crossed above the ROC252 and today the ROC5 is still above the ROC252.

How Close Are We to a Short Signal?

The blue line needs to cross beneath the red line.

As I’ve said many times before, simple is often better than complex. With that in mind, I’ll finish this post by showing the equity curve generated from the long and short signals.


Comments »

Hurricane Update from Richmond, Virginia

We have gusts of 35 mph and about 2 inches of rain so far. The hurricane should pass by us around 8 p.m. this evening. We already have over 35,000 residents without power in the Richmond metro area. Our fingers are crossed, but since we live in a wooded area, we will probably lose power at some point.

All laundry has been done, coffee has been brewed and stored in a 2 day carafe, and we’ve all had showers. It is very important to have these things already taken care of when power is lost.

Hopefully my iBC brothers in N.J. and N.Y. are prepared or evacuating.

Good luck to all in the path!

Comments »

How to Play Hurricane Irene

At this point, many of the hurricane plays have already been bought up. However, I am giving you a couple of plays that have not received much attention.

The key point is to be able to gauge the extent of the damage. Much of this speculation should be done before tomorrow’s close. By Monday morning, it may be too late.

If the Hurricane Irene comes ashore at a full category 3, or the track shifts westward so that more populated areas are subjected to the stronger side of the storm, the bought-up plays may have more upside. Conversely, should the storm weaken or the track shift to take it farther off-shore, most of the bought up names will make decent shorts.

Home Depot falls in the decent short category, should the storm weaken or the track shift eastward. Note it is right at resistance.

Lowes appears to have more available upside, should the storm stay strong and on its current projected path.

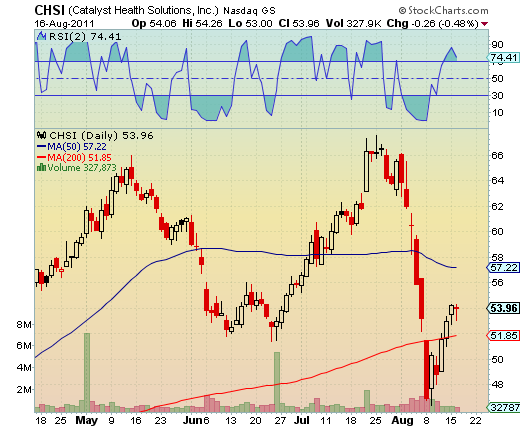
Beacon Roofing Supply has also been bought-up in anticipation of the storm. However, having lived through several hurricanes, including category 4 Hurricane Hugo in my hometown of Charleston, S.C., BECN probably has more upside if the storm is worse than expected.

Reddy Ice is the sleeper play of Hurricane Irene. You can thank me later. If you have ever experienced a significant hurricane, then you know that ice is as good as gold. It is also as hard to find, and people will line up like cattle at the trough when an 18 wheeler brings it in to town. Anyway, this company has a wide distribution range, which includes D.C.

I don’t have much experience trading the insurance companies. I suspect that Allstate may rally if the storm is not as severe as suspected.

On a very serious note, if you are living in the path of the storm and in the danger zone, go ahead and book a hotel room a couple hours west. Trust me, your family will think you are a hero when they have TV, air-conditioning, and restaurant food more so than if they watch you plug holes with tarps and then empty your deep freeze on the gas grill over the next week. Also, if you have a chain saw, don’t forget to get some gas and oil for it as well as a blade sharpener.

Richmond is in the path, but we are prepared. Stay tuned…

Comments »

Some Short Setups

While I’m still bullish until we meet resistance around $120.00, the market has been extremely volatile. I would not be surprised to see some chop or another moderately large down day. Therefore, I think it pays to be prepared.

The following picks are in a downtrend, yet have recently surged and are now sitting just underneath resistance.

Comments »

Looking At a Tradeable Bottom

My third eye is telling me that we are looking at a tradeable bottom. Do I believe it in my heart? Not really.  But If I ignore that nagging doubt and just look at the chart, I see a short-term bottom.

The recent range makes an easy stop-loss area of $112.00. Any close beneath that area and new lows are near certain, in my estimation.

I would have liked to have seen a better probing of the lows, but this recent re-test may have been enough. I was pleased to see that yesterday’s volume was right at average and today’s volume was better than the 50 day average. That is the type of volume action I look for when the market is probing lows and trying to bottom.

At the very least, I would expect the recent gap to be filled, with SPY running to 120.00.

Volatility will remain elevated, so expect the unexpected. With volatility high, we are likely to see little in the way of consistent follow-through.

The chart above has lines on it that were drawn better than 6 months ago. I always find it interesting to draw the support and resistance lines and then see how they perform months or years down the road. These lines have successfully framed the recent range, and they were drawn almost a year before this move.

Comments »