iBankCoin
Joined Nov 11, 2007
1,458 Blog Posts

Examining Market Tops and Bottoms: A 7 Year Historical Perspective

Nasdaq 7 Year Weekly

The last 2 weeks saw the indexes challenge 5 year trendlines as established from the lows of 2002. It is interesting that the action of the last few months looks very similar to the action during the 2000-2002 Bear Market. Actually, as the Nasdaq is still well beneath its all-time highs, it has been in a Bear Market since 2000. However, it currently looks the least “toppy” of all the indexes. On the weekly chart, it looks more like a correction than the beginnings bear market.

DJI 7 Year Weekly

The Dow Jones has barely managed to stay above its 5-year trendline. However, it is staying above its all-time highs of 1999, meaning it is the only index higher now than 7 years ago, unless one adjusts for inflation.

SPY 7 Year Weekly

The SPY and the DJI have put in beautiful Head & Shoulders tops. Note the huge Bear Market rallies during 2001. We have yet to see a snapback rally of such a large magnitude. If the downtrend is maintained for some time, it would not be unlikely to see such a snapback rally.

Overall, the last 5 years is starting to look like nothing more than an extended Bear Market rally, as the DJI is the only index still above the highs of 1999-2000.

Comments »

Feeling Vaguely Bullish

Volume swelled today, giving the indexes a much needed accumulation day. With the indexes pulling back on lighter volume, and going back up on strong volume, I can’t help but to feel that old tingle again. Of my short positions, I have a couple that have exhibited good relative strength. I may cover them in the morning.

Other than the technical issues listed above, there is really nothing that has changed. Yet, I still can not shake this bullish feeling.

Due to this feeling, I screened for some breakouts and other bullish setups. There are still really not a lot of great breakouts to speak of. I’m only finding a few quality ones every evening. This goes to show that the markets are still in bad shape.

As we keep waiting for new leadership to emerge, note that Trucking is one of the most improved industries of late. Due to this change, I’m posting a couple of nice looking charts from the truckers.

I also am beginning to like coal more and more. I think coal stocks could pull back more here, but many are printing some bull flags. I’ve included my favorite coal company chart below. See my previous post on coal here to review the names: Is the Coal Trade Overheated? A Look at 13 Coal Companies.

Finally, I’m sure this irrational feeling of bullishnes will pass. However, I may still nibble a little on the long side tomorrow, if for no other reason than to have the ensuing pain shock me back to my senses.

ODFL

From the truckers, [[ODFL]] and [[JBHT]].

JBHT

JRCC

Above, from the coal sector, is [[JRCC]].

WMS

[[WMS]] makes gaming machines and video lottery terminals.

URBN

And finally, as hard as it is to believe, [[URBN]] is a retailer that is actually working.

Comments »

Sitting On My Hands

Well, I wimped out today and did not add any short positions. Now what I am seeing is a lot of setups that are nearing oversold. With the indexes nearing prior lows, I do not want to get caught majorly short if the indexes re-test the lows, and then bounce.

My plan is to keep my current short positions, and maybe add one more tomorrow, depending on the action. Other than that, I will sit on my hands.

Some things to note: One indicator I’m trying to develop screens the universe of stocks for ones with an RSI(2) of less than 2. Tonight’s reading has only 33 stocks with an RSI(2) of less than 2. At previous turning points (lows) in the past year, that number has been well above 100 and usually above 200. For example, on January 22nd, there were 323 stocks with an RSI(2) <2. This could mean that stocks have a lot farther to go before we reach the oversold levels associated with a bounce.

Also, has anyone noticed that there seems to be very little fear right now? The indexesd are setting up to re-test a very significant low, and yet it seems like business as usual.

Finally, some required reading. I’m serious. If you haven’t read this, it is an absolute must. It is surely a trading classic. I started it one evening on a whim, and ended up printing the whole thing out and staying up damn near all night long to finish it.

A credit union loan may or may not be your answer to getting rid of mortgage broker leads. But usually loans lead one into more complicated matters like refinance mortgage. When getting a home insurance, it is important to get rid of any unsecured loan lingering on the house. The homeowners insurance alone covers quite a lot, which is a welcome news after all.

Comments »

It’s A Bear Market, Stupid

As I watched the progress of the last 7 days vanish in just 5.5 hours, I wondered how many new longs were getting shaken from their high-horses. It seems most traders were able to identify a tradeable bottom- but they had a hard time actually trading it. Well, I’m making some assumptions, I guess. But it is easy to assume many have been unsuccessful as the chorus of longs chanting “Buy Buy Buy” grew to its strongest level on Friday, the apex of the bounce. How many traders put together a watch list of longs for Monday?

What makes trading during a bear market so extraordinarily difficult is that things always look their best when they are at their worst, and just when one thinks Armageddon is nigh, the light appears at the end of the tunnel. A bear market trader will have to be able to sell strength and buy fear, period. Waiting even one day for confirmation of a trend-change will result in missing the bulk of a move. It is not a market for rookies or for those who are not willing to impale themselves upon their convictions.

And so, it was, and will be, as it is today– did you buy today’s fear? Did you sell Friday’s strength? Truly, waiting for confirmation is murder in this tape.

Nasdaq 2_5_08

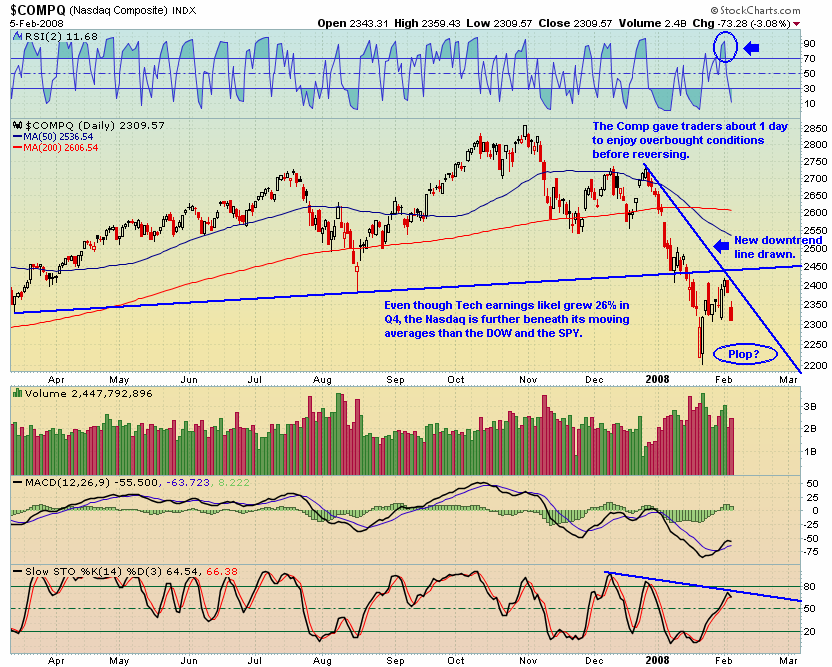
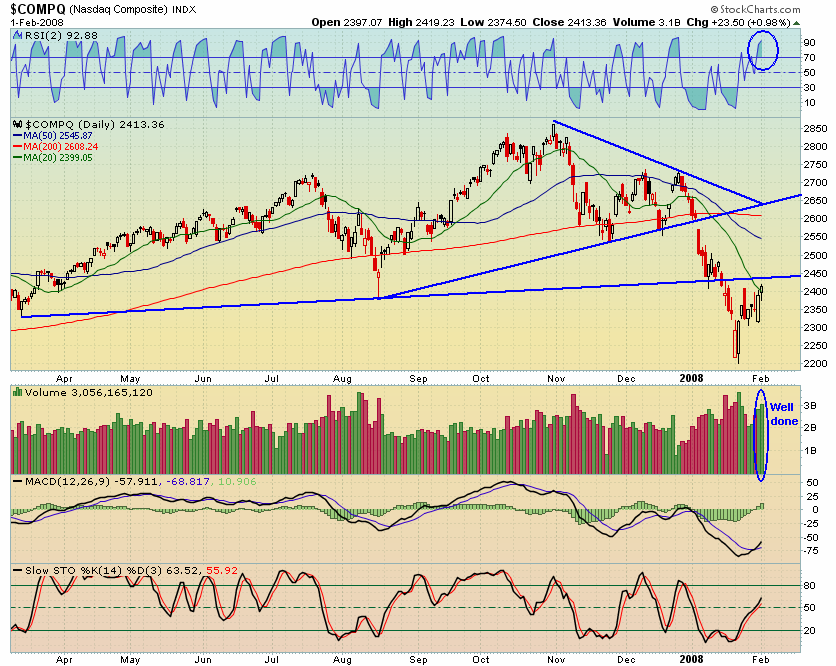
Looking at the Nasdaq, it is perched precariously on a precipice overlooking a swift 100 point cliff. While IBD today says tech earnings likely grew 26% in Q4, you wouldn’t know it from looking at the chart. It looks like it could free fall, again. The new downtrend line added today shows the severity of the move down. If you did not get short on Friday or Monday, you have already missed a big part of the move.

DJI 3 year Weekly

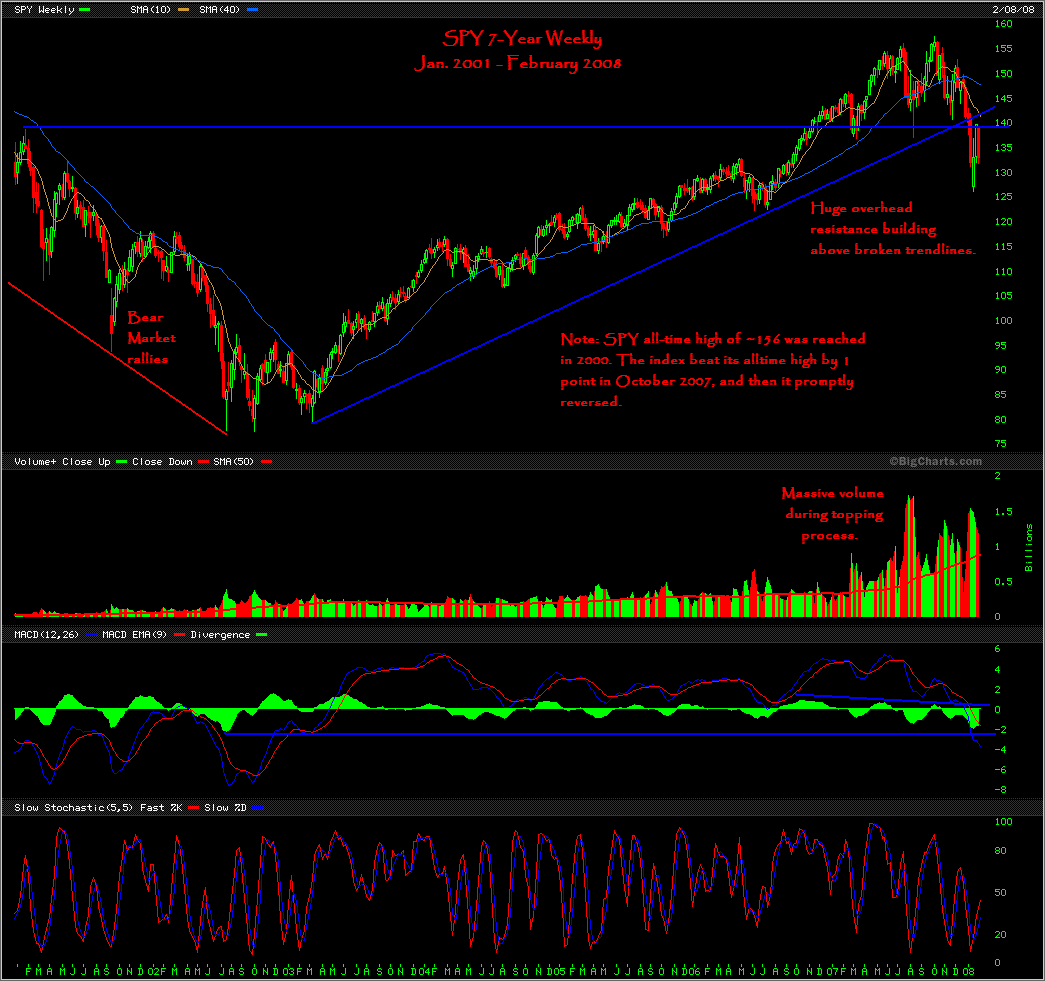
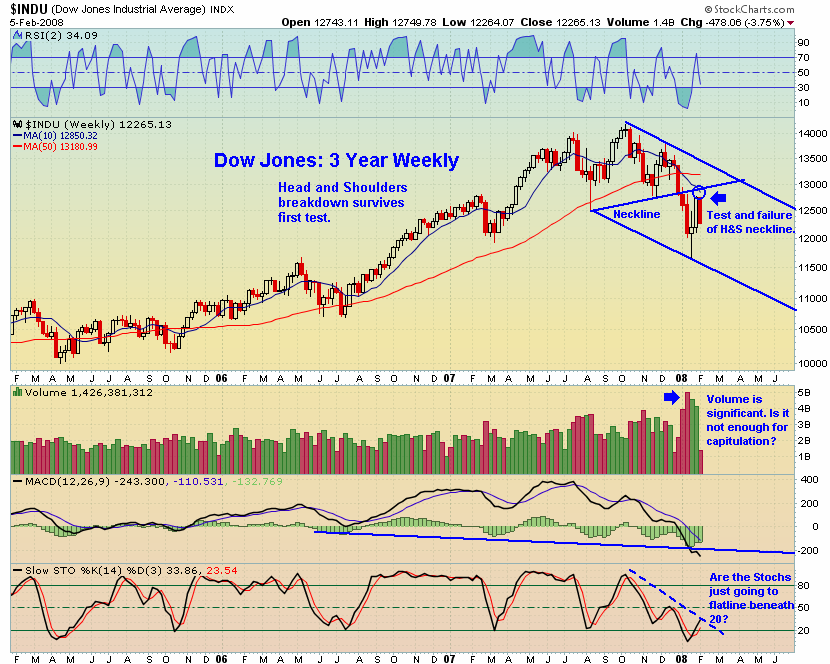
Note that on the Dow Jones Industrials’ 3 Year Weekly chart above, the index completed a Head and Shoulder breakdown and just made its first unsuccessful test of the neckline. Observe the complexity and volatility of this top against the relative calm and order of the previous uptrend. This looks like a BIG top. Whether it will be or not remains to be seen.

SPY 2_5_08

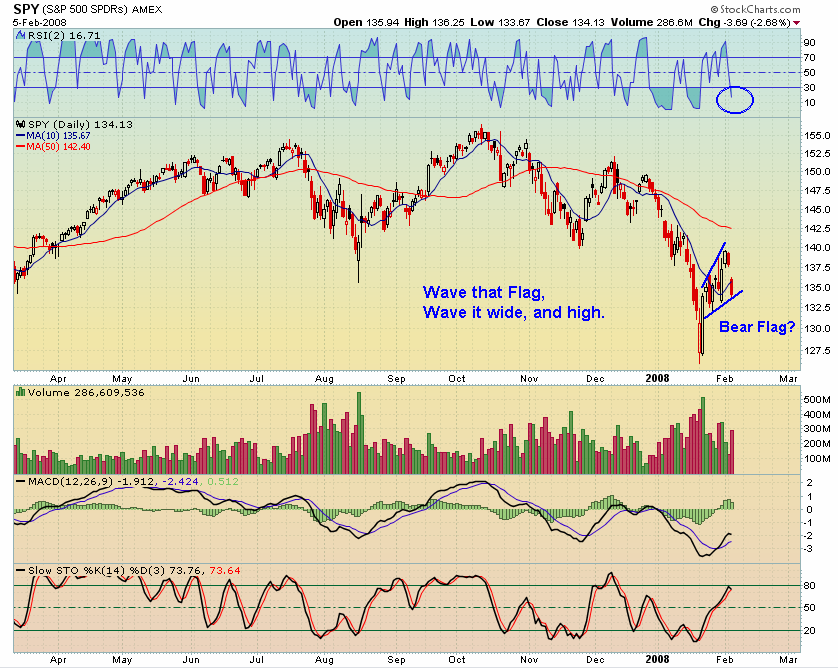
More of the same on the SPY. A lot of open air down there. I mainly put the chart here because of the big ass bear flag. Or, maybe for longs, its a flag for surrender.

VIX

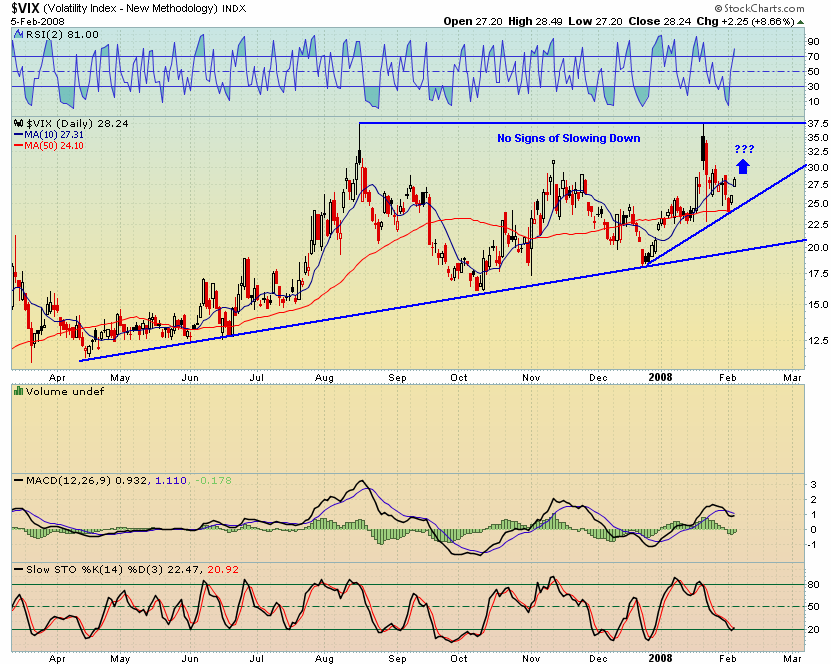
I included a chart of the VIX to appease those who keep noting bearish sentiment. Folks, this chart shows that Fear is ever-growing but has still not shown signs of a permanent peak. Investors Intelligence had Bulls at 40.2% and bears at 32.2% on Monday. That’s right, there were still more Bulls than Bears.

DOW

Finally, I haven’t put a whole lot of time in finding setups this evening because I’m assuming that those who have firm convictions have already positioned themselves. Also, after the last shenanigans from Bulk Shipper Ben, I’m wary of more “stimulus” affecting any new short positions. While if your thesis is to buy here, I can’t blame you. However, that is not my thesis, so I have no potential longs to examine.

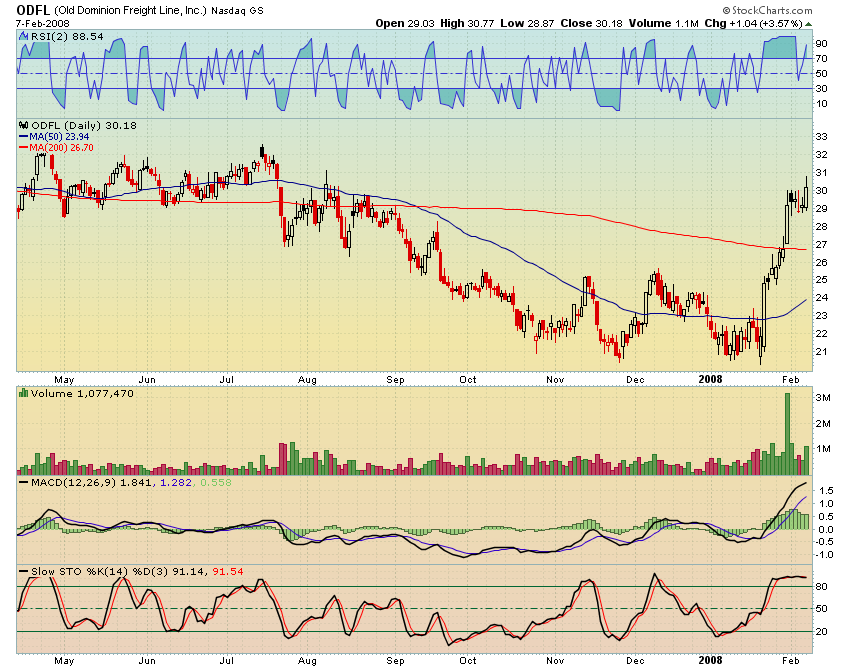
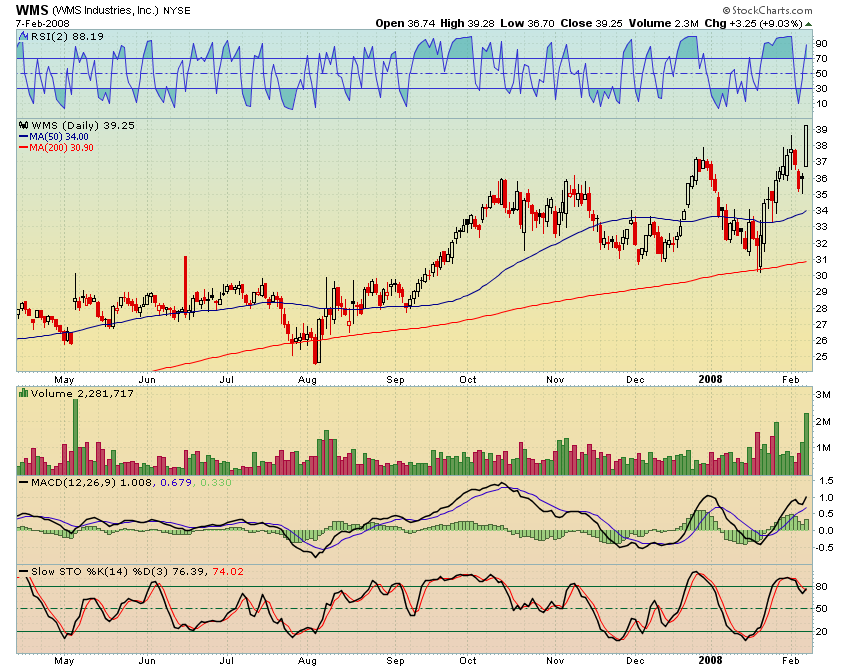
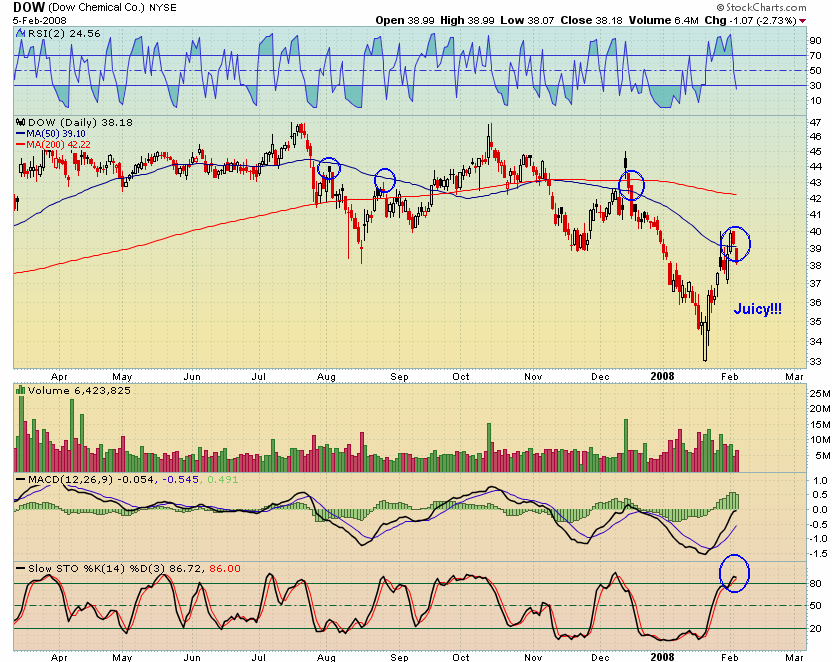
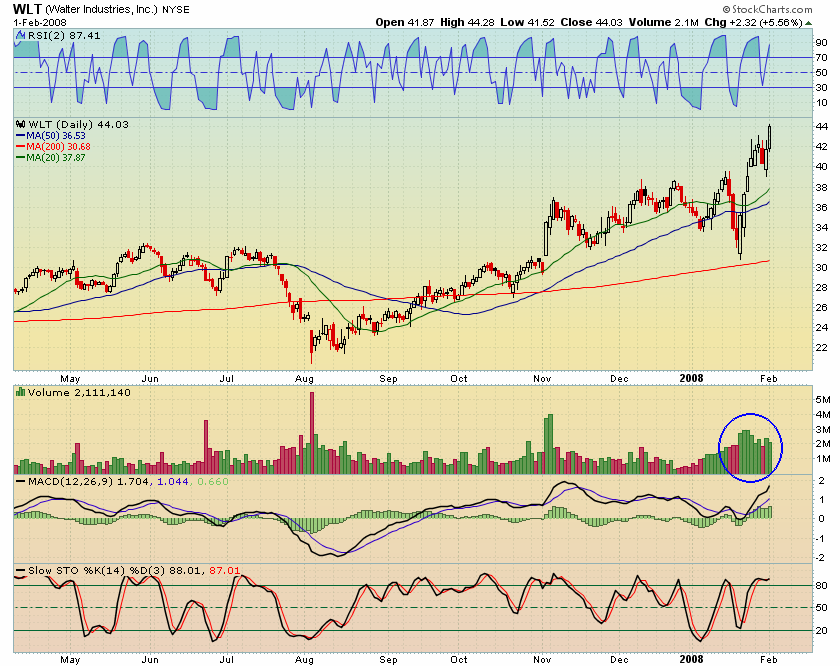
Alas, I still couldn’t resist posting this joozey set up for [[DOW]].


People with bad credit need loan to get out of the sticky situations. However, on bad credit credit cards and loans tend to add even more problems. Even business cards need to dealt with more care in this respect. The capital one credit card has made a break through though, with offering options like student loan and personal loan and that too interest free. However, small things like gong through an insurance quote matters in dealing with debts, and there should be no qualms about going through free insurance quotes either.

Comments »

If You’re Not Already Long, Then Wait.

I will readily admit I should have been a buyer and not a seller of what has certainly developed into a tradeable low. I speculated that it might be tradeable in another post, then later presented even more technicals pointing towards a low, and then did not buy as I did not feel the volume associated with the low was great enough. Allowing one errant variable to keep me out of the long side was stupid as the rest of the technicals were screaming a tradeable low.

However, if you’re like me, and sitting in a lot of cash, then I think it is prudent to wait before buying. Full Disclosure: I have 3 short positions and 2 long positions. By a very small margin I am net long.

The charts show why I think waiting is prudent.

DJI

 The chart above shows the DOW to be just beneath major resistance. Buying here means buying too late and buying high, unless you think we’ll V bottom out of this. Or maybe you like buying DOW 13,000? I think it gets sold there.

SPY

The SPY shows the same as the DOW. One good day’s rally and we’re bumping our heads on the 50 day. I am absolutely sure that level will meet with significant selling. Again, going long here is betting on a V bottom.

COMP

By far the most damaged of the indexes is the Nasdaq. Maybe it means it goes higher since it is farther below resistance. As I wrote in an earlier post, I don’t see it getting much past 2435.

Clearly, the indexes are just beneath resistance. To buy here means putting faith in a belief that resistance will fail on the first try. Rather than top tick it, I recommend waiting for any pullback as resistance is met, and then considering buying in. Keep in mind that last week was the market’s best week in 5 years. What are the chances it puts in a repeat performance this week? Of course it could, but since the market is generally a combination of give and take, I think this week we’ll see some taking, again. 

Comments »

Is the Coal Trade Overheated? A Look at 13 Coal Companies

The majority of these coal stocks are overbought. While they also look a tad toppy, they may still be worth watching for an entry on a pullback. I would not short these here as their seem to be some fundamental demand driving coal right now.

I did a cursory google search, and I found this article to be helpful in understanding what is driving coal skyward. The Oil Drum:Europe | Coal Crunch? Also, I believe Lord Duc posted an article about China running their mines overtime.

Maybe you fundamental analysis types would do some research on which of the companies below stand to benefit the most from the recent rise in coal demand.

I will watch these for a pullback and look to enter if the technicals and fundamentals are still compelling.

ACI

[[ACI]]

ANR

[[ANR]]

BTU

[[BTU]]

CNX

[[CNX]]

FCL

[[FCL]]

FDG

[[FDG]]

ICO

[[ICO]]

JRC

[[JRCC]]

MEE

[[MEE]]

NCOC

[[NCOC]]

WLB

[[WLB]]

WLT

[[WLT]]

YZC

[[YZC]]

Comments »

Friday’s 52 Week Highs List. Are Leader’s Emerging?

Download the spreadsheet here: 2/1/08 52 Week Highs List 

There are a surprising number of stocks moving higher from sound bases within Friday’s list. However, I would like to see a good pullback before getting involved. Assuming we have seen the worst of the sell-off, what are the chances that one or more of the new-leadership names are below?

This list is in order of greatest average volume.

[[HCBK]] [[NLY]] [[TJX]] [[ACI]] [[OI]] [[MFA]] [[RTN]] [[ANR]] [[MEE]] [[ICO]] [[APOL]] [[TNE]] [[ELN]] [[WLT]] [[ACV]] [[SID]] [[DAR]] [[FDG]] [[INCY]] [[CHU]] [[CZZ]] [[FLO]] [[CALM]] [[TUP]] [[MBRK]] [[CLF]] [[IBKR]] [[FCL]] [[CXG]] [[PHRM]] [[KMP]] [[RATE]] [[MC]] [[WMS]] [[CHTT]] [[AUXL]] [[CLHB]] [[HCSG]] [[BOBJ]] [[SMA]]

Comments »