iBankCoin
Joined Nov 11, 2007
1,458 Blog Posts

I am 97% Long

While most of the other bloggers write a good bit about their trading, I generally have not done so. Well, I do trade, and today was one of my better days, so I thought I’d take the opportunity to write about it. 

Since November, I’ve been calling the turns in this market like a working-man’s magician (not to be confused with the space-alien magician). Yet, I’ve been trading small due to having a difficult time last year. Trading small has allowed me to regain my confidence, and have a modestly good year, so far.

My research on tops and bottoms showed that we were due for another rally. This research, coupled with the research of a few others, allowed me to feel certain it would come this week, although I expected another flush-out, and then a reversal day. I decided that when the relief rally developed, that I would cover all my shorts, and get really long. What’s the use of developing a great read on the market if you do not trade your convictions?

As I cannot trade anymore at work, or even get real-time charts, I’ve been working with my Dad and sometimes my wife to allow intra-day trades. I talked to my Dad last night on the phone, and told him I thought we were due for a rally. I asked if he would be around this week to place some trades for me. He said he would be.

So today, when I saw what Bernanke did, I knew immediately what I had to do. Making matters a tad more difficult was the fact that I had to be on the road at 9:15 a.m. to a meeting. The last time I was able to look at the futures was just before 9:00 a.m. I called my Dad, and told him that I expected the indexes to dip around 10:00 a.m. I gave him instructions to sell all my [[DXD]], [[SDS]], [[QID]], and cover my [[DE]] short on any dip. Once he liquidated those, I gave him a list to buy. I had him buy 300 SPY, 300 DIA, 300 QQQQ, and 300 UYG. These positions, coupled with a small position in [[MBRK]] would leave me almost 100% long.

Well, my Dad came through for me, big time. He waited and waited for a dip. Finally, after 11:00 a.m., he executed the trades. Excellent work, old man. Due to this maneuvering, my account had a second day in a row of outstanding gains, making a new high for the year.

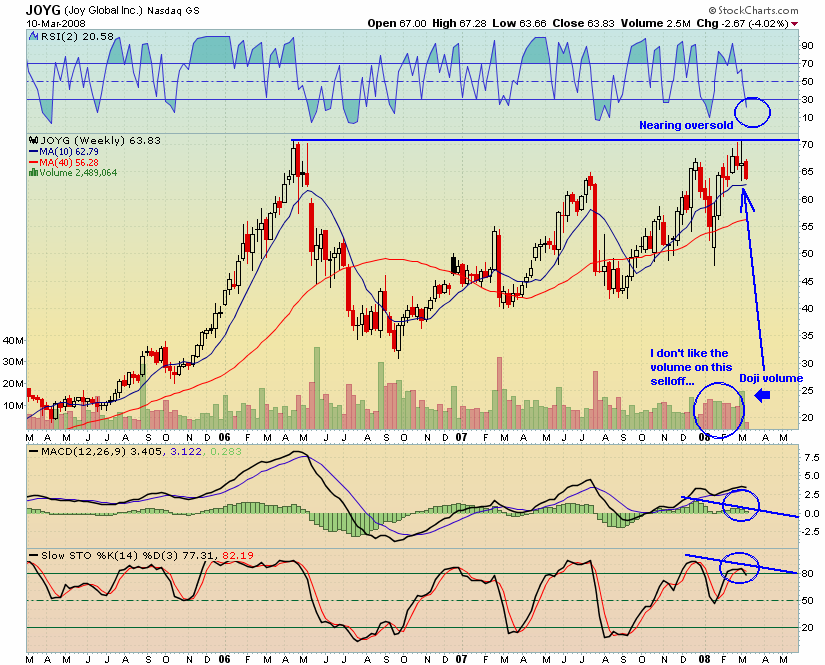
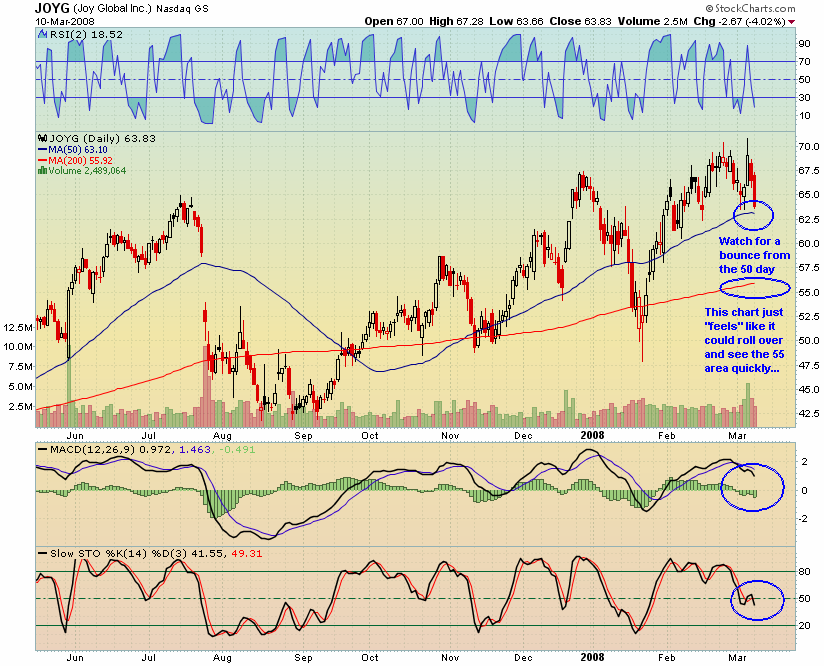
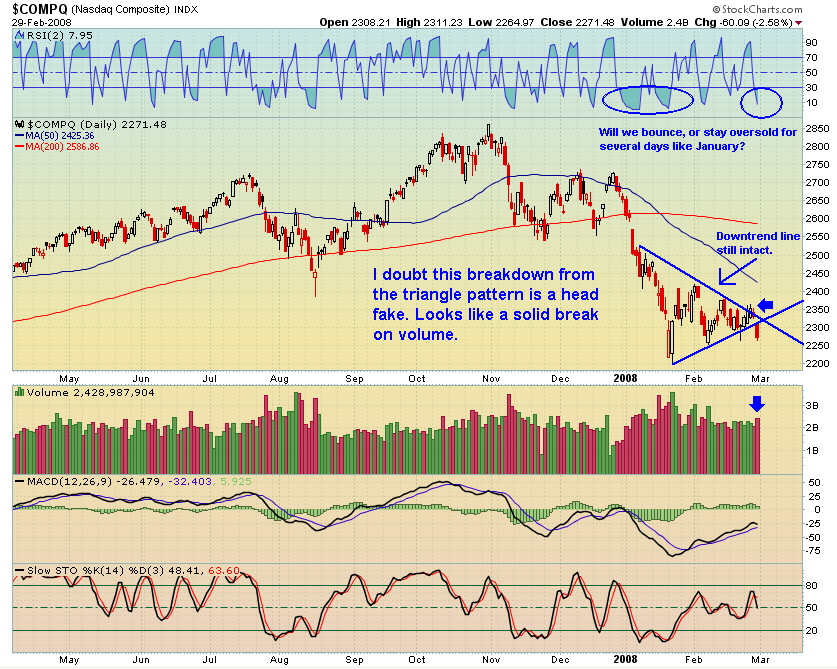
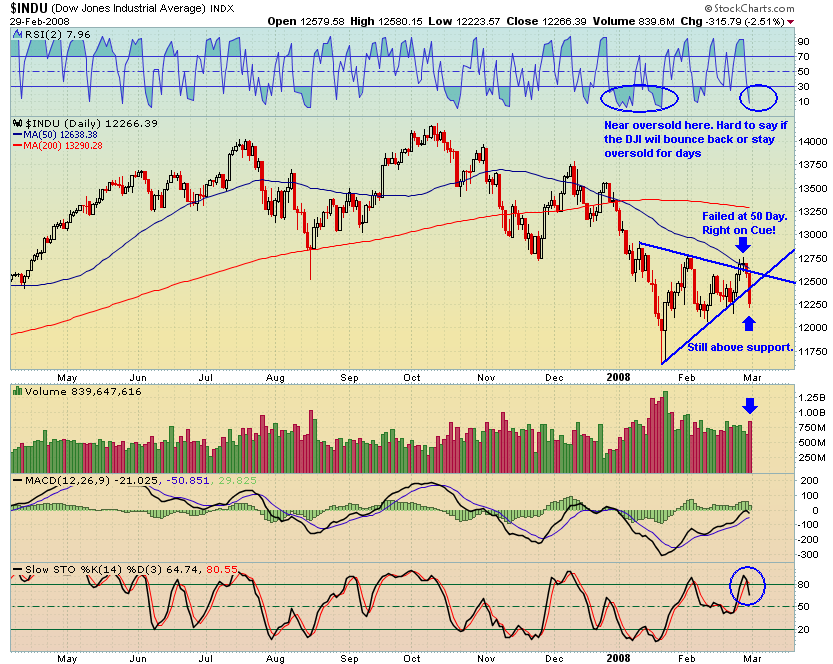
My plan is to liquidate these positions into more strength, or near the 50 day average.

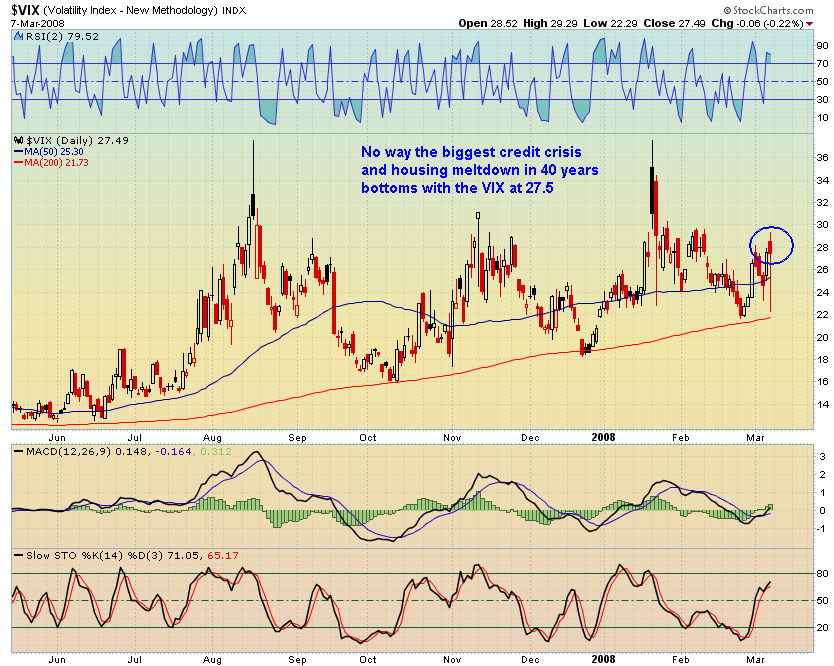
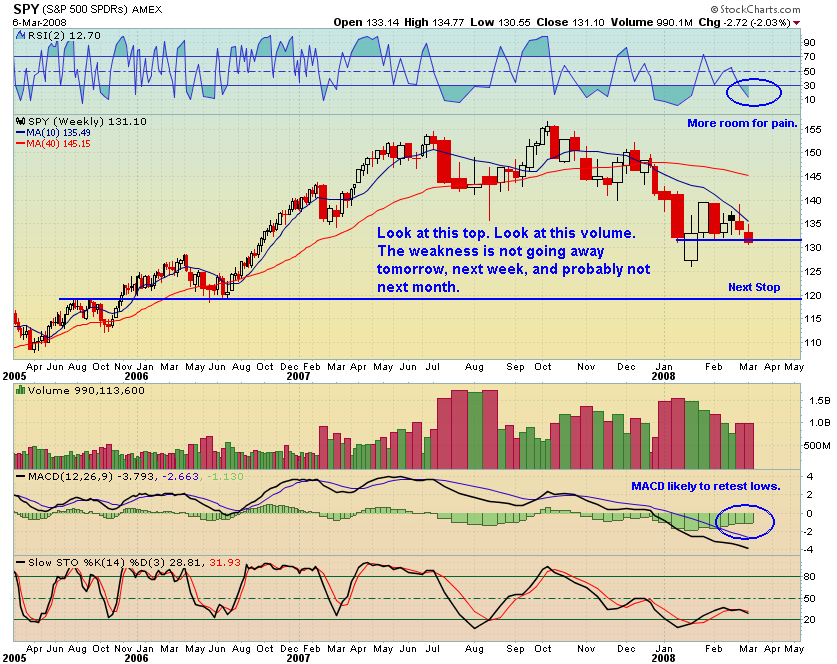
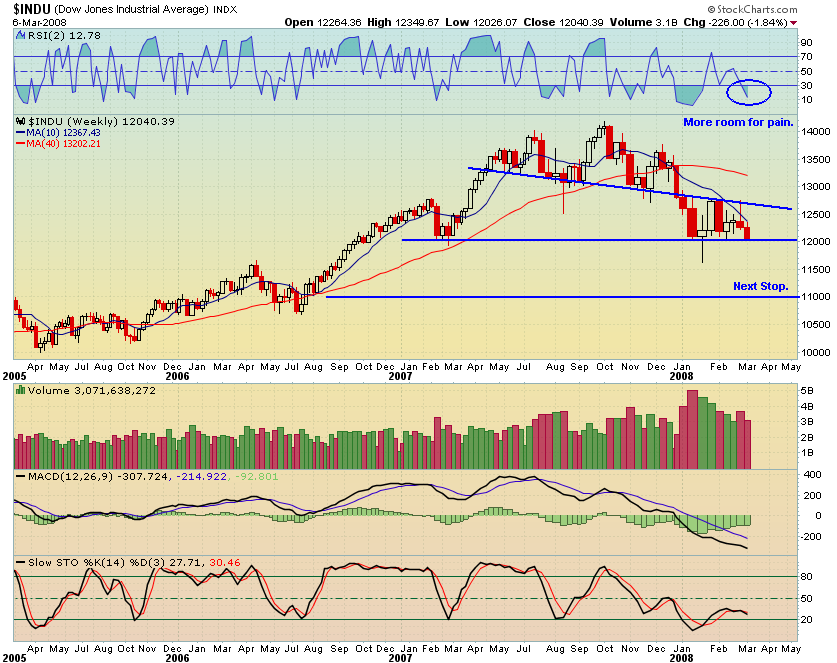
Overall, I am still bearish, and until the price overtakes the 50 day average and tests and holds it, I will not become bullish. Volume today was a joke, for such a strong move. In order for the double-bottom pattern to work, volume will need to increase if the indexes continue moving up. Fundamentally, Bernanke’s knuckleball may be a game-changer. However, I’m not qualified to judge such things, so I’ll continue to trade the technicals.

Comments »

Reader Request: CHK and JOYG

Employee8 asked today in the comments section about several charts. I think he may have answered (or the market did) his own question on [[MOO]]. However, he mentioned that the guys on Fast Money were talking about [[CHK]] and [[JOYG]], and he wondered what my opinion is about them, especially if the indexes bounce this week.

First, these are not the type of stocks I would buy to take part in any short covering or reflex rally. Actually, what we want to buy are the most beaten down stocks of the Dow Jones, the S&P, and the Nasdaq 100. Pick a few that have been killed over the last three weeks, and buy those. Rob Hanna’s excellent research on his blog Quantifiable Edges confirms this. If you visit his blog, you will have to do a little searching to get to the research mentioned above, but most will probably enjoy whatever else they stumble across there.

JOYG 3 Year

I should be clear that I do not like buying stocks in a bear market. Seems rather masochistic. Therefore, it might be instructive to take a longer view of things. The 3 year weekly chart of JOYG is certainly bullish. The stock has created a multi-year cup-like formation. There are negative divergences in the MACD and Stochastics, as they were not able to make a higher high when the stock did. Note that the stock reversed at the previous high, almost to the penny.

JOYG 

The daily chart of JOYG just bothers me. I do not like raggedy, jagged charts. The volatility just kills me, so I stay away from them. However, if one does not mind the swings, it has certainly been a winner. I would wait to see how JOYG reacts to the 50 day average. If that does not hold, watch the 200 day. It is a bear market. It is not like these stocks are just going to run away and you will never get another chance to enter. Patience will pay off. I think JOYG will roll over a bit more. Any change in the coal market fundamentals could cause a severe sell-off. Democrats in the White House?

 CHK 3 Year

Now the 3 year weekly of CHK is a beauty. I love it. What a beautiful saucer shaped base. There is really nothing about this chart not to like. However, as I mentioned above, it is a bear market. Let it come in before buying.

CHK

The daily chart of CHK shows just how far this stock moved in a short period of time. While the RSI(2) shows it will likely stabilize for a few days, I think it is probable that $41.00 is a magnet. I would want to see how close CHK will get to $41.00 before buying. Then, once it nears $41.00, remind yourself it is a bear market, and re-evaluate, one last time. Actually, since Danny is short CHK, the stock will likely reverse tomorrow, to make new highs.

Note to Employee8: These comments were not really directed at you, or anyone else. I’m just sort of ranting a bit.

Comments »

Here Comes the Double Bottom Double Talk

There will soon be talk across the internets about a double bottom. Here is a primer on the elusive chart pattern.

SPY 2002

As the Nasdaq has undercut previous lows, there is already talk of a double bottom. It is best to consult William O’Neil’s teachings on this chart pattern. According to WON, a double bottom will start by the index or equity making a new low. The stock then rallys 10-20%. After this sharp rally, the stock reverses, and undercuts the previous low. WON is a tad vague on whether the stock has to undercut the previous low in order for the pattern to be valid. It is stated that the 2nd low must equal, or in most cases, undercut the previous low. As the stock moves back up, the move up must be accompanied with above average volume. The buy point is achieved when the stock moves past the middle point of the W.

The chart above shows a somewhat a-typical double-bottom. This particular chart shows the bottom of the 2000-2002 bear market. Notice that the buy point is never triggered. Sticking to the methodology would have kept traders out of the index for months while it grinded lower.

SPY 1998

The chart above shows the SPY’s 1998 bottom. It is a textbook double bottom formation. Notice how the index pauses at the middle point of the W (the buy point) and at moving average resistance. Once the index clears the buy point and moving average resistance, it is off to the races.

Note that in each chart above, the MACD fails to make a new low while the price does. I find positive divergences in the MACD can be one of the best clues that a bottom has been put in.

SPY

Above is our current SPY chart. Note that it is lacking in W formation characteristic of the double bottom. More importantly, it has yet to undercut the previous low. Regardless, we can still identify the theoretical buy point.

Important points to ponder:

  • Since the characteristic W formation has not occurred, how has that changed the psychology which has shaped the pattern? I think the pattern is likely busted as longs and shorts alike have had ample time to consider the situation and position accordingly.
  • The SPY did not quite rally 10% from the first low.
  • Bulls will be screaming, “Buy, Buy!” as soon as a new low is made. However, that is not where the double bottom should be bought.
  • Should the SPY and DJI undercut previous lows and then rocket back up, price will soon overtake the 50 day average. My system has me enter when the price overtakes, then tests, and holds the 50 day average. As the double bottom buy point will be above the 50 day average, this confluence of signals would make me very bullish.
  • Can one index undercut previous lows and undergo a trend change without all the indexes undercutting previous lows?

VIX

Finally, I refuse to believe that the worst credit crisis and mortgage meltdown of the last half-century will end with the VIX at the level of 27.5

However, the indexes are nearing oversold, and are likely to bounce soon, but the best scenario for the pig-headed steers is to let everything fall apart before getting into the buying mode. My suspicion is that all the indexes need to undercut the previous lows. Then the bears may start getting nervous and the bulls can start regaining some confidence.

Comments »

We’re Gonna Need A Lot of Sugar…

COMP 3_6_08

to wash this medicine down. Everywhere I look tonight, there is more talk about the Fed, and what they are going to do.

Stupidity. Insanity. Ignorance.

The Fed is not trying to prop up the markets. As Ducati has been saying, the Fed is trying to save the banks. I have been beating what I feel is a dead horse for months now, but there is only one direction for the markets, and that is down. Do not fool yourself into thinking the Fed is going to stop the markets from taking their medicine. That is not their goal. The Fed’s first and foremost priority is to keep the entire banking industry from imploding. The market’s chips are going to fall where they may.

 SPY 3_6_08

If you think, for a second, that the Fed is going to be able to go POOF, with their magic wand, and make all this go away, then I implore you to look at the chart above. This chart shows a major breakdown. While I have 120 as my near-term target, the magnitude of this breakdown could certainly take the SPY much lower than 120. As much as I do not want to develop any sort of perma-bear tendencies, and as much as I do not want to miss the bottom as I become mired in doom and gloom, this chart is no where near showing a bottom. Even worse, it looks to me like the move may just be beginning.

DJI 3_6_08

Take a cup, and begin to pour the water out of it. Just as the water starts to pour over the edge, jerk the cup upright to keep the water from spilling. What happens?

While very little water may spill, the violent turmoil created when the cup is turned upright takes time to dissipate. Now look at the chart above. It is spilling over the edge. Any act by the government to keep it from spilling over is going to create turmoil. I do not think they can keep the water from spilling. I know for sure that the longs, as smart as they think they are for buying here, will not survive the turmoil, should more magic tricks be employed to slow down the fall. They will get washed out long before stability returns.

I have written before that the only way to be profitable here is to get short, and then sit. We are witnessing a spectacular trend. I’m amazed at the amount of traders who still want to fight it.

The Non Farm Payroll report may be mediocre, ugly, or better than I expect. No doubt, the cheap greenback is helping with our exports and manufacturing. For this reason, I still have a large cash position. I do not want to get caught 100% short with a good jobs number tomorrow. I think the report is going to cause the remaining bulls to slit their throats. If I’m right, then I will deploy more cash into inverse ETFs. As noted above, I’m looking for another leg down to the targets shown on the charts. Once my targets are hit, I expect more bottom calling, posturing by various agencies, new bailouts, new blowups, etc. and more trading sideways. We will evaluate our next move when we get to down to some more round numbers.

The market must take its medicine. This prolonging of the inevitable is just wrecking the free market ideals on which this country is built.

Comments »

Will Non-Farm Payrolls Move the Market Friday?

The Employment Situation is the most eagerly awaited news on the economy. Because the news is very timely, only one week after the month covered, and because of the amount of data about the job market and household, this report has great economic and political significance. “No single economic indicator can jolt the stock and bond markets as much as the jobs report.¹”

The ADP National Employment Report is always released two days prior to the BLS data. As one could tell from today’s bullish session, this report does not carry much market-moving influence. The ADP Report is disregarded by market participants as it has not been around long enough to build credibility and because of the perception that it is not statistically signifacant compared to the government’s data.

That perception is incorrect.

I have pasted here the statistical properties of the ADP Report. You can go the site and read them in a larger format here:

ADP Revised Methodology 

ADP Statisical SignificanceADP Statistical Significance

Because there is statistical significance to the report, I’m surprised it is not given greater weight. Anyway, that’s a debate for another time.

Here is the meat of the report released today:

Nonfarm private employment declined 23,000 from January to February 2008 on a seasonally adjusted basis, according to the ADP National Employment Report™. The estimated change in employment from December 2007 to January 2008 was revised down 11,000 to 119,000. February’s decline of 23,000 signals a deceleration of employment growth across businesses of all sizes.

Employment in the service-providing sector of the economy grew 47,000, while employment in the goods-producing sector declined 70,000, the fifteenth consecutive monthly decline. Manufacturing employment fell 40,000 in February after declining a revised 3,000 in January, and marked the eighteenth consecutive monthly decline.

Read the rest of it and see some nice charts here : Complete ADP Employment Report

Here is the issue: Last month the ADP Report showed growth of 130,000 jobs, while the government’s estimates were -17,000. Note that the market has not traded past the high of February 1st, the same day the government released the BLS estimates of -17,000.

As today’s ADP Report shows -23,000 jobs, let us play a game of “What if…” What if Friday’s jobs numbers are of a similar spread  and relationship to the ADP numbers as last month. If so, on we could expect the BLS to report -170,000 jobs on Friday.

What would that do to the market?

Finally, the other reason the Employment Situation moves the markets is because it can often be a surprise. Anyone want to predict if there will be a surprise Friday?

See the Bloomberg consensus estimates here: Bloomberg Employment Situation Consensus Estimates. Their estimate is creation of 25,000 jobs.

¹Baumohl, Bernard. (2008). The Secrets of Economic Indicators: Hidden Clues to Future Economic Trends and Investment Opportunities. 2nd Ed. Wharton School Publishing. Upper Saddle River, New Jersey. Pg. 25

Comments »

My Company’s Stock is in the Crapper

Today, the CEOs of [[AMZN]] and [[CSCO]] reassured the markets with some bull puckey about reaffirming guidance for 2008.

Seriously. Look at these charts. What did you expect them to say?

AMZN 

“My company’s stock is in the crapper.”

“We are going to make 52 week lows.”

“Who buys books when they can’t afford toilet paper.”

“We just released a new product. Its like a book that needs batteries, and its 100x more expensive.”

“Routers? Route this, beeeyatch.”

CSCO

John Chambers, CEO of [[CSCO]] released his little nugget about being “even more comfortable” with the long-term growth targets the company has projected, right at 3:00. At that point, his stock was cratering. His statement propped the Nasdaq up for the day.

[[AMZN]] is no different from any other retailer and will live or die by the consumer, regardless of the CEOs desire to keep his stock from erasing every penny of gains its made over the last year.

This smacks of desperation, folks. But again, what did you expect them to say?

Comments »

Nasdaq Next Stop: 2000

Nasdaq 2_29_08

The Nasdaq’s breakdown out of the triangle pattern leads to a high probability of a re-test of lows. I am going to slowly position for the lows to get broken. My target for the Nasdaq is now 2000, or a 12% drop from these levels. At 2000, the Nasdaq will be roughly 30% from its October 31, 2007, high. This level of correction is consistent with historic averages. I have not decided when to remove my long hedges, but I know that I do not want to be holding them on the next leg down.

DJI 2_29_08

The Dow Jones, despite barely breaking above the triangle, reversed hard to close well beneath the pattern. However, it is still sitting above support in the 12,000 area which has been holding strong for just over a month. I feel the Dow Jones will test and plunge through the January lows. My target for the Dow is 11,000. That is roughly a 10% drop from Friday’s close and will represent a 23% drop from the October 2007 high.

SPY 2_29_08

The SPY, similar to the Dow Jones, is still sitting above support. I believe support will fail and the SPY will test lows. Ultimately I see the SPY hitting 120, and that is my target. That would be a 10% move from Friday’s close and a drop of 24% from the top. These levels of corrections for the Dow Jones and the SPY are much more in line with historic averages than what we are seeing currently in terms of a percentage drop from highs.

The VIX is currently nearing overbought levels. I would expect a short-term overbought VIX and indexes at minor support might slow down the descent. However, a quick flush down Monday and then some stabilization into the afternoon will probably finish off Friday’s momentum, leaving a few days for consolidation before breaking the lows.

I encourage traders to take a look at some 5 year weekly charts of the indexes. We are witnessing major breakdowns. These patterns are completely different than anything we’ve witnessed in the past 5 years. In my opinion, those traders that can establish short positions, and sit on them without getting shaken out, will be participating in one of the best trends of the past 5 years.

Comments »