iBankCoin
Joined Nov 11, 2007
1,458 Blog Posts

Dips Galore

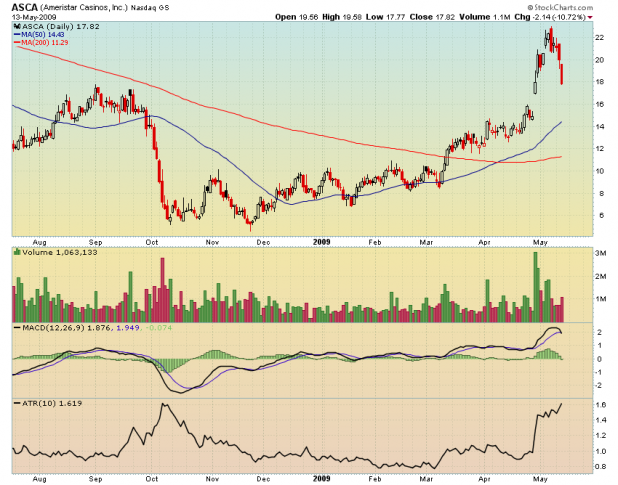
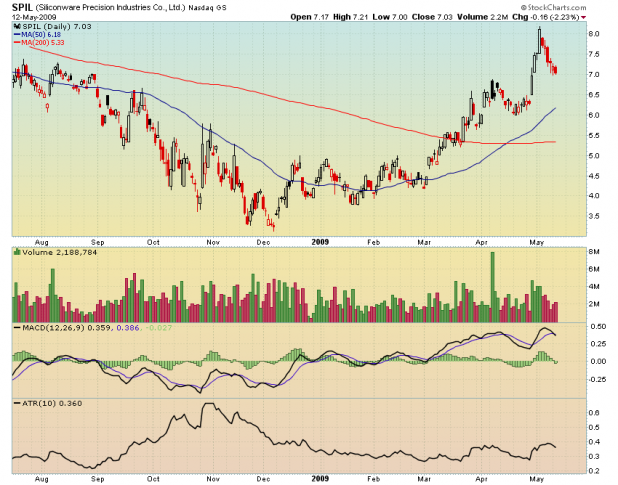
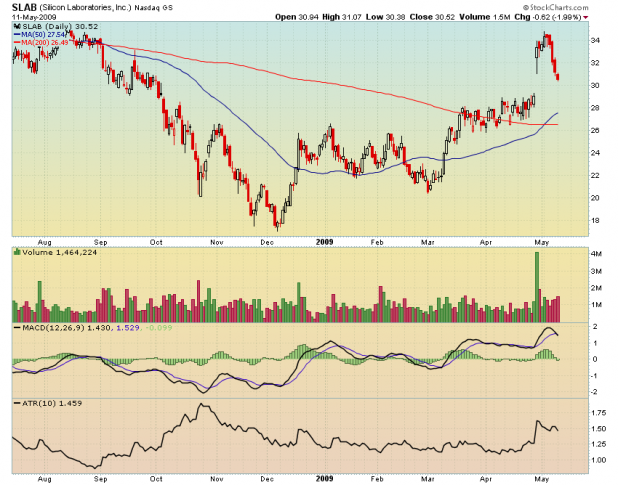
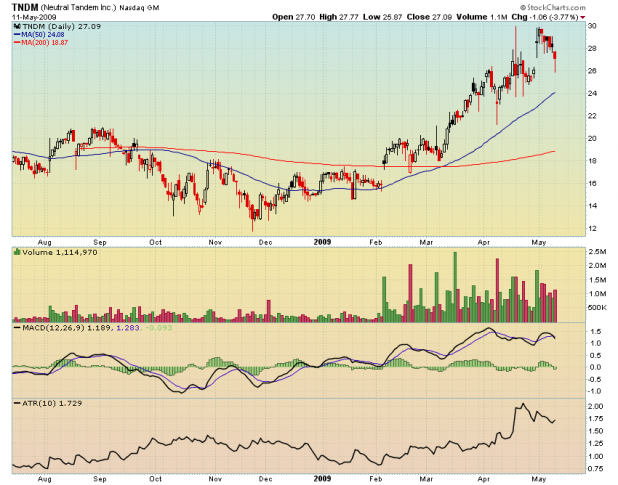
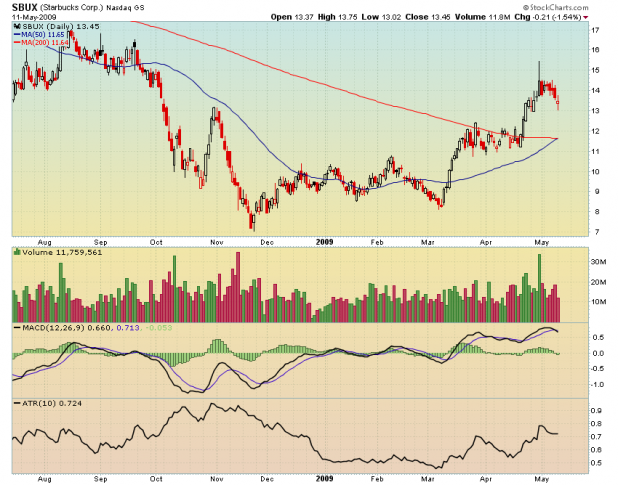
It was to be expected, after the massive run-up, that any pullback on the indices would result in a plethora of dips to be bought. As the Power Dip portfolio can hold five stocks, their is only room for two more. The system is currently holding SLAB, SBUX, and SPIL. TNDM stopped out yesterday.

Below are the two power dips that will be bought on today’s open:

[[ICON]]

[[ASCA]]

Tonight I will post the updated spreadsheet showing the current losses.

The difficult part about trading a dip-buying strategy is that when the conditions look the worst, the bounce will come…So the dips MUST continue to be bought.

Comments »

Closing SPY Short

On May 5th I sold short the SPY using 25% of account value. Tomorrow morning I will cover this short. The trade is currently showing a profit of 1.91%.

I will be looking to go long the SPY on continued weakness.

Comments »

Adding Another Pullback Play

On today’s open, the Power Dip strategy will add another pullback play when it purchases the beauty below.

This will fill four out of five possible positions.

I encourage the use of stop-losses on all these pullbacks, just in case a bounce never comes. Or in case the bounce comes much lower than expected.

Comments »

Power Dip Trade Accounting

In order to demonstrate the power of the Power Dip strategy, I will begin tracking all the trades the system takes.

For the most part, I take these trades in my own account and will use the price that I receive in the accounting. This will factor in any slippage from the opening price. In the case that I do not take the trade, I will use the nationally listed open.

Beginning Transactions

This is a simulated account. I’m trying out AmiBroker’s Account tool, but may switch accounting over to Excel should I decide that AB Account is a pain.

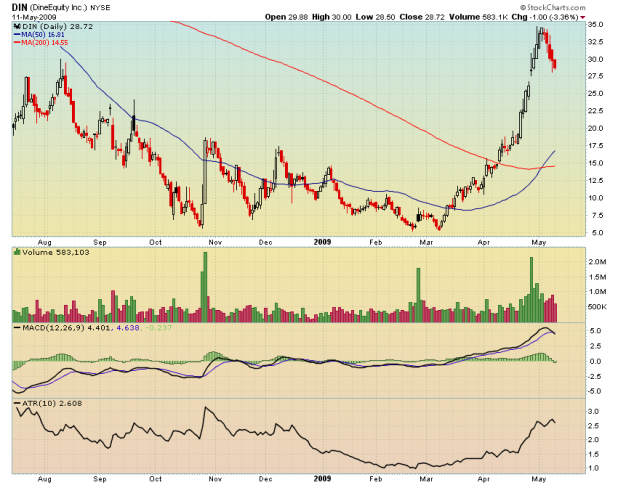
The account funded May 11th with 25K. Today, four positions were entered, at roughly 5K each. One position, DIN, stopped out.

Open Positions

Closed Positions

Look for more history on this system, included backtested results and statistics, in the near future.

Comments »

Power Dip Pullbacks

The system that filters these stocks is called the Power Dip. It is a dip-buying system. I hope to unveil more about this system in the coming weeks.

[[SLAB]]

[[DIN]]

[[TNDM]]

[[SBUX]]

An 8% stop loss has backtested very well with these setups.

I will post when it is time to exit these due either to a target being met or the stop loss being hit. The goal is to catch the upswing only, meaning the hold times for these will be short, approximately 5 days on average.

Comments »

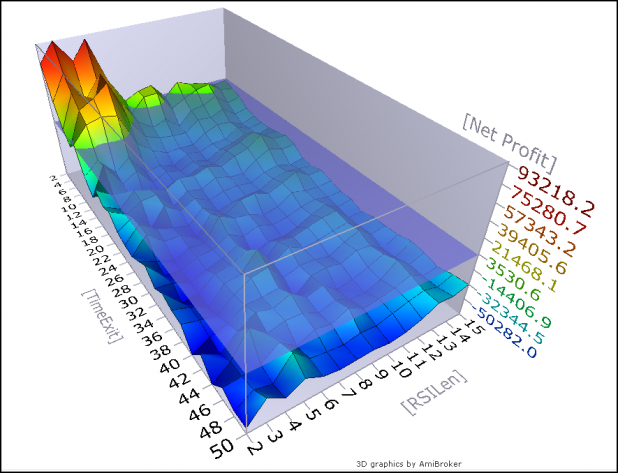
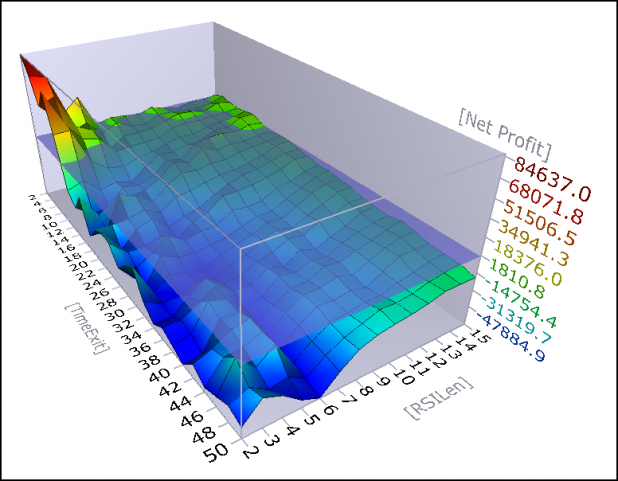
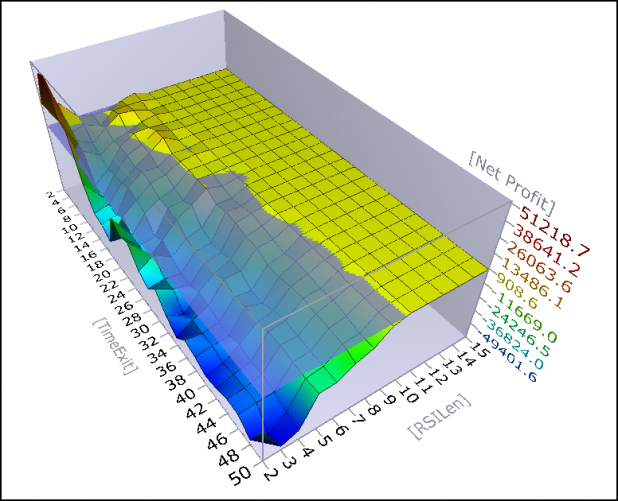
RSI(?): Testing for a Predictive RSI Setting- QQQQ

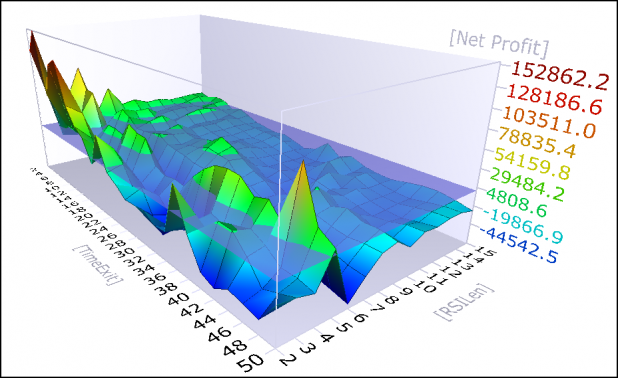
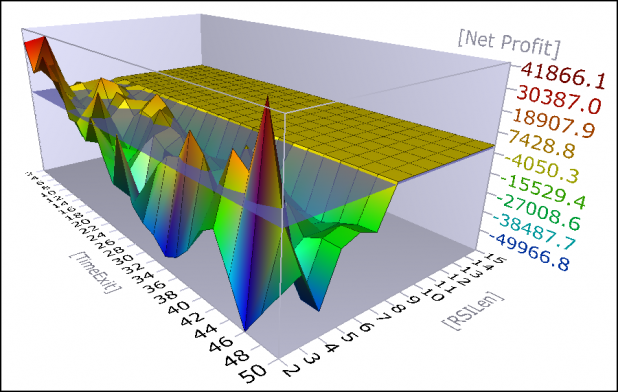
This post continues my objective of examining the period settings of RSI to determine which periods offer predictive qualities. The previous study looked at the SPY. This study examines the QQQQ.

Parameters:

All short-sells and buys-to-cover were executed on the open of the day following the buy/sell criteria being met. For example, if RSI(?) closed at 71, then a short entry was executed on the following open.

A time exit was used, starting with a 2 day exit (which means an exit on the open of the 3rd day) and increasing in increments of 2 with a maximum length of 50.

The minimum RSI period length tested was 2 with a maximum of 15.

QQQQ was tested, using all history available. Future tests will include more ETFs and stocks.

The test uses 100K of starting equity with gains compounded on each trade.

Results:

Overbought = 70
Overbought = 80
Overbought = 90
Summary:

I have decided to refrain from discussing these tests in depth until the end of testing, when I will summarize and draw conclusions based on all the data.

I must note though that these results are similar to the SPY results, and they suggest that a period setting greater than 6 offers little value.

Comments »

RSI(?): Testing for a Predictive RSI Period Setting

Un-scientific observations noted here piqued my curiosity as to what RSI period setting is the most predictive. Over the next week I will be running some tests in order to determine which RSI settings are predictive and which ones might be discarded as useless.

First I will look at using RSI as an overbought indicator.

As 70, 80, and 90 are commonly used as upper boundaries on RSI, I ran a test for each of these levels.

Parameters:

All short-sells and buys-to-cover were executed on the open of the day following the buy/sell criteria being met. For example, if RSI(?) closed at 71, then a short entry was executed on the following open.

A time exit was used, starting with a 2 day exit (which means an exit on the open of the 3rd day) and increasing in increments of 2 with a maximum length of 50.

The minimum RSI period length tested was 2 with a maximum of 15.

The SPY was the first symbol tested, using all history available. Future tests will include more ETFs and stocks.

The test uses 100K of starting equity with gains compounded on each trade.

Results:

Overbought = 70

Overbought = 80

Overbought = 90

Discussion:

Feel free to discuss this amongst yourselves. It is my birthday today, and I have lots of things to do to prepare for the grand Luau.

As time permits today, I will be back to update this post to include some discussion about these results and to draw some conclusions.

I will leave on this thought (If only to stir up some controversy/discussion): it appears that the standard RSI setting of 14 has been almost useless, over the past 16 years, as an overbought indicator. Of course I have tested the most simple application of this indicator and have not measured how it performs when showing a divergence.

Comments »