iBankCoin
Joined Nov 11, 2007
1,458 Blog Posts

Shorting the Open

I will be selling short the SPY, at an amount equal to 25% of my account value, on the open.

I expect this trade to have a 60% chance of being a winner. If it is a winner, it will probably take about 5 days for my profit objective to be met.

I do employ an abnormal market filter for this trade. This filter works similarly to a stop, but very seldom will it ever require a trade to be closed out early. There is a strong chance my abnormal filter will trigger tomorrow. If so, then I will have to close the short at a loss on Wednesday’s open. The filter is telling me that there is a good chance that the market may stay overbought for a great deal longer than I want to be short.

Comments »

The 200 Day Average and Buying Surge before 5/29/09 Close

I have not read much discussion on the surge of buying into Friday’s close. I think it is signficant not only due to the surge of volume and rate of change, but because it sets the S&P 500 to challenge the 200 day moving average.

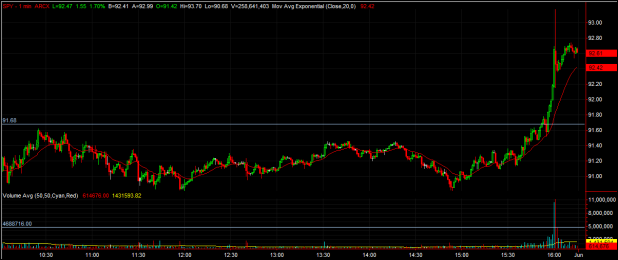
The chart above is a 1-minute bar of the SPY on Friday, 5/29/09. The chart begins just after the open, where the high was set at $91.68, shown by the upper horizontal line. The last four minutes of the chart shows the surge above the intraday high. The lower horizontal line shows the intraday high for volume, which was doubled in the last minute of trading.

I have read rumors of buying in the pit of almost $600 million in S&P futures, in the last minutes of trading. On an afternoon with little news to speak of, speculating on the motive behind such a large purchase (SPY moved over 1% in a few minutes) in a short period of time can be a fun exercise, but is probably of little true value. I find I enjoy the speculating anyway.

I have two separate platforms that show the SPY 200 day average at $93.03, while StockCharts shows the 200DMA as $92.05. Perhaps another bullish conspiracy? Kidding, of course. StockCharts does show the underlying SPY index, SPX, as being beneath the 200DMA. Any trader using only StockCharts data sees a close above the 200DMA on the SPY, which is a significant technical event.

As I type, the S&P E-mini futures are trading at 924.50 with the 200DMA at 928.59. Looks like the next test of the 200DMA may happen overnight. Monday is setting up to be a pivotal day.

Comments »

Extreme RSI(2) Screen

I am experimenting with some screens that will identify stocks that are overbought on multiple time frames.

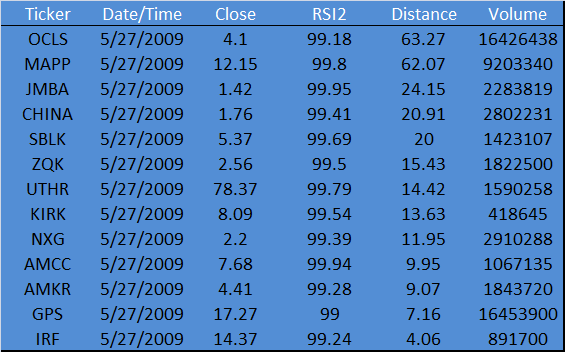
The screen below finds stocks with a RSI(2) reading above 99, and then calculates the distance the stock is in percentage terms above the 10 day moving average.

I don’t know that there is an edge to shorting stocks with both an extreme RSI(2) and price stretched above the 10 day. In fact, it might be a better long setup.  Anyway, today’s screen turned up some interesting charts, for both longs and shorts.

Here are the results below. Volume is the 10 day moving average of volume and Distance is the distance the stock is stretched (in percentage terms) above the 10 day moving average.

Comments »

Power Dip System Update

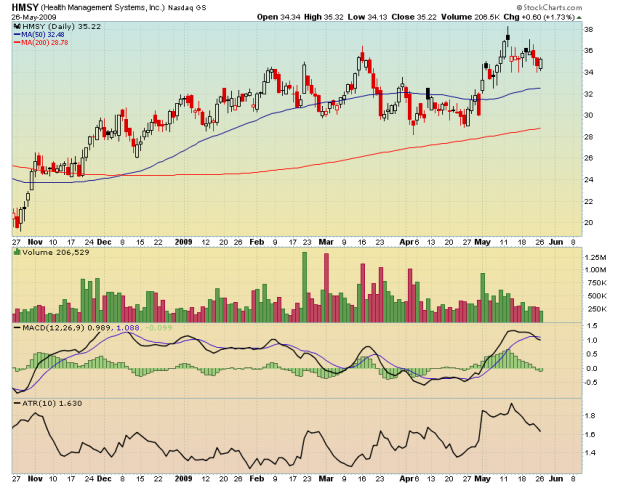
On today’s open the system purchased HMSY.

I bought it in my personal account and was filled with no slippage at the listed open. I have placed a 10% stop.

The system is now long three stocks:

AMAG -0.32% (This one will be sold on tomorrow’s open. It still looks very pretty, but I must stick with the system).

HANS -3.51% (No sell signal yet, but today’s bounce off the 50 day was sexy).

HMSY +2.49%

With a little luck, AMAG will gap up tomorrow, and I’ll exit near breakeven. HANS will follow through on today’s momo, and I’ll exit it close to breakeven in the near future, and HMSY will continue bouncing, and I’ll exit it with solid gains. I have found that these dip-buying plays will roar back with strength, when least expected.

Comments »

Deconstructing the Double 7s: TradingMarkets vs. Woodshedder

TradingMarkets does a good job of providing technical setups, as well as trader education services, with most of it available free-of-charge. Some of the recent publications from TradingMarket’s Larry Connors and authors Cesar Alvarez and David Penn promise simple yet profitable strategies. Indeed, as I found, the Double 7s does make money, although the test did not account for commissions or slippage.

The problem with the Double 7s strategy, traded over the SPY, is that it does not trade often enough to generate a substantial annual return. However, TradingMarkets lists three other ETFs that work well with this strategy. In fact, they mention most of the equity ETFs work well with the Double 7s. The solution to the lack of opportunity may be to trade the 7s across a portfolio of ETFs.

Here are the results as published in Connors’s book, vs. the results when I tested the strategy on the same ETFs.

*denotes data from AmiBroker platform. Tradestation results are used everywhere else.

Except for two places (SPY #Trades and QQQQ Avg. % p/l) the data derived from my testing is close to the results reported by TradingMarkets. I have a suspicion that TradingMarkets may have used the SPX 200 day average and applied it to the SPY, when the ETF was fewer than 200 days old. That may explain the 13 extra trades. The other difference in the #Trades seems to be due to subsequent strategy trading after publication of TradingMarkets results in 2008.

I did not determine why the AmiBroker Avg. % p/. results of 0.67% differs so greatly from TradingMarkets results of 0.93% for the Qs.

My main concern is that the system behaves as advertised, and it appears that it does.

The one detail not published about the Double 7s are equity curves. A strategy can be profitable and not be tradeable. The equity curve can help one determine if a profitable strategy is tradeable.

QQQQ Equity Curve
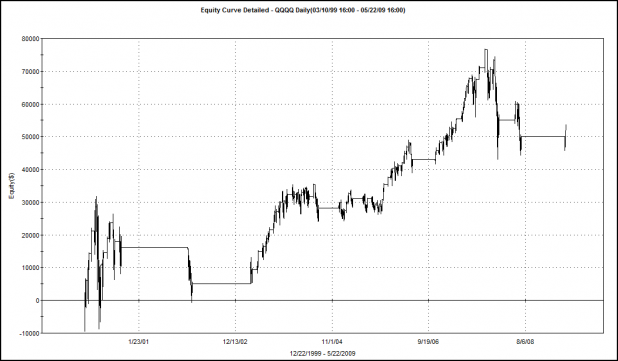
Not very pretty, or smooth… Notice the large drawdowns.

FXI Equity Curve
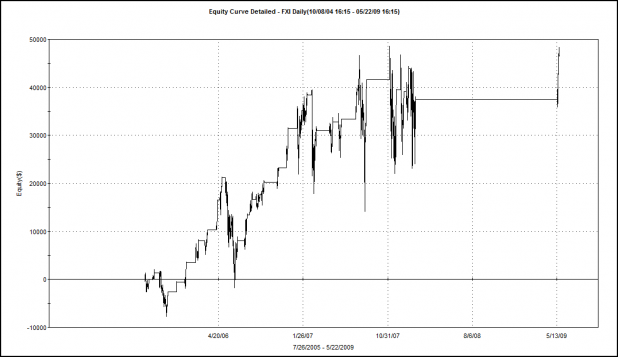
Note the huge drawdowns on FXI. One of the drawdowns was well over 50%. Again, not pretty, or smooth…

EWZ Equity Curve
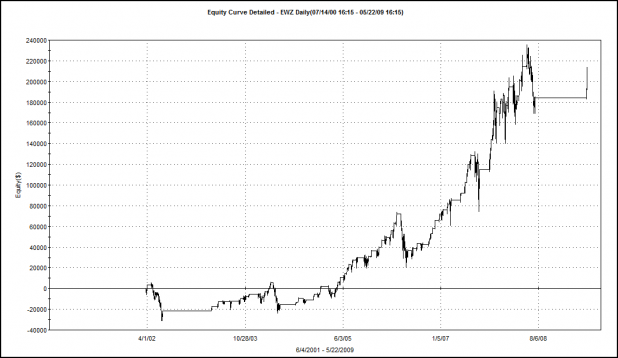
The EWZ equity curve is a little better, there are several large drawdowns. One thing is for sure…this strategy likes to be traded over EWZ. The annual rate of return, when traded over EWZ is 14.10%, or almost double the return when the Double 7s is traded over the SPY.

What’s Next?

I have determined that results as reported by TradingMarkets can be replicated. However, the analysis has uncovered weaknesses in the strategy. These weaknesses have not been reported or discussed.

The first weakness is that the system does not trade often enough. By allowing the system to go short and trade a portfolio of ETFs, we can expect greater opportunity.

The second weakness is that the system, while profitable, may not be tradeable, due to the large drawdowns exposed within the equity curves.

Adding a short component to the system may smooth the equity curves. Also, allowing the system to trade a portfolio of ETFs may smooth the curve as well. We have to be careful though, assuming that the ETFs will trade independently of each other and smooth the curve, because as we saw in October and November 2008, all correlations became 1.

The next post will examine how adding short trades affects performance.

Comments »

Power Dip Setup for Thursday

The system went long HANS at yesterday’s open.

Today the system will buy another dip, purchasing AMAG on the open. A 10% stop will be used.

No time this morning to post a chart. So sorry.

Comments »

Deconstructing the Double 7s: System Metrics

As mentioned in the previous post, running a backtest of the Double 7s system on different platforms exposed inconsistencies in the data used for the tests.

Comparing each platform’s trade-by-trade report shows that data provided by Norgate had 14 instances of prices that did not match the prices provided by Tradestation data. Many of these inconsistencies seemed to be caused by consecutive closes at the same price. There were 12 trades taken by Tradestation that were not taken by AmiBroker. Most of the errors were found in the first 2 years of trades.

While it is possible the code and settings for each platform are not exactly the same, after examining many of the trades in charts, the inconsistencies seem to extend from different data vendors. I do believe the code is working the same on both platforms, but that the data I’m using with the AmiBroker platform is different. I will probably email the vendor and inquire.

Alright, enough robot talk, here are the results:

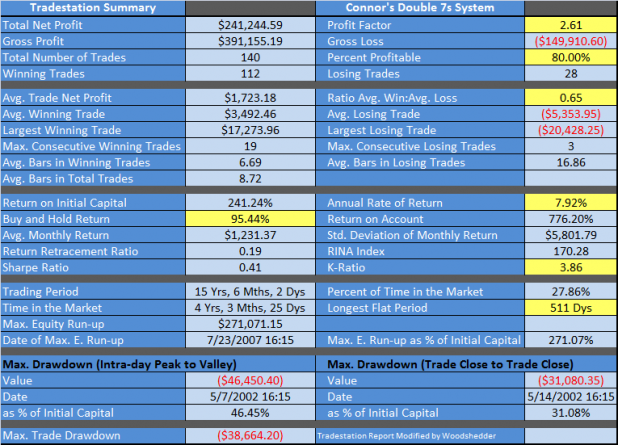
Tradestation Report:

The metrics I find relevant or want to make mention of are highlighted in yellow. Because the system periodically shuts down when price dips beneath the 200 day average, it is somewhat restrained in terms of its ability to generate a large annual return. The system did more than double the buy-and-hold return.

Note the good profit factor, high win%, and high K-ratio.

The ratio of average win:average loss is a tad low,  and the last trade the system closed was on 11/28/07.

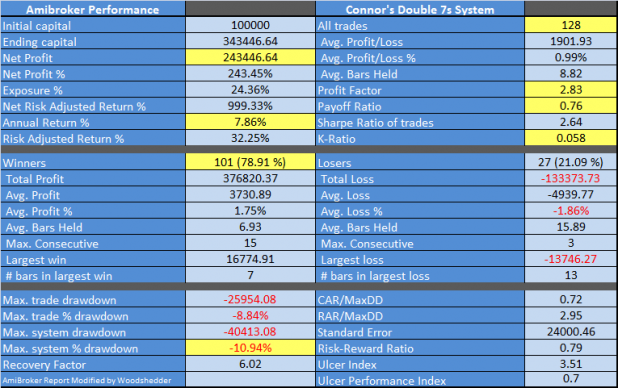
AmiBroker Report:

I like the AmiBroker report as it shows some key metrics in terms of percentages. When trading an index, it is important to calculate gains in percentages rather than dollar value as the percentages can be applied to projections of performance into the future.

Note the slight differences in some of the metrics. This is to be expected since the system traded fewer times and the data seemed to have some inconsistencies. Still, results are very similar, as we would hope they would be.

One of the metrics that AmiBroker includes in the default backtest report is Max. System % Drawdown. The Double 7s shows a -10.94% drawdown, which is decent, but with an annual % return less than the max system % drawdown, there is room for improvement.

Tradestation shows a max system % drawdown of 14%, which is almost double the annual return.

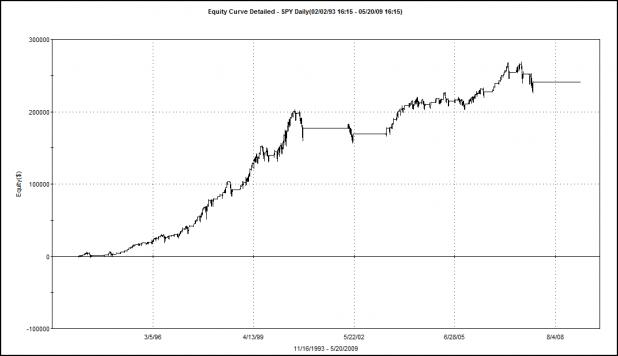
For the visually stimulated, here is the equity curve of the Double 7s, generated by the Tradestation data.

What’s Next?

Because I think it will be fun to compare my results, which were compiled on the same platform and theoretically with the same data, to the results published by TradingMarkets and Connors’s, that is what I will do next.

Once the comparison is out of the way, the tweaks, modifications, and optimizations will begin. I believe the easiest way to make the Double 7s earn more is to provide it more opportunities to earn. A simple way to increase opportunity is to let the system go short. Testing a short setup that is symmetrical to the long setup will likely be the first test I’ll run.

Comments »