iBankCoin
Home / Woodshedder (page 206)

Woodshedder

Reader Request: JCG

Gapping & Yapping has been preaching the gospel of Jay Crew for several weeks now. Lets take a look at the chart.

JCG is in a confirmed downtrend, but is showing signs of trying to buck the trend. Today’s move on volume found the stock stuck just beneath the 50 day average and the downtrend line, and several points beneath the 200 day moving average. With the RSI(2) near overbought, and longterm resistance just overhead, it may be prudent to be cautious at this critical junction. However, both the MACD and Stochastics have room to move up, and so should the price.

 Should JCG over take the 50 day average and the downtrend line, it would represent a significant change in the trend. It seems the bet here is that the trend is changing. If that is true, then $34 should definitely not be breached.

Comments »

Open Letter to the Bulltards

C’mon folks. Really. People are actually lashing out at me for being a bear here. The fact of the matter is that I feel confident in my assessment of the market, and last time I checked, it was a good thing to have convictions.

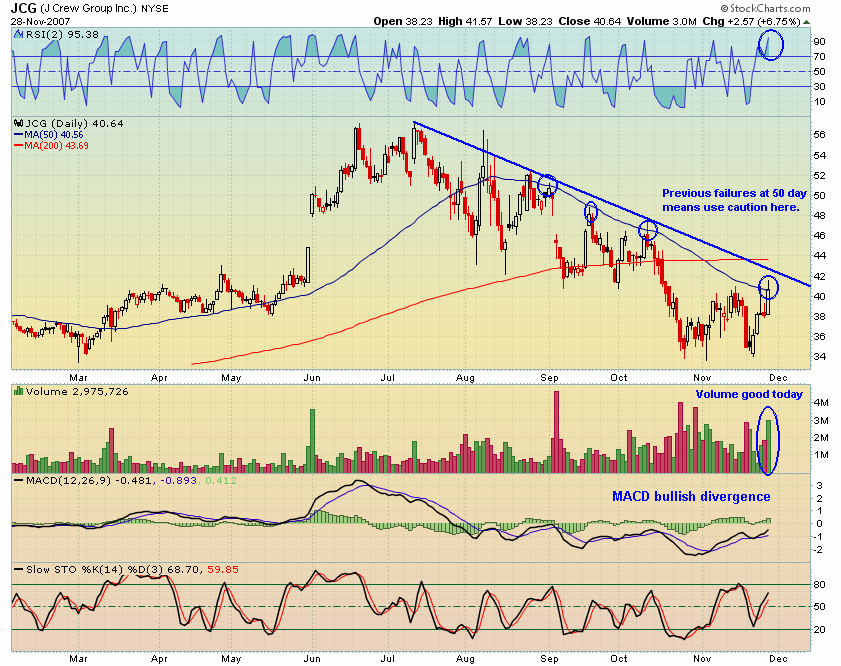
Also, I’ve been clear about the impending bounce. I wrote about it here in Examining Market Tops, but alas, I was a day early.

Just so everyone knows, I like to debate, argue, and throw jabs. It is fun. However, I don’t wish anyone to lose money. Except for maybe JJ. But probably I would not even wish JJ to lose.

This is a market. There will be differing opinions.  Just because I’m a bear here does not mean I’m out to destroy your positions. I could easily argue that my point is to save you money. But then you would have to agree with my assessment of things.

From here the market could keep going up. I do not think that it will. It might very well go sideways until the Fed meets. Thus, I am not going to get aggressively short until I see the upward momentum wearing off, and another down move begin. Even then I will not commit a very large percentage of my capital on the short side.

In short, do not take my bearishness personally. It has nothing to do with you. Honestly, I have watched markets move down and back up for 4 years now, and never really participated on the downside. I have studied and planned for this type of event, and I will stick to my guns.

I may be wrong, or I may be early. Either way, I can sit back and enjoy the banter with everyone as I know I am not going to blow up my account with my small positions.  I encourage you to enjoy this time as well, as this seems to be where real traders stick out, and bad traders fade away.

Comments »

Examining Market Tops: Nasdaq 1996

This chart of the 1996 Nasdaq correction looks very similar to previous corrections. 

From its intraday high in May to its intraday low in July, the market moved down ~20%.

Judging from reader comments, I need an operational definition of “leg down.” While I’ve not settled on one yet, I’m thinking that any period where the market does not make new lows can be considered a bounce, or consolidation, and when those lows are subsequently broken this would represent the start of another “leg down.” Up for discussion is how many days without new lows are required for a period to be a consolidation or bounce. I’m leaning towards 2 days.

One interesting development from this examination of tops is that the Stochastics consistently have nailed the bottom. Combining a Stochastics buy signal with a requirement for volume to be x% greater than the 50 day average when the signal occurs might make for a profitable way to play corrections.

Finally, I want to continue to emphasize that these moves typically come in waves (legs). The selling tends to dissipate after a capitulation day.

Comments »

Examining Market Tops: Nasdaq 1990

Broker A (formerly known as The Fly) stated that veterans were feeling that the current correction felt similar to that of 1990-1991.

The chart shows the typical pattern for a correction: Sharp down moves followed by short consolidations. One aspect which should be noted are the capitulation days which are marked by big moves on large volume. Also, when the bottom actually was put in, it looks as if it was marked by little fanfare. The only tell-tale signs were the bullish divergences in the indicators and the higher-low.

It might be interesting to understand what caused this correction. Does anyone out there remember?

Comments »

The Daily Breakdown: TNE

This evening’s feature stock is trading beneath both its 50 and 200 day moving averages. Unlike many stocks that are breaking down, it is not extremely over-extended beneath its recent base.

All the typical caveats apply here. The RSI(2) is 2.5, which means that this stock has some bounce potential. However, a few days trading around or just beneath the 200 day would work off this oversold condition and still provide a great entry for a short position.

Comments »

Are Things Truly Different This Time?

What started out as a nice consolidation day turned into more of the same: A vicious sell-off.

It is time to start considering whether things are different this time. In a previous post, Examining Market Tops, we identified the typical correction pattern of several series of moves down with bounces in between. It is possible that this pattern may not come to pass. Traders should be developing a plan that includes the possibility of a steeper sell-off, with very little consolidation.

We know that history shows a bounce should be forthcoming. The fact that the market continues to sell-off in the face of oversold conditions is a telling sign. Remember, these moves down typically end in a capitulation or panic event. We have had neither, yet. It may be that there is no bounce, just a steeper move down, ending in a panic or capitulation day.

With many traders waiting (hoping) for the retail sales to provide a tradable bounce, and the same traders now realizing that a bounce from the Black Friday sales is not going to happen, my guess is that the panic sets in sooner than later.

Instead of watching for a bounce, the key indicator will now be watching for capitulation and panic. Unfortunately for the bulls, today’s sell-off did not have enough volume on the move or enough negative sentiment to be considered panic or capitulation.

Comments »