The simplest ideas are often some of the best. This is a mantra that should often be repeated by traders and investors. The simplest ideas persistently produce profits for long periods of time. I don’t know if this is because they are so simple that they are ignored or because they identify and exploit the structural architecture of markets.
With that thought in mind, I was recently reading a newer blog, Don’t Talk About Your Stocks. This gentleman wants to trade trend following systems but is relatively new to backtesting and system trading. I can identify. I have a keen memory of where I was and what I was doing when I first read Covel’s Trend Following. Similarly, deciding that I would no longer trade discretionary patterns but would instead follow quantifiable, rules based strategies, was a defining moment in my development as a trader, investor, and system designer/tester.
So the SPY 10/100 System is his first attempt at following a rule-based, quantifiable, trend following system. The only problem is that he can’t backtest it. That is a huge handicap, as it certainly stinks to have to paper trade a system for a few years before realizing that it would have worked or didn’t work. Because I like simple ideas and because I can absolutely identify with his desire, I am going to backtest it for him.
We shared a few tweets and I was able to discern the rules for the SPY 10/100 System.
The Rules:
- Buy SPY at the next open after the 10 day simple moving average closes above the 100 day simple moving average
- Sell SPY a the next open after the 10 day simple moving average closes beneath the 100 day simple moving average
-
I have not included any commissions or slippage. All SPY history was used for this test.
The Results:
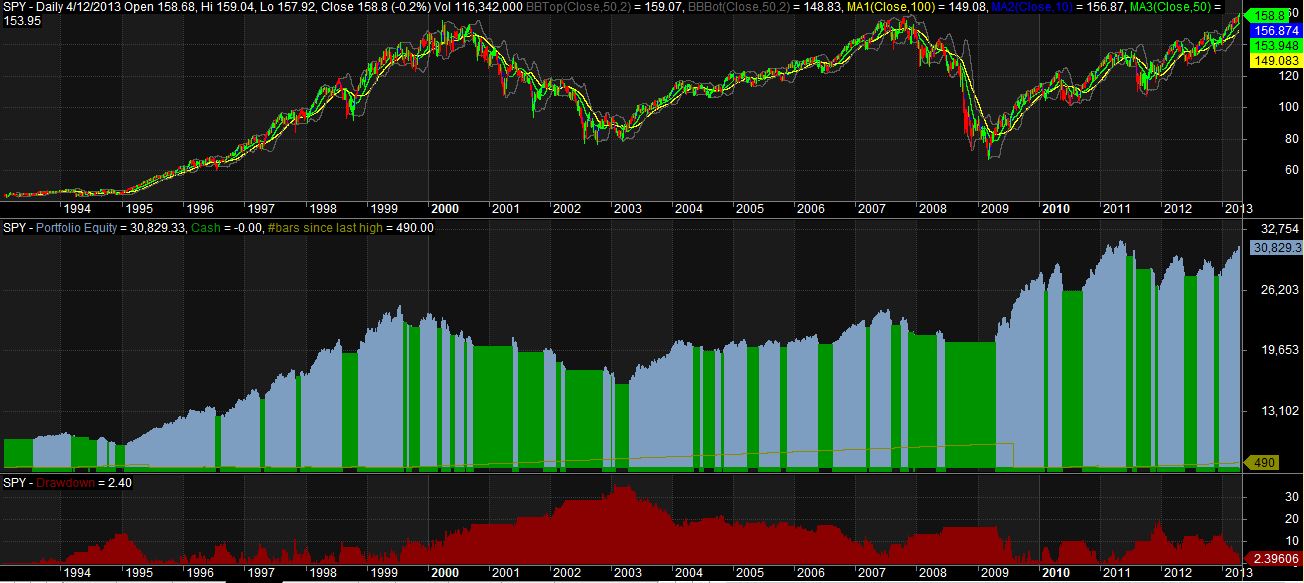
Upon first glance, the equity curve and drawdowns both look promising. It fared well during the Armageddon trade of 2008 but has missed some of the rally from 2011 to the present.
Let’s dig deeper into the system’s statistics:

The 5.73% compound annual growth rate did not beat SPY buy and hold which was 6.58% over the same time period. However, the buy and hold drawdown was significantly worse at -56.47% against the 10/100 system maximum drawdown of -35.81%. Since the system does make many more trades than buy and hold, once commissions and slippage are factored in, results would be worse. Note too that trading the open is hard to replicate using all but the most expensive data packages because of how the opening price is reported by the exchanges. I would feel safer replicating trading at the close.
Let’s look at the historical profits and losses:
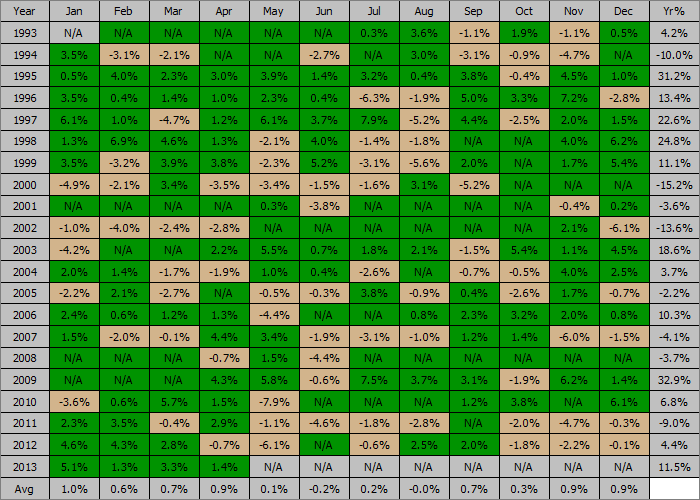
As the stats show, and as the author indicated, this is a trend following system. This means we can expect the system to take many small losses and gather fewer large wins. Over time, the large wins make up for the many small losses. This should be intuitive. Markets do not trend all the time. Small losses are taken until the market embarks upon a strong trend.
Reading about a trend following system can be awe-inspiring as 20 years worth of profits can be encapsulated in one graph. From experience, trading such a system is entirely different. It can seem like a lifetime when the system is whip-sawed over a year or so before it catches another winning trend. Perhaps this is another reason why these simple system can endure over time. Most people can not trade them consistently and long enough to significantly erode the edge.
Profit Distributions:
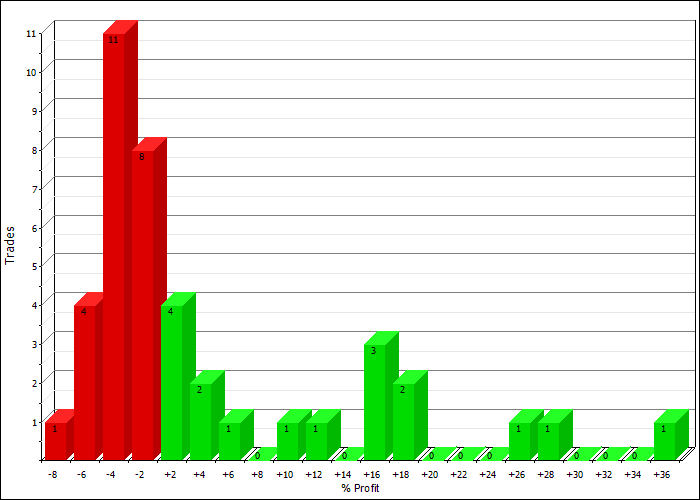
I included this graph because it shows the typical trend following system profit distribution: Many small losses with fewer large wins.
The Bottom Line:
Overall, the 10/100 system is viable in that one is not likely to lose his starting equity if his life saving were to be thrown into it. If the goal is to beat buy and hold and decrease the associated drawdowns, the system is not viable. It does occur to me though that trading the SPY 10/100 system may be a good way to start trend following or system trading in that it is like learning how to ride a bike with training wheels…You can’t go very fast but you have some protection against crashes.
One final note. I backtested the system to 1928 using the non-tradeable S&P 500 index, and the results were remarkably similar to those above. This tells me that this system is not likely to break down or get much better. It will over and under-perform depending on the differing market regimes, but over time the performance should remain remarkably average with the benefit of decreased drawdowns.


Adding a short component to the system so that it is always either long/short reduces performance significantly to 1.42% compound annual growth with max drawdown of -62.02%.
Typo on short rules – 100 sma below 100 sma. Nice post!
Thanks!
Is the Gentleman comfortable using excel? It is very easy to backtest trend systems such as MA crosses in Excel. I think it is the easiest way for most people to start system testing.
I am very comfortable with Excel. That’s pretty much the only thing I learned in college.
Is there a guide to backtesting with Excel that you would recommend?
I am not aware of any guides. If interested, email me and I will send a super simple template for an excel MA cross system. Like others have mentioned you can get started with yahoo finance’s free data.
I realize this is a very general question, but is there an easy/low cost way to backtest systems like this? Where does one get the market data to do so easily? Excel is mentioned above, but are there relatively low-cost online services that will do it?
I use Excel, with free data from Yahoo, Google, or any of the ETF sites. You get open, high, low, and close. I’ve spent hours finding free commodity data; it isn’t easy. If you want intraday stock data I don’t know of any free sites. I think Woodshedder uses Norgate data and said he was happy with it. None of the free sites have great data – lots of missing days, and some days just have wrong data. I fix it by hand; not too bad for a few data points, but I did 100 stocks/15 years and fixing the bad spots took a weekend (they’re not the same days for each stock). I’ve also used the DJ Indexes – free with registration.
There are software packages to do trading analysis and backtesting, but I can’t comment on them. I’m pretty sure Wood uses Amibroker. If you really want to do statistical analysis you will need to use something like S or Python, or Matlab. So far I’ve been able to do everything I want in Excel, without macros.
Thanks — appreciate it. Just looking to do some pretty basic models (MA crossovers, etc.).
Wood, one thing I look at when doing testing is exactly what you state. I compare how the system performed during 2000-2003 with 2007-2010, because these are very different market regimes. Typically they have very different performance numbers – drawdowns, entries vs exits, gains. But comparing the two times gives me a good feeling for what might happen going forward. A system that is great during one period but lousy during the other probably won’t work well in the future. This system doesn’t seem too bad from that viewpoint. You just might have to trust it for a couple of lousy years until it catches a tailwind.
Regarding your point about buying/selling at the open. As you know I like Excel, and I agree with Nat’s comments. If you’re trying to buy or sell at the open, I would probably add a fudge factor to adjust the price (a discount or premium) based on that days volume and price swing, since the real tradable price may be way off the reported open. You’d have to guess what the parameters are until you built up some experience. Not too difficult in Excel – can that be done in Amibroker?
Woodshedder–
What are you using for software/program for building your systems & backtesting strategies?
Hi there everyone…had baseball tournaments today. Sorry I am late to respond.
I use Amibroker with Norgate Premium Data. I highly recommend both, especially if you do not come from the coding/programming background. They are different products but work seamlessly together.
If you do have experience coding, then matlab, R, python, etc, will get you started. I caution against Tradestation as you cannot backtest at the portfolio level, which is a huge and fatal flaw, imo.
Excel can be a great place to start. As Bozo noted, there is lots of free data out there, but it requires some time to fix the corrections. The only thing I use Yahoo data for is for mutual funds, and it is easy to check and cross reference that data against the fund’s sites to fix the errors.
I do highly recommend a survivor-free database, in other words, a database that contains all stocks/companies even if they have gone out of business, if you are going to test a system on stocks. It is a must. I cannot overemphasize how important it is to understand the effect of survivorship bias.
Also, only the best of the very best data providers will get the the correct and actual opening prices. Instead what will be reported is the consolidated open, and not the actual open. Norgate does not do this. However, for the price, it is the best. If you want to spend thousands per year on data, then you can get the actual opening prices. For me, I’ve just made workarounds or decided to trade the close, which has reported prices that are usually very accurate.
As you stated in your post, I am very new to all of this. This stuff is incredibly fascinating to me.
How much does the Amibroker/Norgate package you use cost?
Do you have any reference guides for getting started backtesting in Excel like is discussed above?
Any thoughts, suggestions, or ideas to optimize the system? I understand now that it would have been more accurate to use closing data. Would it make sense to test a dozen or so combinations of moving averages?
Thanks for all your help! Learned more from this post than anything else I’ve read this year!
To get set up with AmiBroker professional edition and a year’s sub to Norgate, I think you are looking at around $500.
However, there are differing data packages, so it might be more or less, depending on what you want.
You can test many combinations of moving averages but it will be hard not to curve fit the system approaching it that way.
Good work! I also think the MA50/MA200 discussed in the price action lab blog a few days ago is superior to this MA10/MA200 system: http://t.co/9uzekP0m5M
Thanks Joe. That is a good article. I’ve tested many moving average variations, but the 50/200 is perennially popular.
Hey guys, thanks for all the comments. Unfortunately they all got sent to my spam folder so I didn’t know new comments were posted. I’ll be responding now that I know they are here.
As long as the market is trying to edge back to VWAP, this will work. If real volatility returns I wonder how an inverse of this would work (i.e. buy on your sell signal and sell on your buy signal)
Cheers.