I know tomorrow is technically the last day of the month, but barring catastrophe, the Fidelity Sector Fund Rotational System is set to beat the S&P for the month and the year.
I designed the system in early 2010, and watched the out-of-sample performance until February 2012, when I began trading it live.
Here are the results since inception:
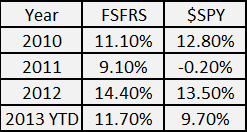
These results do not include commissions or slippage for either the Fidelity trades or $SPY. There is no commission or slippage incurred when trading these Fidelity sector funds. There would be an initial commission for the $SPY purchase. Dividends for $SPY and the Fidelity funds are also not included.
For the month the system is up 4.5% while $SPY is up 3%.
The system is currently long the following three funds:
FSAIX (Air Transportation)
FSRFX (Transportation)
FSUTX (Utilities)
The top 5 ranked Fidelity Sector Funds are as follows:
- FSAIX (Air Transportation)
- FSUTX (Utilities)
- FSRFX (Transportation)
- FBMPX (Multimedia)
- FSPCX (Insurance)


Drawdowns are better too but I ran out of time to write about that tonight…
Cool – so how does it work? Where is the system outlined?
Very simple.
Ranks them based on momentum divided by a volatility calculation.
Holds them for 30 days at least (fund requirement) and doesn’t sell unless the market corrects and falls beneath a moving average OR the fund moves out of the top three funds. It is then replaced with another fund.
If the market is beneath the moving average then the system moves to cash as fast as possible, considering that all funds have to be held for at least 30 days.
You can see some of the original posts by clicking on the right sidebar –> Categories –> Fidelity Rotational…
Some of the original posts have been made private.
Were you able to get the data for the ProFunds sector funds? Their minimum holding period is 1 day.
Yes the profunds data is available via yahoo. The only problem is that the sectors are not typical S&P500 sectors and most of them are levered or inverses. I will still dig deeper and see if they might work.
Not sure if you have tried it but I use what looks like a similar ranking for momentum.
It uses a 220 day MA and then look back 50 days and divides it by the 10 day ATR.
Basically looking for the stocks with the highest long term angle of their moving average and lowest volatility.
(MA(0) – MA(-50) / ATR current)
Thanks twister, that is interesting.
To be clear, you subtract from the MA220 the MA50/ATR(current)?
And the difference is what you use to rank the stocks?
no.
MA220(current)-MA220(50 bars ago)/ATR(current)
I use a threshold of 3 as the cut-off. So you rotate to cash as momentum dies